Gold prices edge lower; heading for weekly losses ahead of U.S.-Russia talks

Introduction & Market Context
Shenandoah Telecommunications Company (NASDAQ:SHEN) presented its second quarter 2025 earnings on July 31, highlighting continued progress in its strategic transition from legacy broadband to fiber-based services. The company reported modest revenue growth but significant profitability improvements, with adjusted EBITDA rising 21.9% year-over-year. This performance comes after a challenging first quarter when Shentel missed both EPS and revenue forecasts, resulting in a 4.69% stock price decline.
The regional telecommunications provider continues to expand its Glo Fiber footprint across multiple states while managing the gradual decline of its incumbent broadband markets. The company’s stock closed at $14.80 on July 31, 2025, down 0.74% for the day, but remains well above its 52-week low of $9.77.
Quarterly Performance Highlights
Shentel reported Q2 2025 revenue of $88.6 million, representing a 3.2% increase from $85.8 million in the same period last year. More impressively, adjusted EBITDA grew to $28.4 million with a 32.1% margin, up 21.9% from $23.3 million (27.1% margin) in Q2 2024.
The company’s performance was driven by strong growth in its Glo Fiber segment, which added 5,700 new subscribers and over 16,000 new passings during the quarter. Glo Fiber revenue increased by 40.5% year-over-year, helping to offset declines in the incumbent broadband markets.
As shown in the following chart of consolidated financial performance:
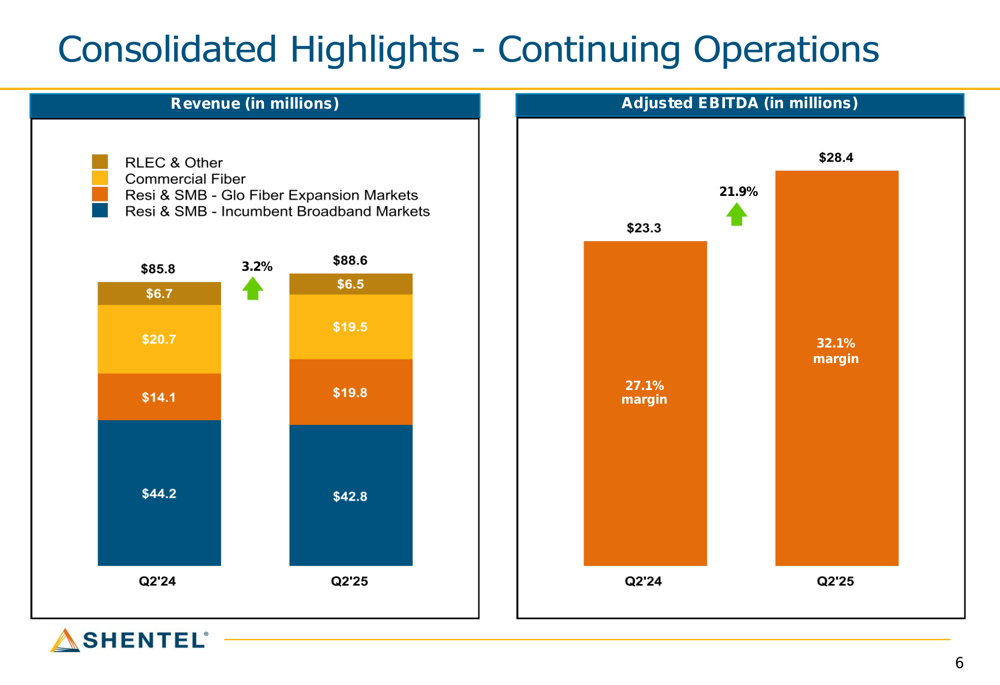
The revenue mix continues to shift toward Glo Fiber expansion markets, which grew from $14.1 million in Q2 2024 to $19.8 million in Q2 2025. Meanwhile, incumbent broadband market revenue declined from $44.2 million to $42.8 million during the same period.
Detailed Financial Analysis
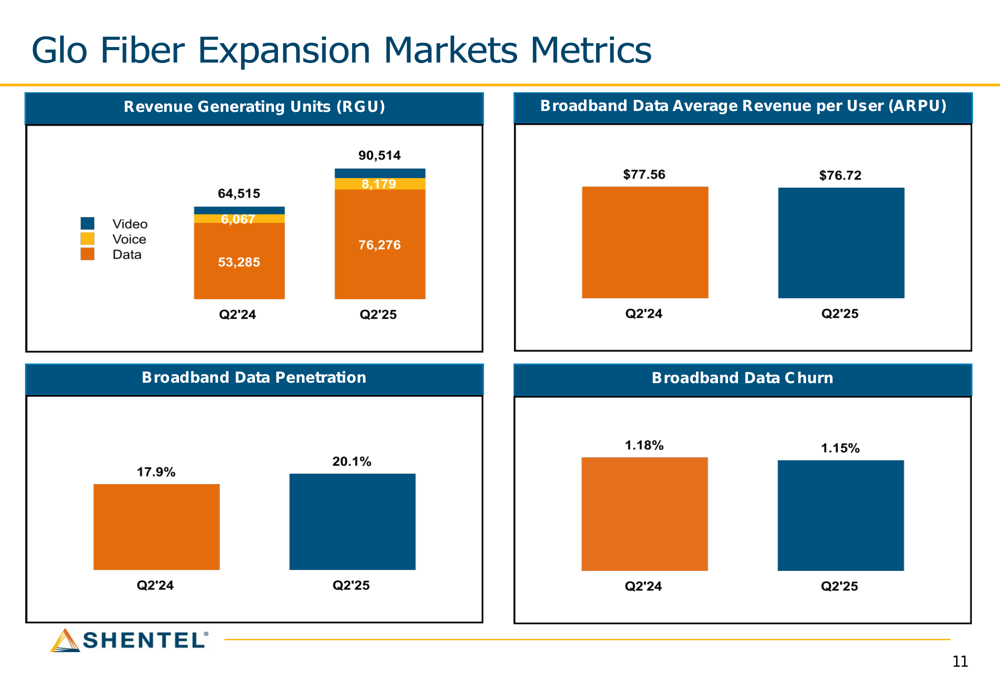
Shentel’s Glo Fiber expansion markets showed impressive growth metrics across multiple dimensions. Revenue generating units (RGUs) increased 40.3% year-over-year to 90,514, with broadband data penetration improving from 17.9% to 20.1%. Notably, broadband data churn improved slightly to 1.15% from 1.18% in the prior year.
The following chart illustrates the growth in Glo Fiber metrics:
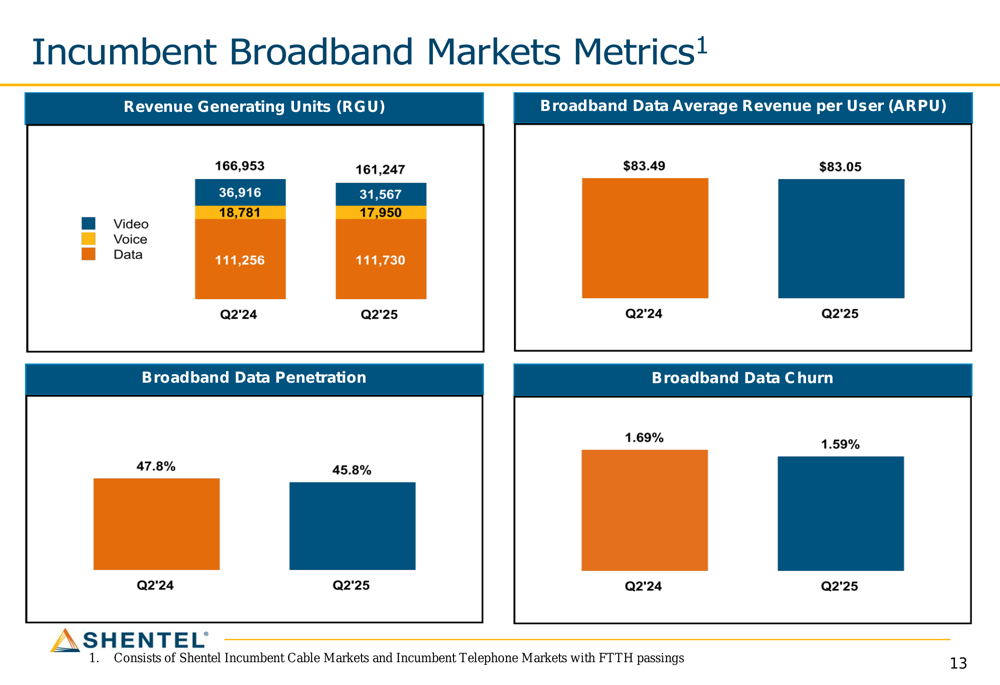
In contrast, incumbent broadband markets continued their expected decline, with RGUs decreasing 3.4% year-over-year to 161,247. Broadband data penetration in these markets fell from 47.8% to 45.8%, though churn improved from 1.69% to 1.59%.
The incumbent broadband market performance is illustrated here:
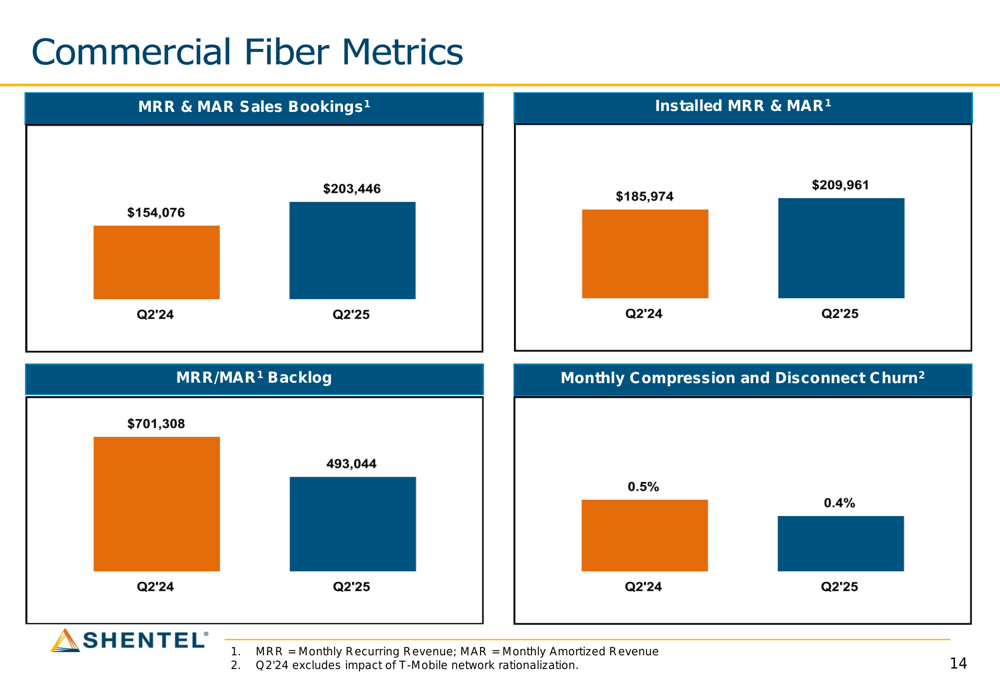
The commercial fiber segment posted another record quarter for sales bookings, which increased 32% year-over-year to $203,446. Monthly compression and disconnect churn improved to 0.4% from 0.5% in the prior year, indicating strong customer retention.
The commercial fiber performance metrics are shown below:
Strategic Initiatives
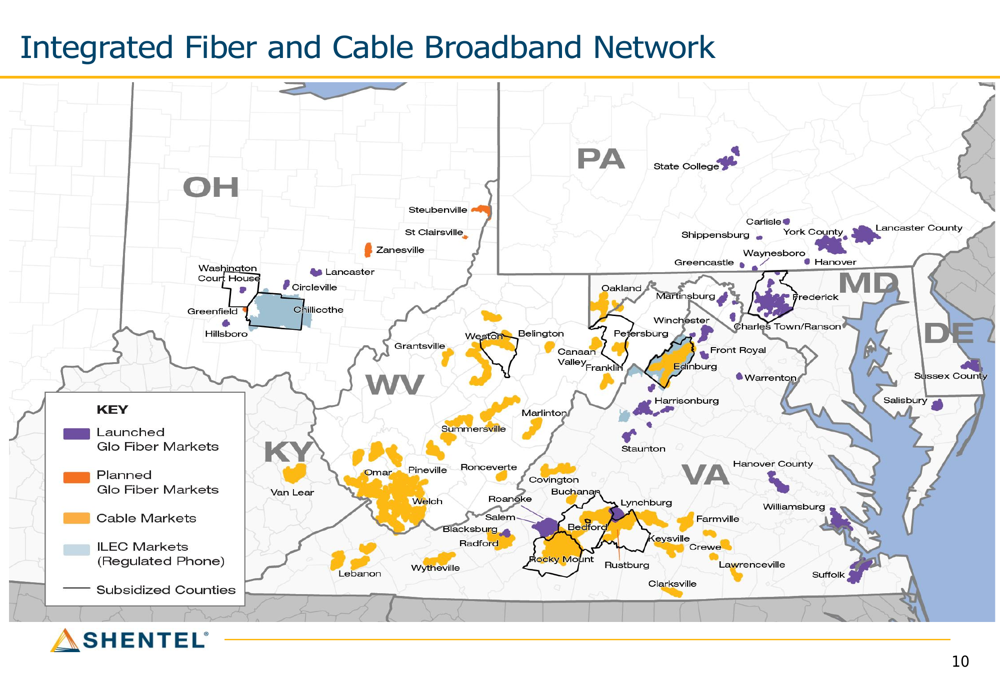
Shentel continues to expand its integrated fiber and cable broadband network across five states (OH, PA, WV, KY, and VA). The company’s geographic footprint includes launched Glo Fiber markets, planned Glo Fiber markets, cable markets, and regulated phone (ILEC) markets.
The company’s network footprint is illustrated in this map:
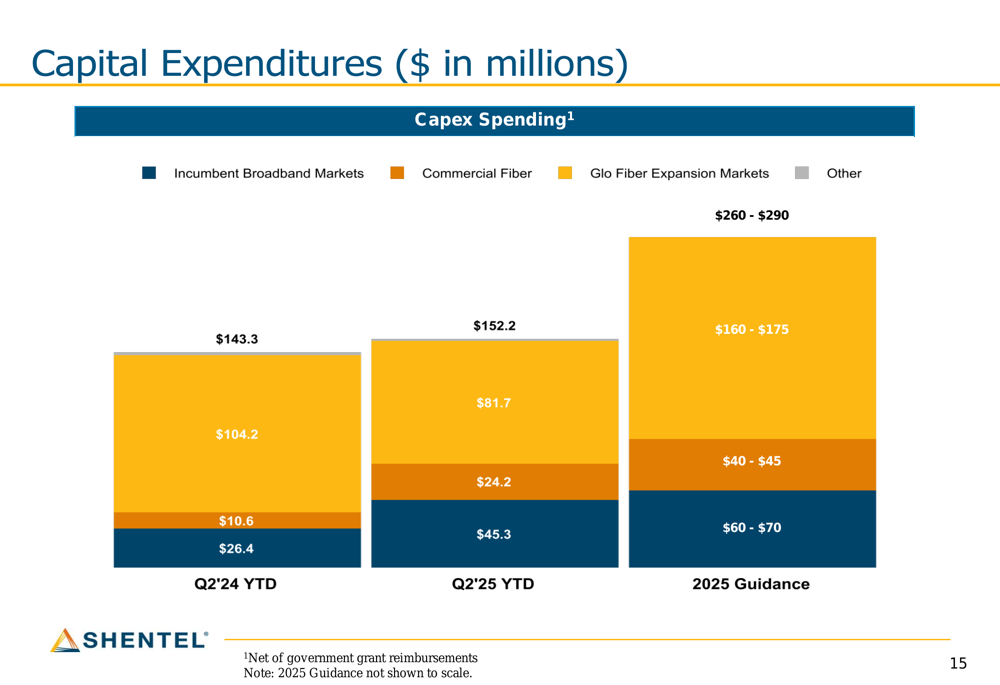
Capital expenditures remain heavily focused on Glo Fiber expansion, with $81.7 million of the $152.2 million total year-to-date capex allocated to this segment. For the full year 2025, Shentel expects to invest between $160-175 million in Glo Fiber expansion out of total capital expenditures of $260-290 million.
The capital expenditure allocation is shown in the following chart:
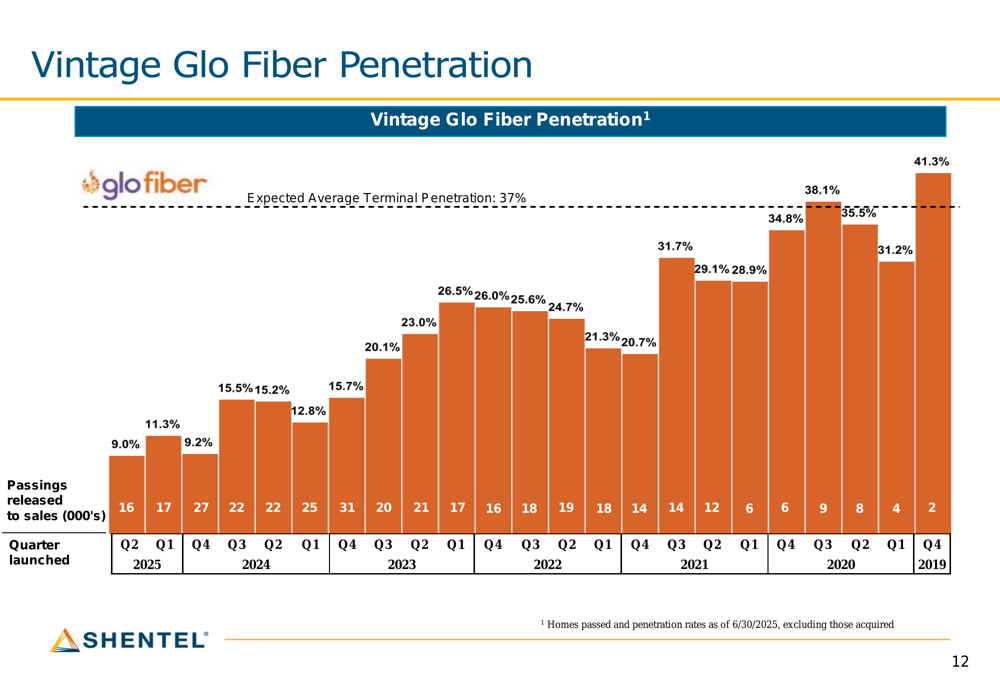
An analysis of vintage Glo Fiber penetration rates shows that markets launched in 2019-2021 have achieved penetration rates between 28.9% and 41.3%, with an expected average terminal penetration of 37%. This data supports the company’s long-term growth strategy for its fiber business.
The vintage penetration data is illustrated here:
Forward-Looking Statements
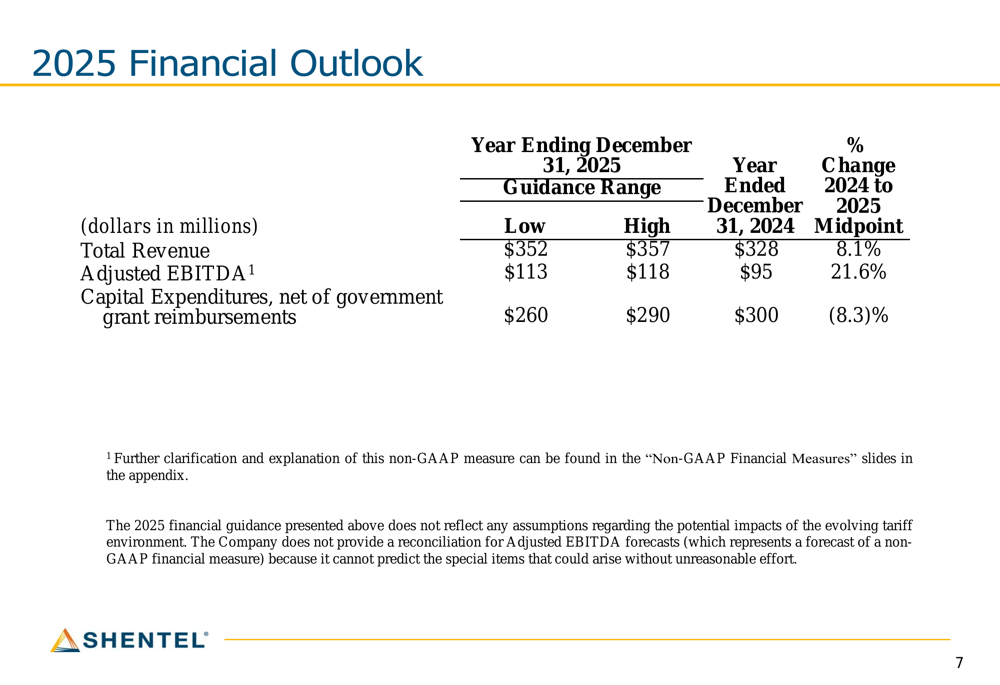
Shentel maintained its 2025 financial outlook, projecting total revenue between $352-357 million (8.1% growth at midpoint) and adjusted EBITDA between $113-118 million (21.6% growth at midpoint). Capital expenditures are expected to be $260-290 million, representing an 8.3% decrease from 2024.
The company’s financial outlook is detailed in this table:
Management highlighted that Glo Fiber and Commercial Fiber revenue is expected to exceed Incumbent Broadband Markets revenue in 2026, marking a significant milestone in the company’s strategic transformation. This shift should support continued margin expansion as the business mix evolves toward higher-margin fiber services.
As of June 30, 2025, Shentel reported a strong liquidity position of $266.7 million, comprised of $143.0 million in cash and cash equivalents, $94.6 million in revolver capacity, and $29.1 million in available government grants. The company faces limited near-term debt maturities, with only $5.4 million due in 2025 and $10.4 million in 2026, providing financial flexibility to continue its fiber expansion strategy.
Full presentation:
This article was generated with the support of AI and reviewed by an editor. For more information see our T&C.