Nucor earnings beat by $0.08, revenue fell short of estimates

Introduction & Market Context
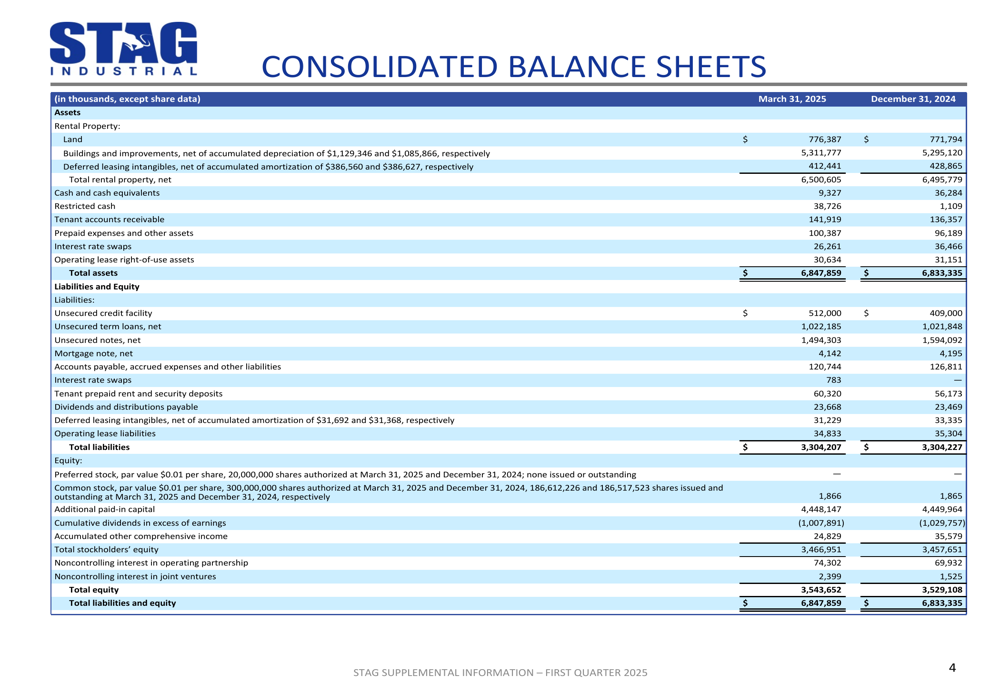
STAG Industrial, Inc. (NYSE:STAG) has released its supplemental information for the first quarter of 2025, showcasing substantial financial growth and continued portfolio expansion. The industrial REIT, which owns and operates properties across 41 states, reported significant increases in net income and rental rates while maintaining healthy occupancy levels.
The company’s performance reflects the ongoing strength in the industrial real estate sector, particularly in logistics-focused properties. With a diverse tenant base spanning multiple industries and geographic markets, STAG continues to leverage its strategic positioning to drive shareholder value.
Quarterly Performance Highlights
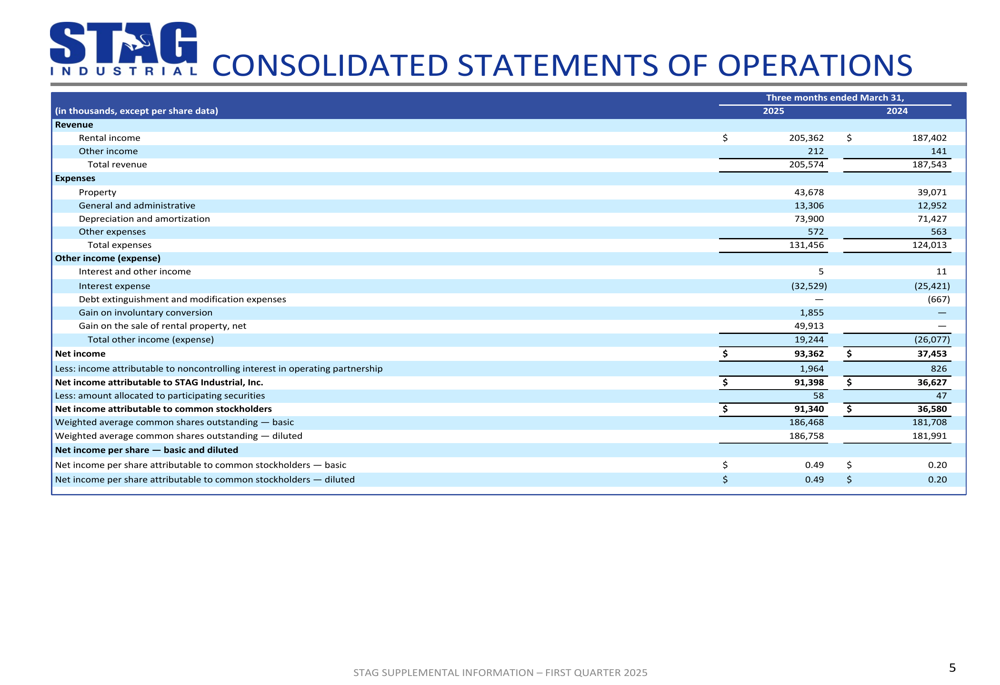
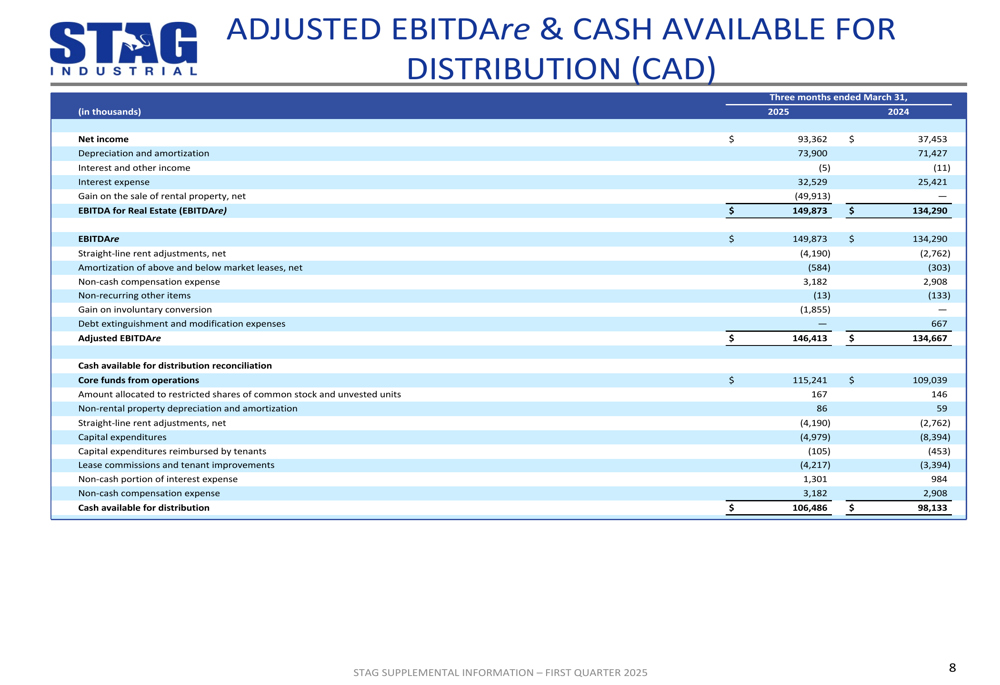
STAG Industrial reported impressive financial results for Q1 2025, with net income soaring to $93.4 million, a remarkable 149.3% increase from $37.5 million in Q1 2024. Net income per share reached $0.49 for both basic and diluted calculations, more than doubling the $0.20 reported in the same period last year.
Total (EPA:TTEF) revenue climbed to $205.6 million, representing a 9.6% year-over-year increase from $187.5 million. The company achieved $0.61 of Core FFO per diluted share, up from $0.59 in Q1 2024, demonstrating continued operational efficiency.
As shown in the following consolidated statements of operations:
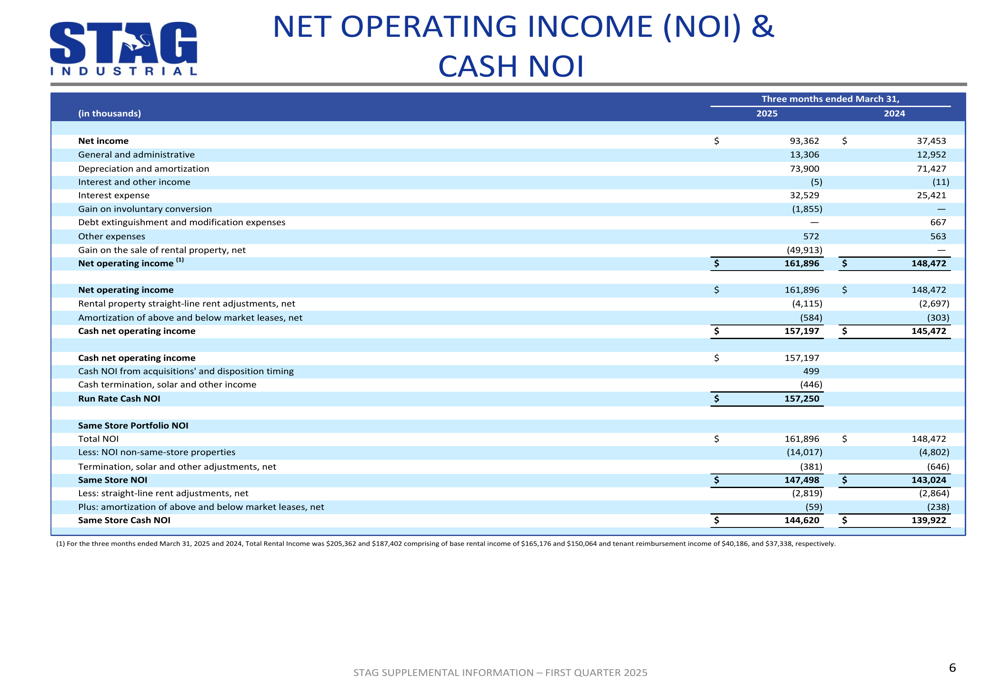
Cash Net Operating Income (NOI) reached $157.2 million, while Same Store Cash NOI grew to $144.6 million from $139.9 million in the prior year, representing a 3.4% increase. This growth reflects STAG’s ability to effectively manage its existing portfolio while integrating new acquisitions.
The company’s NOI and Cash NOI calculations demonstrate the strong underlying performance of its property portfolio:
Core Funds From Operations (FFO), a key metric for REITs, increased to $115.2 million from $109.0 million in Q1 2024. On a per share basis, Core FFO reached $0.61, providing strong support for the company’s dividend program.
Portfolio and Leasing Activity
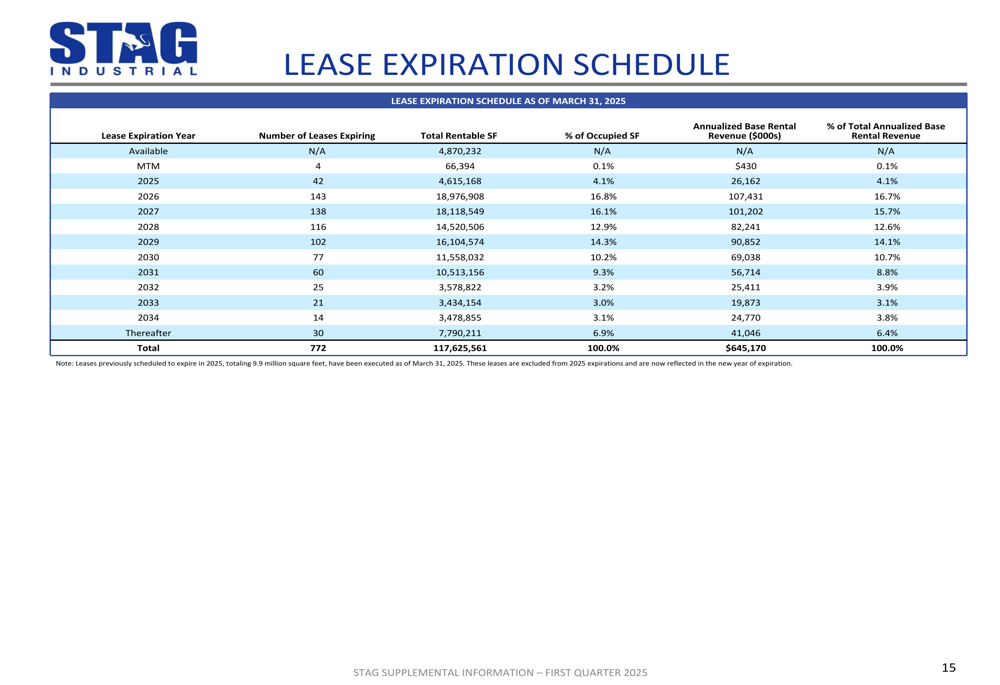
As of March 31, 2025, STAG Industrial’s portfolio comprised 597 buildings across 41 states, totaling 117.6 million square feet. The company maintained strong occupancy rates, with total portfolio occupancy at 95.9% and operating portfolio occupancy at 96.8%.
The following snapshot provides an overview of STAG’s portfolio metrics:
During Q1 2025, STAG completed two strategic acquisitions: a 161,600 square foot property in Minneapolis, Minnesota, and a 231,964 square foot facility in Chicago, Illinois. These acquisitions had a weighted average lease term of 3.2 years, a cash capitalization rate of 6.8%, and a straight-line capitalization rate of 7.0%.
The company’s acquisition details are presented here:
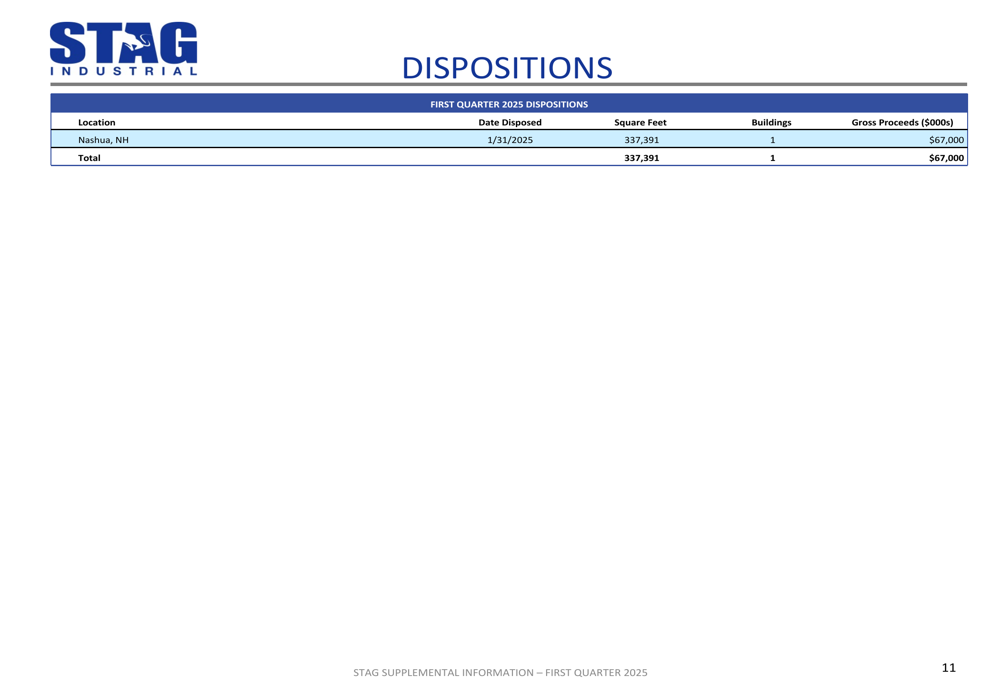
On the disposition front, STAG sold one property in Nashua, New Hampshire, comprising 337,391 square feet, for gross proceeds of $67 million. This strategic disposition aligns with the company’s portfolio optimization strategy.
Leasing activity remained robust in Q1 2025, with STAG achieving impressive rental rate increases. Cash rent change on new and renewal leases was 27.3%, while straight-line rent change reached 42.1%. The company executed new leases for 279,055 square feet and renewal leases for 4,683,573 square feet, demonstrating strong tenant retention.
The following leasing statistics highlight STAG’s strong performance in this area:
Capital Structure and Financial Position
STAG Industrial maintained a solid financial position with a net debt to annualized run rate adjusted EBITDAre ratio of 5.2x as of March 31, 2025. The company had 186.5 million common shares outstanding and continued its monthly dividend program with an annualized dividend of $1.49 per share ($0.124167 monthly).
The company’s capital structure and debt metrics are detailed below:
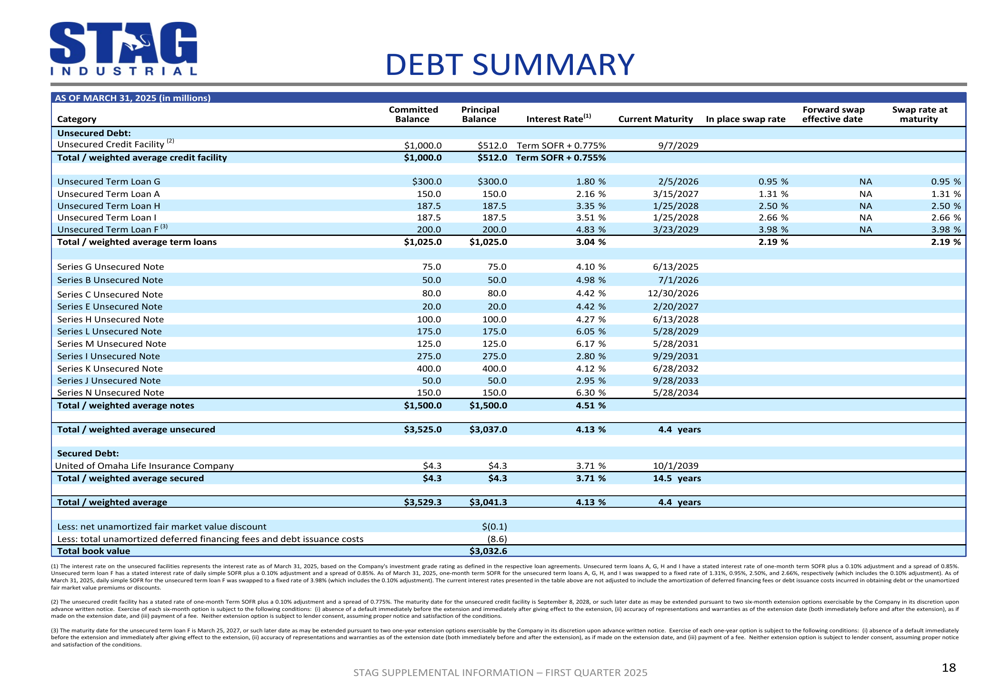
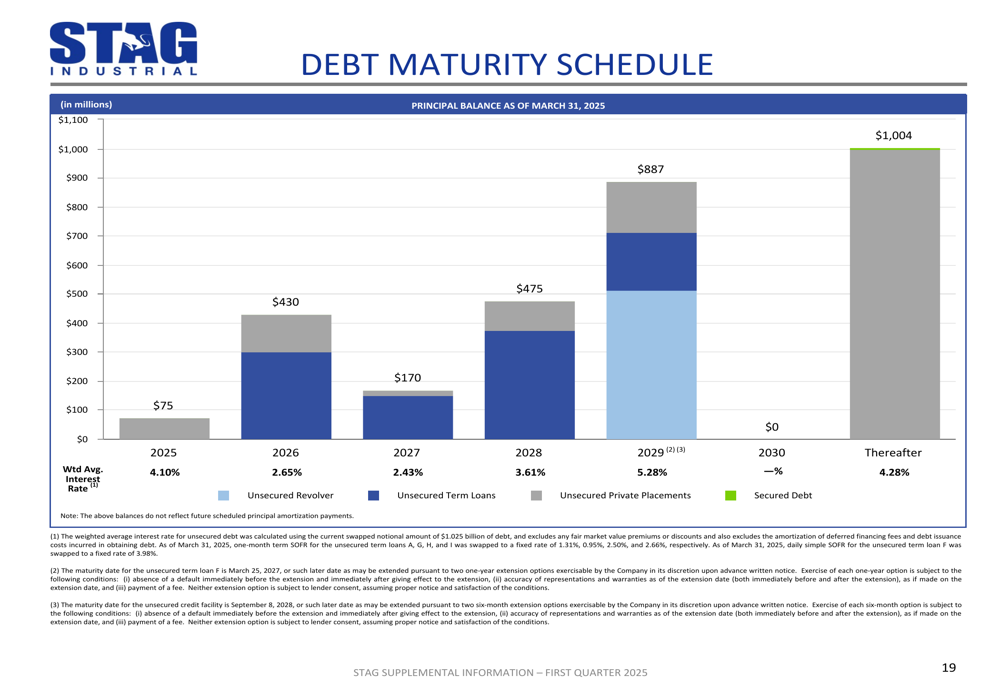
STAG’s debt portfolio is well-structured with a weighted average interest rate of 4.13% on its unsecured debt. The company’s debt maturity schedule is strategically spread out, with a significant portion of maturities occurring after 2030, providing long-term stability.
The debt maturity schedule illustrates the company’s prudent approach to financial planning:
Forward-Looking Statements
For the full year 2025, STAG Industrial provided guidance projecting Core FFO per share between $2.41 and $2.45. The company expects acquisition volume to range from $500 million to $700 million, with disposition volume between $100 million and $200 million.
Same Store Cash NOI is projected to increase by 4.25% to 5.0%, while retention is expected to be between 70% and 75%. These projections reflect management’s confidence in STAG’s ability to continue executing its growth strategy while maintaining operational excellence.
The complete guidance for 2025 is outlined here:
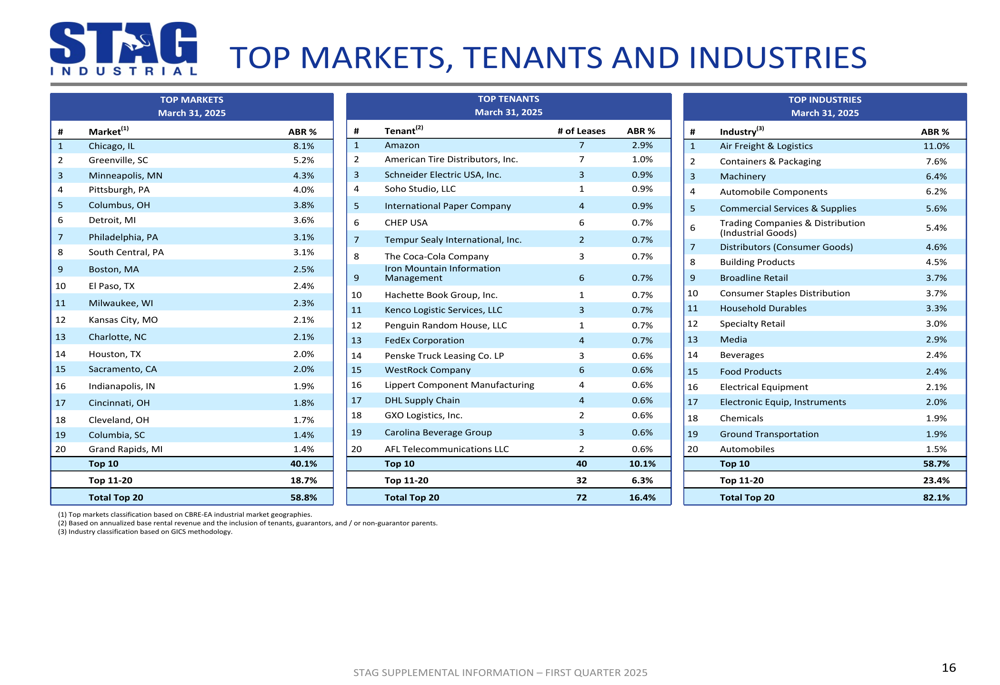
STAG Industrial’s diversified portfolio across markets, tenants, and industries provides stability and growth potential. The company’s top market is Chicago at 8.1% of the portfolio, while its largest tenant, Amazon (NASDAQ:AMZN), represents only 2.9% of annualized base rental revenue, highlighting STAG’s limited tenant concentration risk.
The following breakdown shows STAG’s diversification across markets, tenants, and industries:
Conclusion
STAG Industrial’s Q1 2025 results demonstrate the company’s continued success in executing its strategic plan. With significant growth in net income, strong rental rate increases, and strategic portfolio expansion, STAG is well-positioned to deliver value to shareholders throughout 2025.
The company’s stable occupancy rates, diversified portfolio, and prudent financial management provide a solid foundation for sustained performance. As STAG continues to capitalize on opportunities in the industrial real estate market, investors can look forward to potential growth in both property income and dividend returns.
Full presentation:
This article was generated with the support of AI and reviewed by an editor. For more information see our T&C.