Domo signs strategic collaboration agreement with AWS for AI solutions

Introduction & Market Context
STAG Industrial, Inc. (NYSE:STAG) released its second quarter 2025 supplemental information, revealing solid performance across key metrics and prompting management to raise full-year guidance. The industrial REIT, which specializes in single-tenant industrial properties, demonstrated continued momentum in its core business despite broader economic uncertainties.
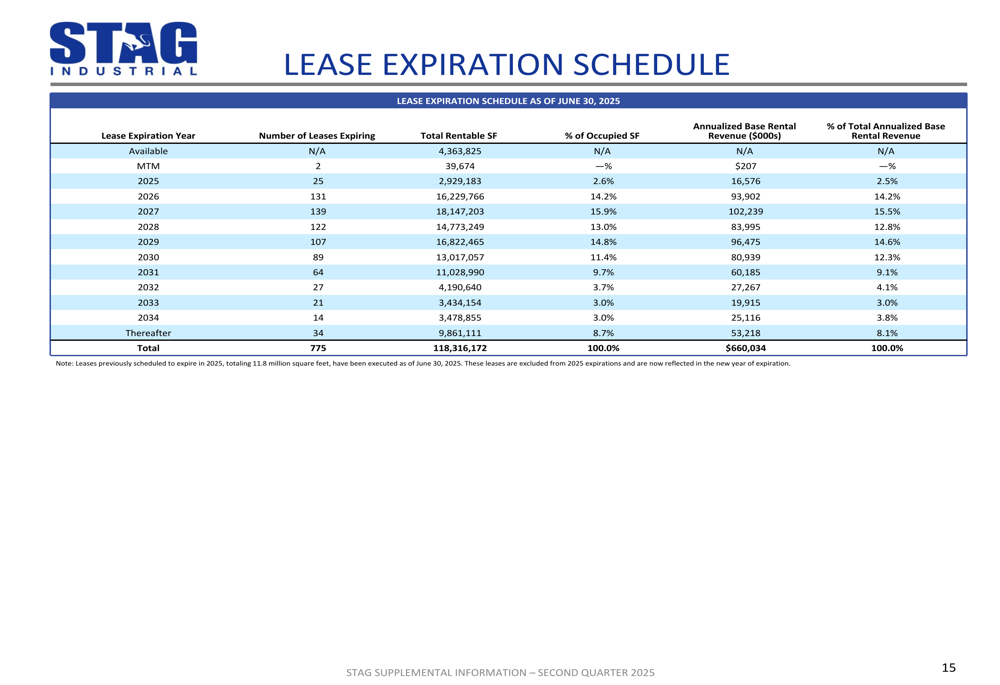
As of June 30, 2025, STAG’s portfolio consisted of 600 buildings across 41 states, totaling 118.3 million square feet. The company maintained strong occupancy levels with total portfolio occupancy at 96.3% and operating portfolio occupancy at 97.0%.
The stock closed at $34.76 on July 29, 2025, up 2.88% for the day, and has traded between $28.61 and $41.63 over the past 52 weeks. The company continues to offer an attractive dividend yield, with a monthly dividend that annualizes to $1.49 per share.
Quarterly Performance Highlights
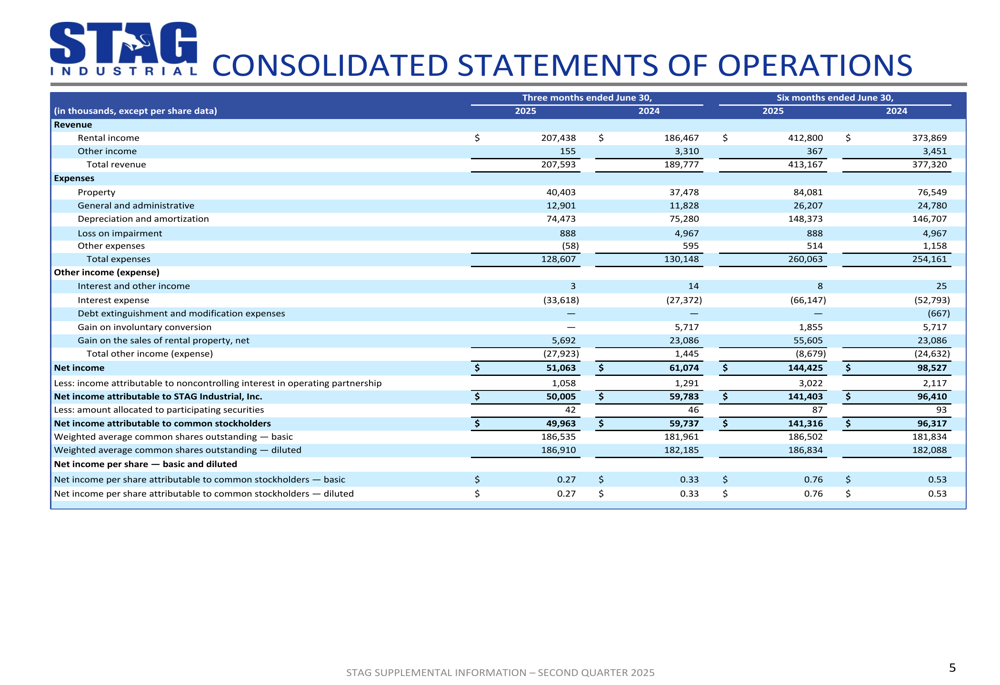
STAG Industrial reported rental income of $207.4 million for Q2 2025, representing an 11.2% increase from $186.5 million in the same period last year. This growth reflects both the company’s acquisition strategy and its ability to capture higher rents upon lease renewal.
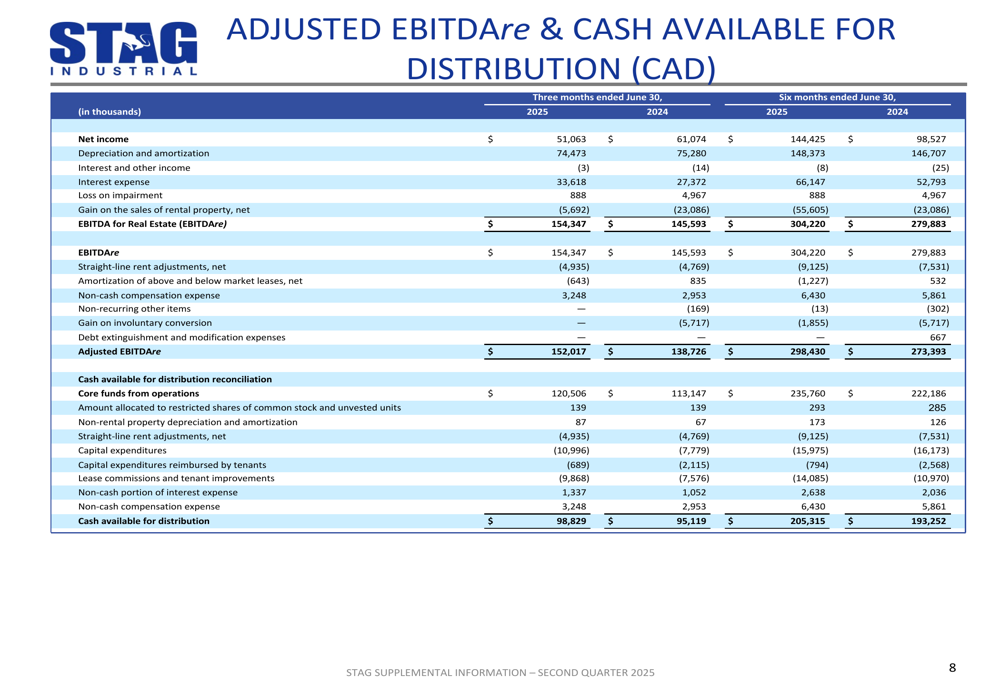
Core Funds from Operations (FFO), a key metric for REITs, reached $0.63 per diluted share for Q2 2025, up 5% from $0.60 in Q2 2024, demonstrating the company’s continued ability to generate increasing cash flow from its operations.
As shown in the following consolidated statements of operations, STAG’s net income attributable to common stockholders reached $65.6 million for Q2 2025:
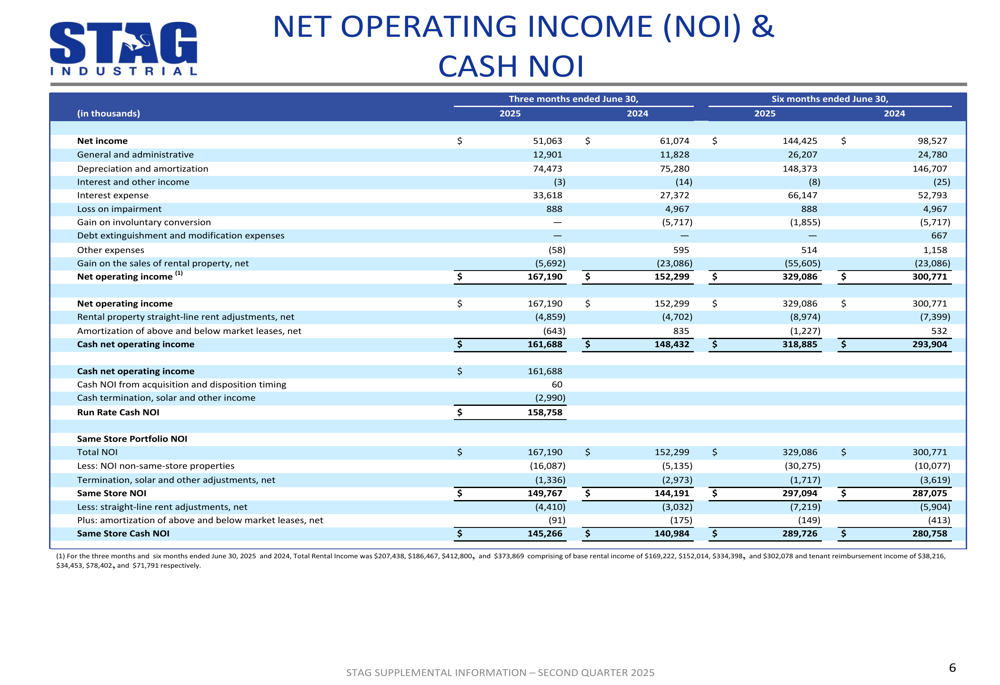
The company’s Same Store Cash Net Operating Income (NOI) increased by 3.7% year-over-year for the quarter, reflecting STAG’s ability to grow income from its existing property base. This organic growth was driven by strong leasing activity and rent increases.
Detailed Financial Analysis
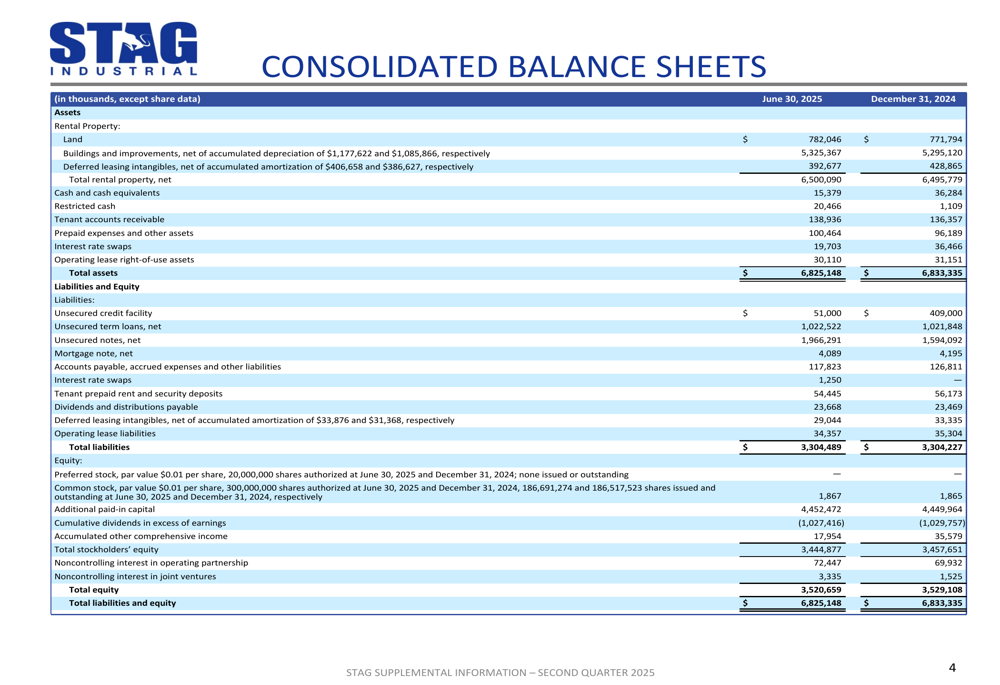
STAG’s balance sheet remains solid with a net debt to annualized run rate adjusted EBITDAre ratio of 5.1x, positioning the company well within its target leverage range. The company maintains investment grade credit ratings of BBB/Stable from Fitch and Baa2/Stable from Moody’s.
The following table details STAG’s net operating income and cash NOI calculations:
The company’s funds from operations and core FFO, critical metrics for evaluating REIT performance, show consistent growth:
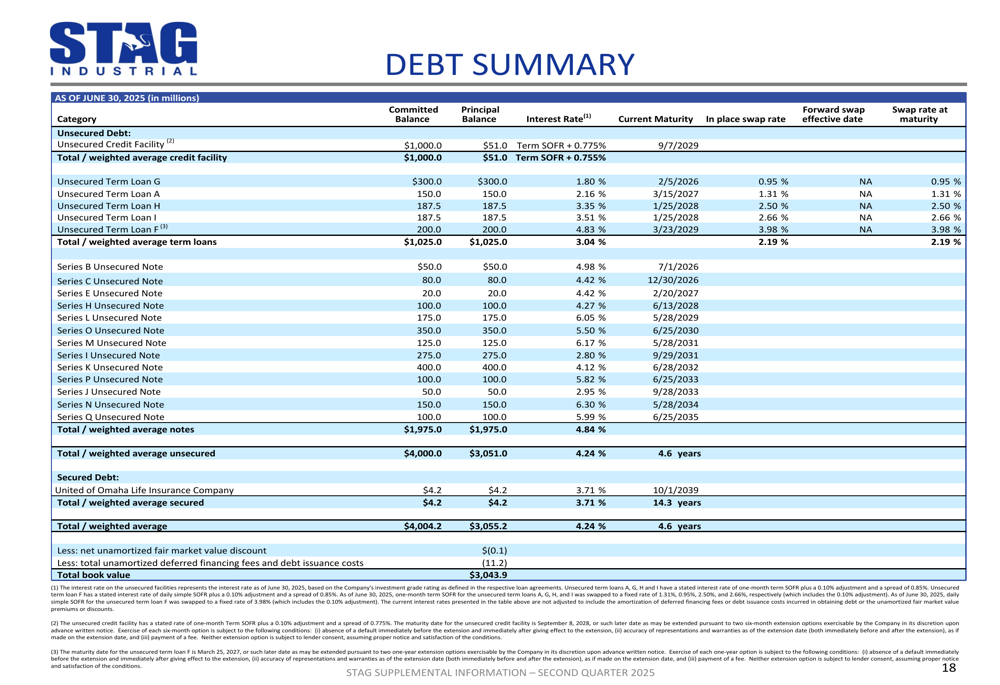
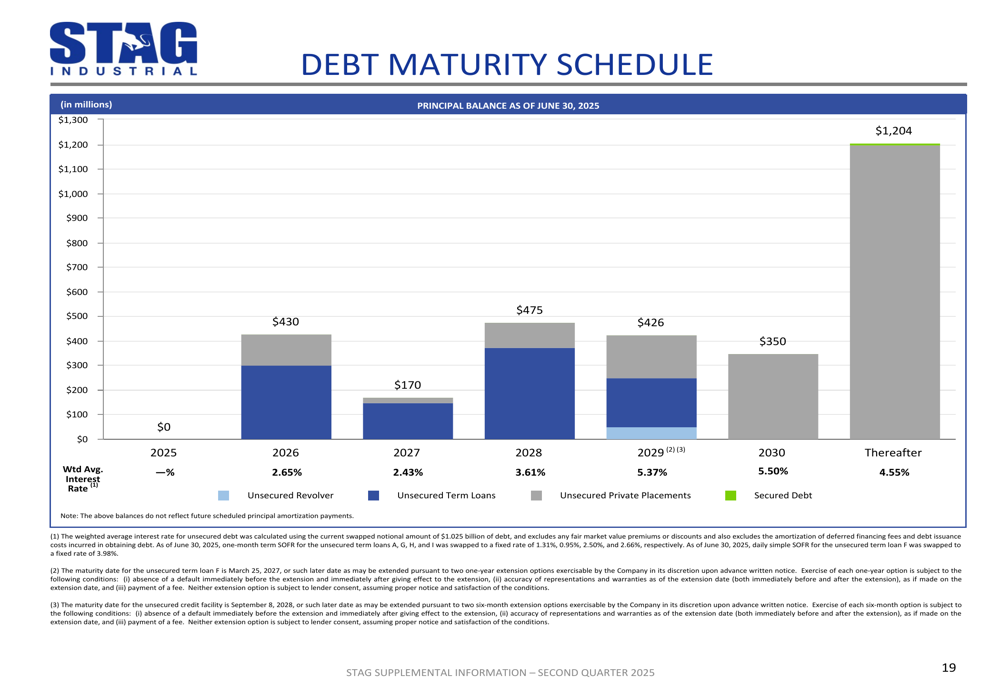
STAG’s liquidity position remains strong at $961.2 million, providing ample flexibility for future acquisitions and development activities. The company’s debt maturity schedule is well-laddered, with no significant maturities until 2026:
Strategic Initiatives
During Q2 2025, STAG acquired one property totaling 183,200 square feet for $18.4 million at a cash capitalization rate of 7.1%. Year-to-date, the company has acquired four properties totaling 576,764 square feet for $61.7 million at a weighted average cash capitalization rate of 6.9%.
The following table provides details on the company’s acquisition activity:
STAG’s development pipeline remains active with several projects under construction, substantially completed, or recently placed in service. These development initiatives represent an important component of the company’s growth strategy.
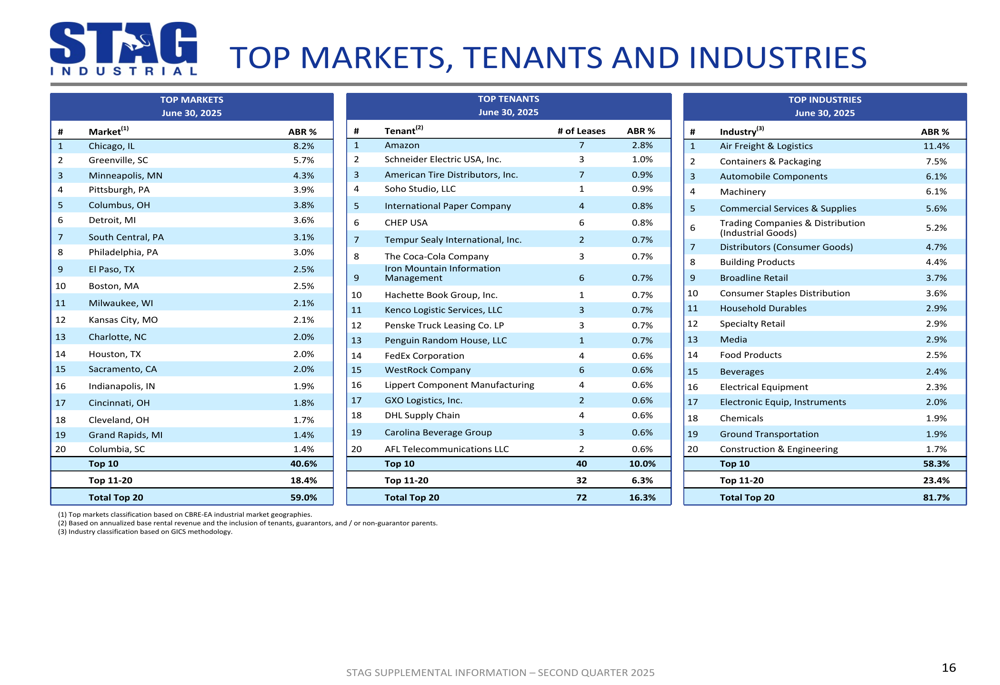
The company’s portfolio remains well-diversified across markets, tenants, and industries, reducing concentration risk and providing stability to cash flows. The top 10 tenants represent only 10% of annualized base rental revenue, with Amazon (NASDAQ:AMZN) as the largest tenant at 2.8%.
As illustrated in the following breakdown of top markets, tenants, and industries:
Forward-Looking Statements
Based on strong performance in the first half of 2025, STAG has raised its full-year guidance. The company now expects Core FFO per share to range from $2.48 to $2.52, up from the previous guidance of $2.46 to $2.50 provided after Q1 results.
Same Store Cash NOI growth guidance was also raised to 3.75%-4.00%, up from the previous range of 3.50%-4.00%, reflecting management’s confidence in continued strong operational performance.
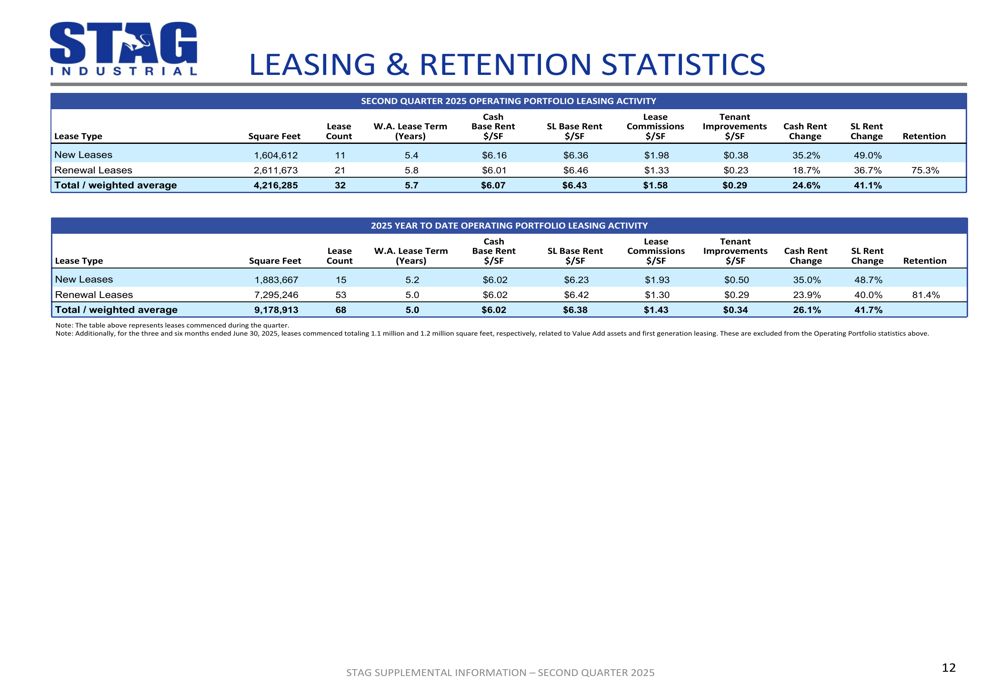
STAG’s leasing activity remains robust, with new leases signed at cash rent increases of 35.2% and renewal leases at 18.7% increases during Q2 2025. The company achieved a retention rate of 75.3% for the quarter and 81.4% year-to-date, demonstrating strong tenant satisfaction.
The company’s capital structure and debt metrics position it well for continued growth, with compliance across all debt covenants and significant available liquidity:
STAG Industrial’s Q2 2025 presentation demonstrates the company’s continued ability to execute its strategy effectively in the industrial real estate sector. With strong operational metrics, a solid balance sheet, and raised guidance, STAG appears well-positioned to continue delivering value to shareholders through the remainder of 2025.
Full presentation:
This article was generated with the support of AI and reviewed by an editor. For more information see our T&C.