Trump/Cook, Nissan weakness, more tariffs and gold - what’s moving markets

Introduction & Market Context
Steelcase Inc . (NYSE:SCS), a global leader in office furniture manufacturing, presented its FY2026 first quarter investor slides on June 26, 2025, following strong Q4 FY2025 results that exceeded analyst expectations. The company’s stock has shown positive momentum, surging 12.45% after its recent earnings announcement, with shares currently trading at $10.83.
The presentation comes at a time when workplace design is evolving rapidly, with organizations seeking solutions that enhance productivity, collaboration, and innovation. Steelcase’s strategic initiatives are aligned with these market trends, focusing on workplace transformation and expanding its reach across diverse customer segments.
Executive Summary
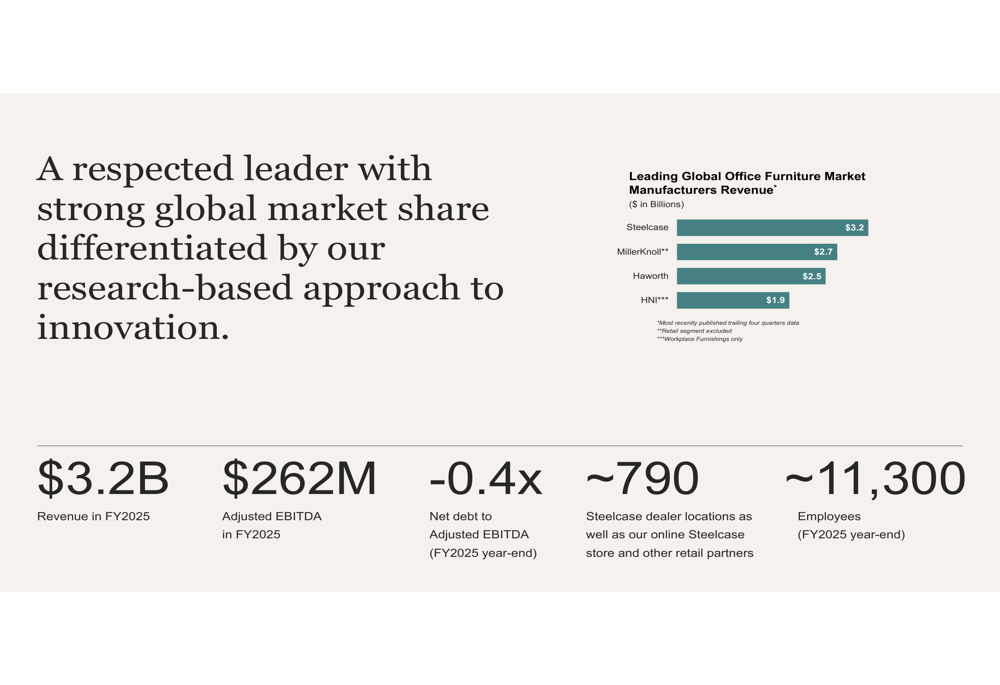
Steelcase reported $3.2 billion in revenue for FY2025 with $262 million in adjusted EBITDA. The company maintains a strong balance sheet with a negative net debt to adjusted EBITDA ratio of -0.4x, providing financial flexibility for strategic investments. With approximately 11,300 employees and 790 dealer locations globally, Steelcase maintains its position as the market leader in the office furniture industry.
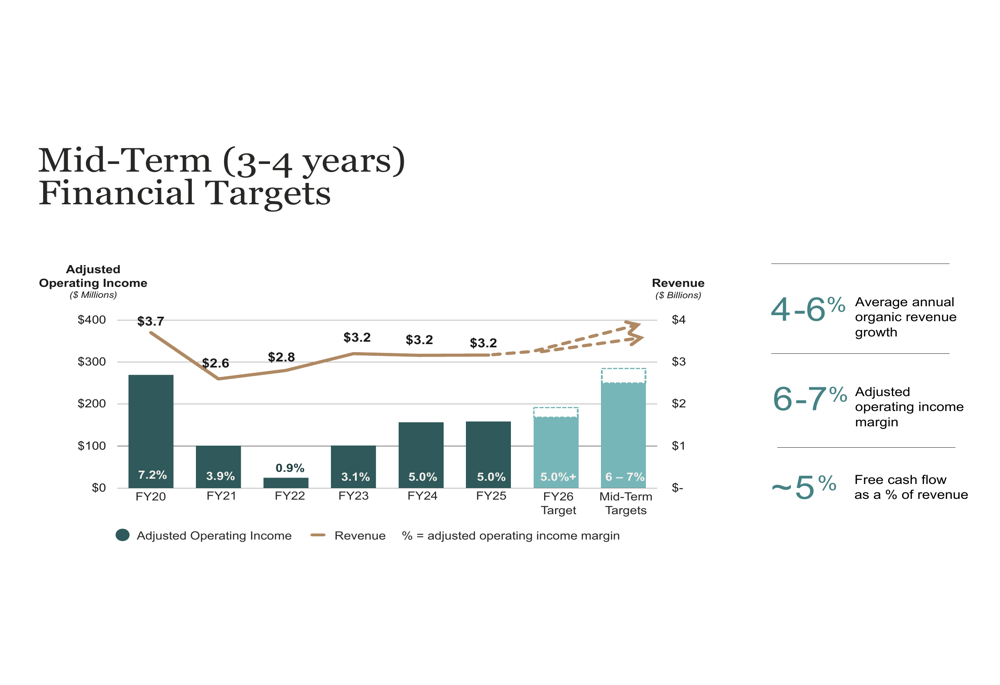
The company’s mid-term financial targets include 4-6% average annual organic revenue growth, 6-7% adjusted operating income margin, and approximately 5% free cash flow as a percentage of revenue. A key component of this strategy is achieving $50+ million in operational cost reductions from FY2023 levels.
As shown in the following chart of mid-term financial targets:
Financial Performance Highlights
Steelcase’s financial performance shows a notable divergence between its Americas and International segments. The Americas segment has demonstrated steady improvement, with revenue increasing from $2,436 million in FY2023 to $2,514 million in the trailing four quarters (TFQ). More impressively, the adjusted operating income margin in this region has grown from 4.4% to 7.3% over the same period.
In contrast, the International segment continues to face challenges, with revenue declining from $797 million in FY2023 to $703 million in the TFQ. This segment reported an adjusted operating loss margin of -2.2% in the TFQ, deteriorating from -0.8% in FY2023. The company has indicated that reaching breakeven in the International segment is a priority for FY2026.
The following slide illustrates Steelcase’s market leadership position relative to competitors:
Steelcase’s recent Q4 FY2025 earnings exceeded expectations, with adjusted EPS of $0.26 surpassing the forecast of $0.21. Revenue for the quarter reached $788 million, slightly above the projected $781.63 million. The company generated $100 million in free cash flow for the full year and returned $84 million to shareholders.
Strategic Initiatives
Steelcase’s strategic direction is focused on three key areas: leading the transformation of the workplace, expanding reach within markets, and strengthening profitability. The company is leveraging its research-driven approach to innovation, partnering with leading institutions such as MIT Media Labs, Microsoft (NASDAQ:MSFT), and various universities to develop solutions that address evolving workplace needs.
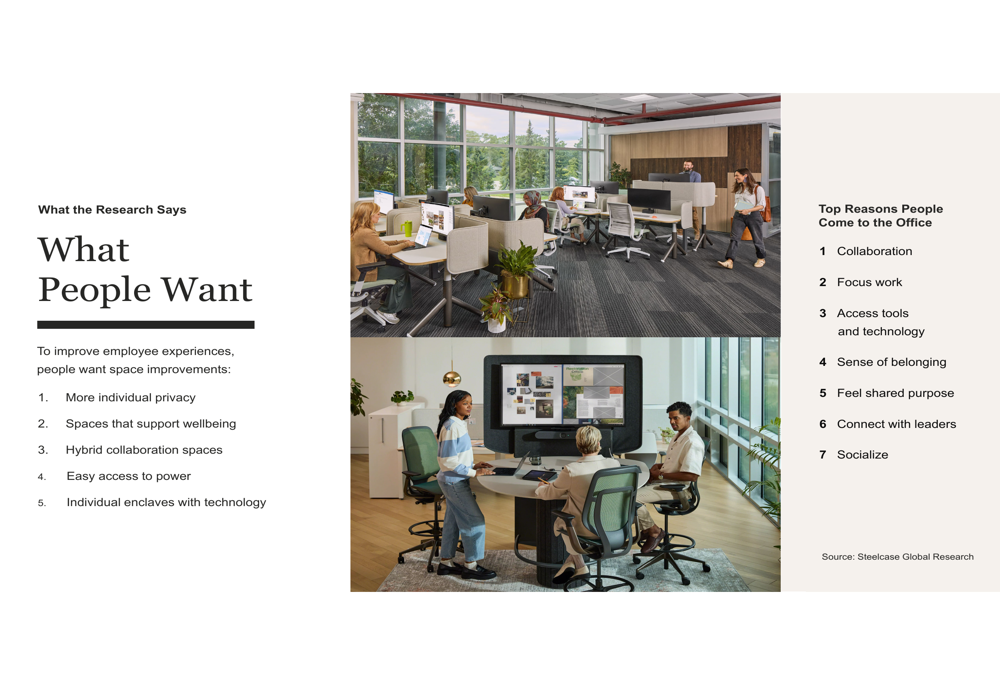
Research indicates that employees are seeking more individual privacy, spaces that support wellbeing, hybrid collaboration areas, easy access to power, and technology-enabled individual enclaves. The company’s product development strategy is aligned with these findings.
The following slide highlights what people want in the workplace, informing Steelcase’s strategic direction:
To expand its market reach, Steelcase is building on momentum in education with Steelcase Learning, increasing focus on small and midsize businesses, and amplifying its Steelcase Health business. This diversification strategy aims to reduce dependence on traditional corporate clients and tap into growing segments.
The company’s profitability improvement initiatives include capturing benefits from pricing actions, optimizing operations through lean and efficient platforms, driving value through business transformation, and reallocating investments toward strategic priorities. The targeted $50+ million in operational cost reductions from FY2023 levels is a central component of this strategy.
Competitive Positioning
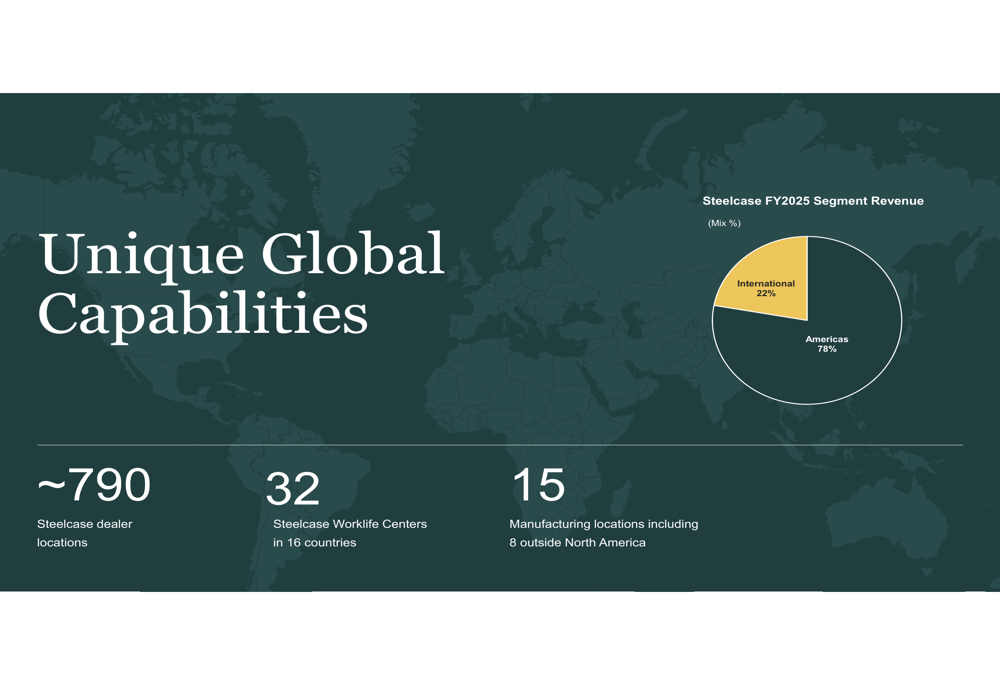
With $3.2 billion in revenue, Steelcase maintains its position as the leading global office furniture manufacturer, ahead of competitors MillerKnoll (NASDAQ:MLKN) ($2.7 billion), Haworth ($2.5 billion), and HNI (NYSE:HNI) ($1.9 billion). The company’s global footprint includes approximately 790 dealer locations and 32 Steelcase Worklife Centers across 16 countries, supported by 15 manufacturing locations, 8 of which are outside North America.
The company’s revenue mix by segment shows the Americas accounting for 78% of total revenue, with International contributing 22%. This geographic distribution highlights both the company’s strength in North America and the potential for growth in international markets once profitability issues are addressed.
The following slide illustrates Steelcase’s global capabilities:
Sustainability Initiatives
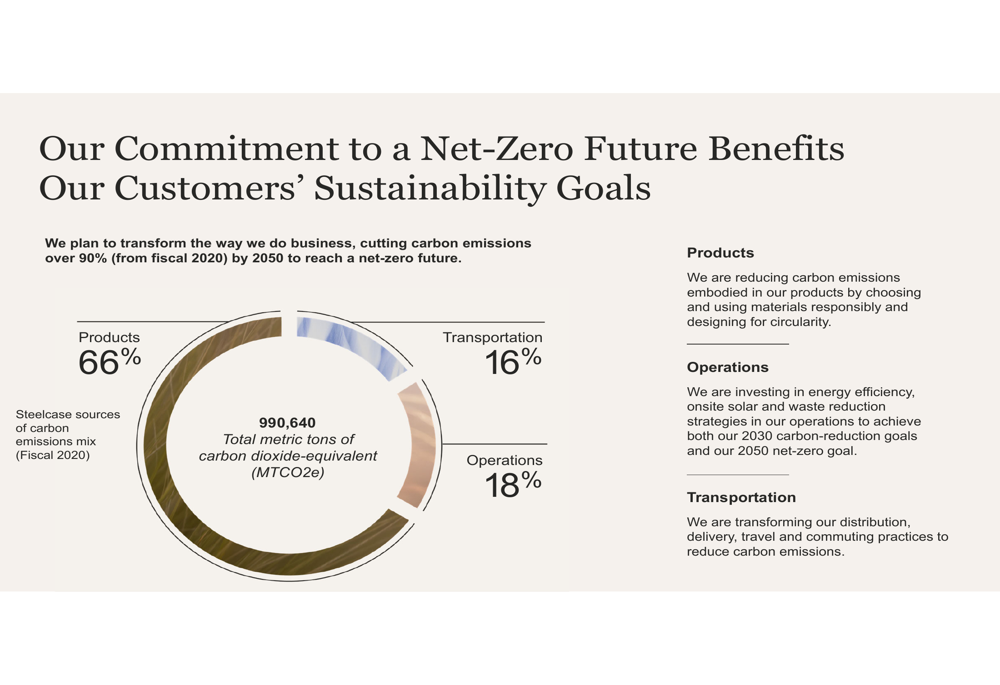
Steelcase has made a significant commitment to sustainability, targeting a net-zero future by 2050 with plans to cut carbon emissions by over 90% from fiscal 2020 levels. The company’s analysis shows that 66% of its carbon footprint comes from products, 18% from operations, and 16% from transportation.
Specific initiatives include designing for circularity, using materials responsibly, and implementing renewable energy solutions. These efforts align with growing customer demand for environmentally responsible products and practices.
The following slide details Steelcase’s commitment to a net-zero future:
Forward-Looking Statements
Looking ahead, Steelcase is targeting mid-single-digit organic revenue growth and modest improvement in adjusted operating margins. The company expects its International segment to reach breakeven in fiscal 2026, with capital expenditures projected at $70-80 million.
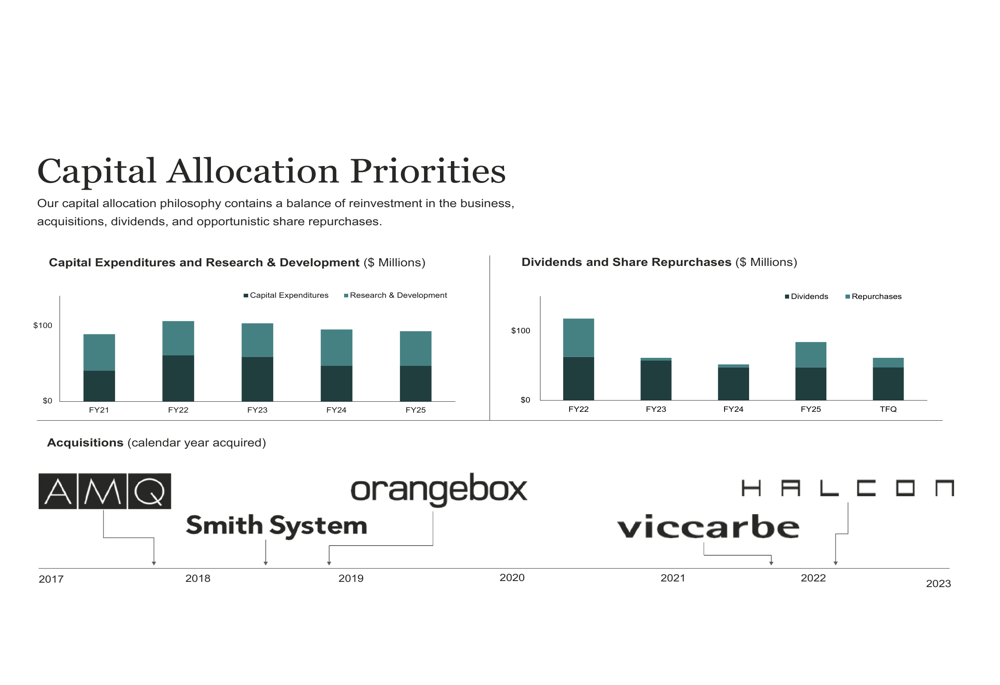
The company’s capital allocation priorities balance reinvestment in the business, strategic acquisitions, dividends, and opportunistic share repurchases. Recent acquisitions include AMQ (2017), Smith System (2018), Orangebox (2019), Viccarbe (2021), and HALCON (2022), demonstrating Steelcase’s commitment to strategic growth.
The following slide outlines Steelcase’s capital allocation priorities:
Steelcase faces several challenges, including tariff uncertainties, potential supply chain disruptions, market saturation, macroeconomic pressures, and geopolitical tensions. However, the company’s strong balance sheet and strategic focus on workplace transformation position it well to navigate these challenges while pursuing its mid-term financial targets.
Full presentation:
This article was generated with the support of AI and reviewed by an editor. For more information see our T&C.