US stock futures dip as Nvidia earnings spark little cheer

Introduction & Market Context
The Hanover Insurance Group, Inc. (NYSE:THG) reported strong first-quarter 2025 results on May 1, 2025, with operating income per diluted share increasing 26% year-over-year to $3.87, compared to $3.08 in the same period last year. The company’s combined ratio improved to 94.1%, down from 95.5% in the first quarter of 2024, reflecting enhanced underwriting performance across its business segments.
The insurer’s results demonstrate continued momentum from its solid performance in the third quarter of 2024, when it reported an operating income of $3.50 per diluted share. The company’s strategic initiatives, including pricing enhancements and targeted underwriting, appear to be yielding positive results as it navigates a challenging insurance market environment.
Quarterly Performance Highlights
The Hanover reported net income of $128.2 million, or $3.50 per diluted share, for the first quarter of 2025, compared to $115.5 million, or $3.18 per diluted share, in the same period of 2024. Operating income after income taxes increased to $141.8 million from $111.9 million in the prior-year quarter.
As shown in the following comprehensive overview of the company’s first quarter results:
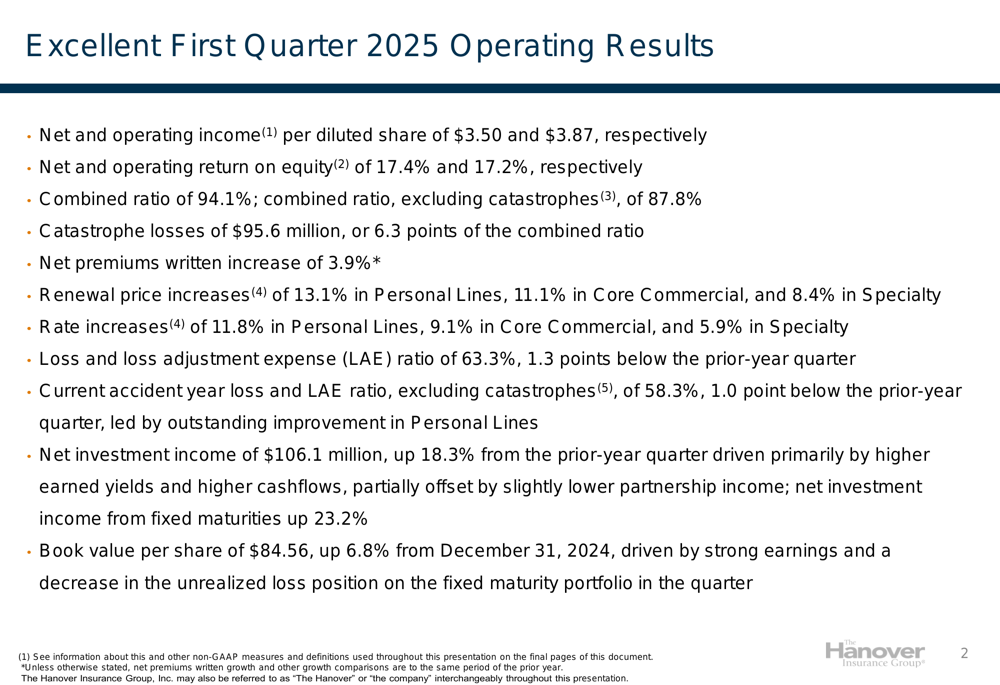
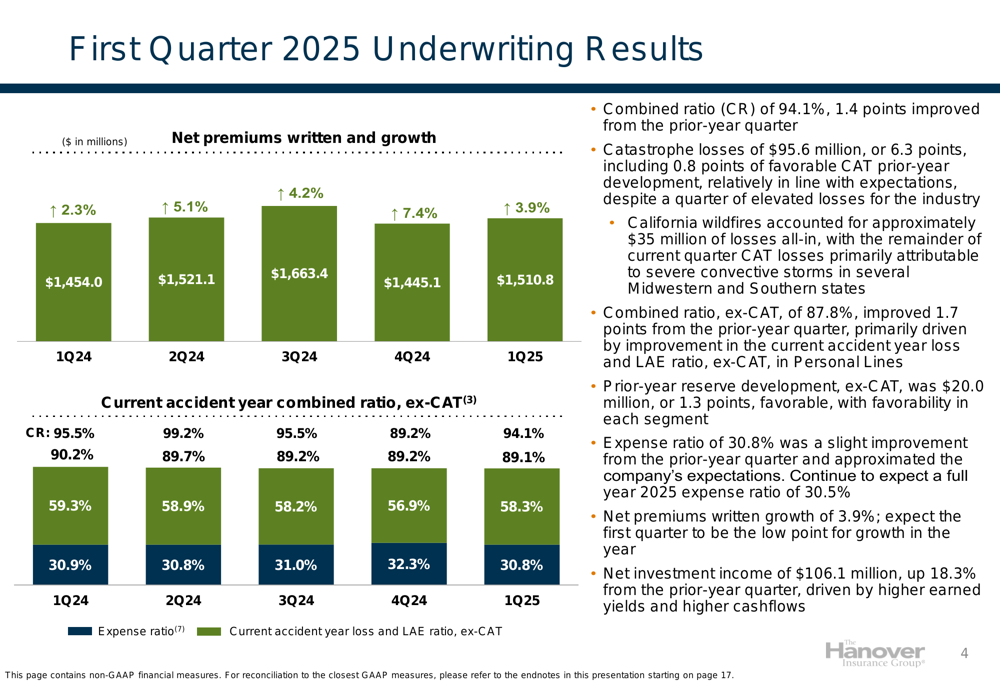
Net premiums written grew by 3.9% to $1.51 billion, while the company maintained strong pricing across all segments with renewal price increases of 13.1% in Personal Lines, 11.1% in Core Commercial, and 8.4% in Specialty. The combined ratio, excluding catastrophes, improved to 87.8% from 89.5% in the prior-year quarter, primarily driven by a 1.0 point improvement in the current accident year loss and LAE ratio, excluding catastrophes.
Catastrophe losses for the quarter totaled $95.6 million, or 6.3 points of the combined ratio, including California wildfires that accounted for approximately $35 million of losses. Despite these events, the company’s overall catastrophe losses were relatively in line with expectations.
The following chart illustrates the company’s net premium growth and combined ratio trends over the past five quarters:
Segment Analysis
Personal Lines
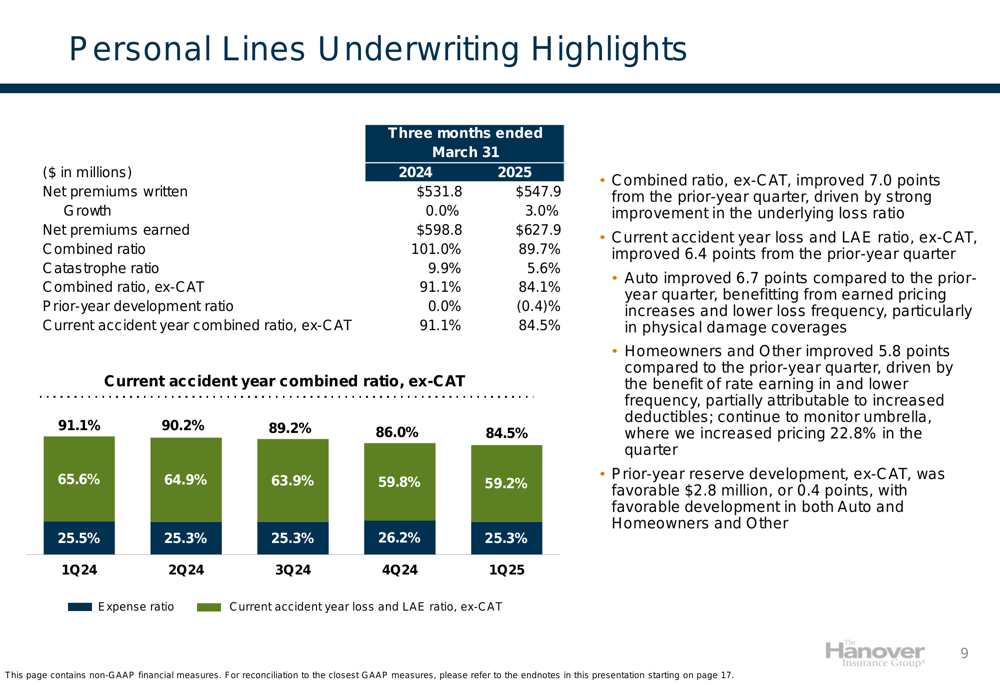
Personal Lines emerged as the standout performer in the first quarter, with its combined ratio, excluding catastrophes, improving by 7.0 points to 84.1% compared to 91.1% in the prior-year quarter. This improvement was primarily driven by a 6.4-point reduction in the current accident year loss and LAE ratio, excluding catastrophes.
The auto insurance line showed particularly strong improvement, with the loss ratio improving 6.7 points compared to the prior-year quarter, benefitting from earned pricing increases and lower loss frequency, particularly in physical damage coverages. Similarly, the homeowners line improved 5.8 points, driven by rate increases and lower frequency, partially attributable to increased deductibles.
The following chart details Personal Lines underwriting performance:
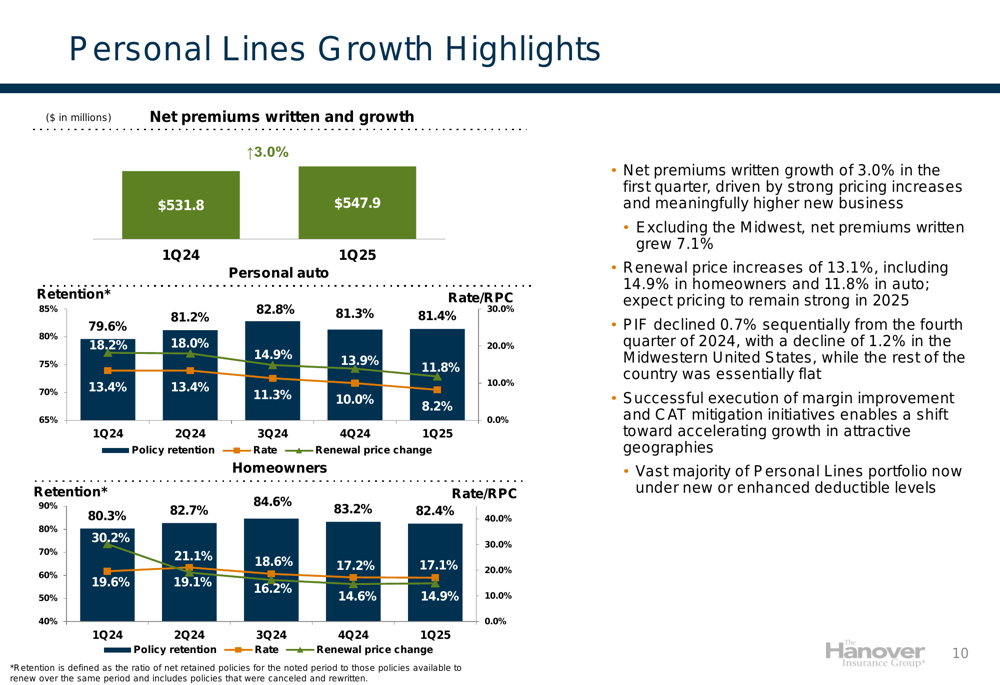
Personal Lines net premiums written increased by 3.0% in the first quarter, driven by strong pricing increases and higher new business. Excluding the Midwest region, net premiums written grew by 7.1%, indicating strong performance in other geographies. The company maintained robust renewal price increases of 13.1%, including 14.9% in homeowners and 11.8% in auto.
The following chart shows Personal Lines retention and pricing trends:
Core Commercial
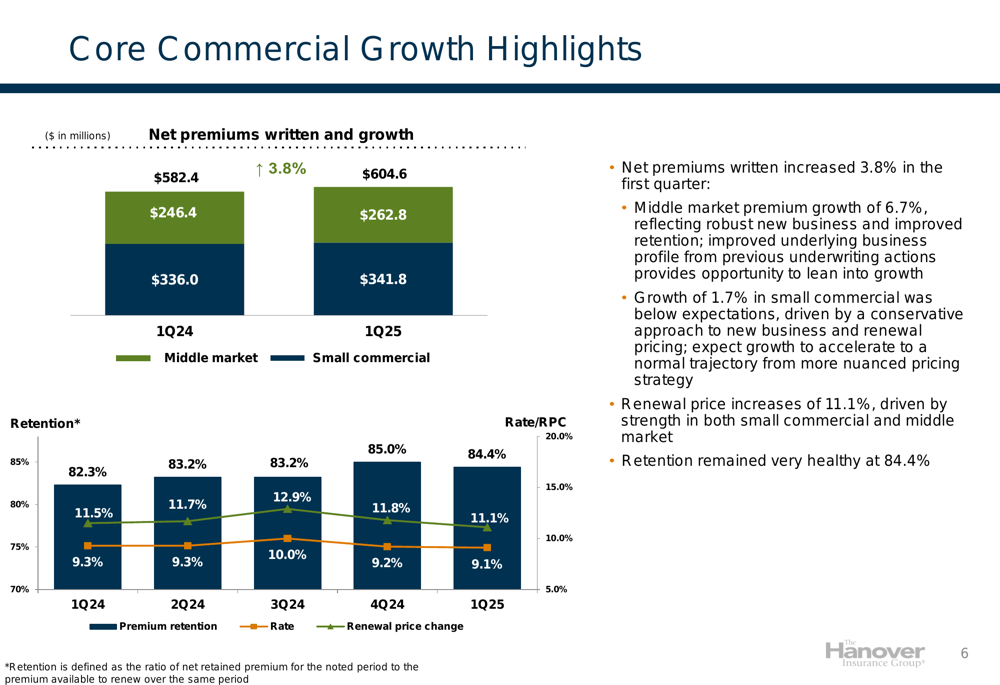
Core Commercial reported a 3.8% increase in net premiums written to $604.6 million, with middle market premium growth of 6.7% reflecting robust new business and improved retention. However, the segment’s combined ratio, excluding catastrophes, increased by 4.9 points to 94.9% from 90.0% in the prior-year quarter, primarily due to elevated property large losses.
The following chart illustrates Core Commercial underwriting performance:
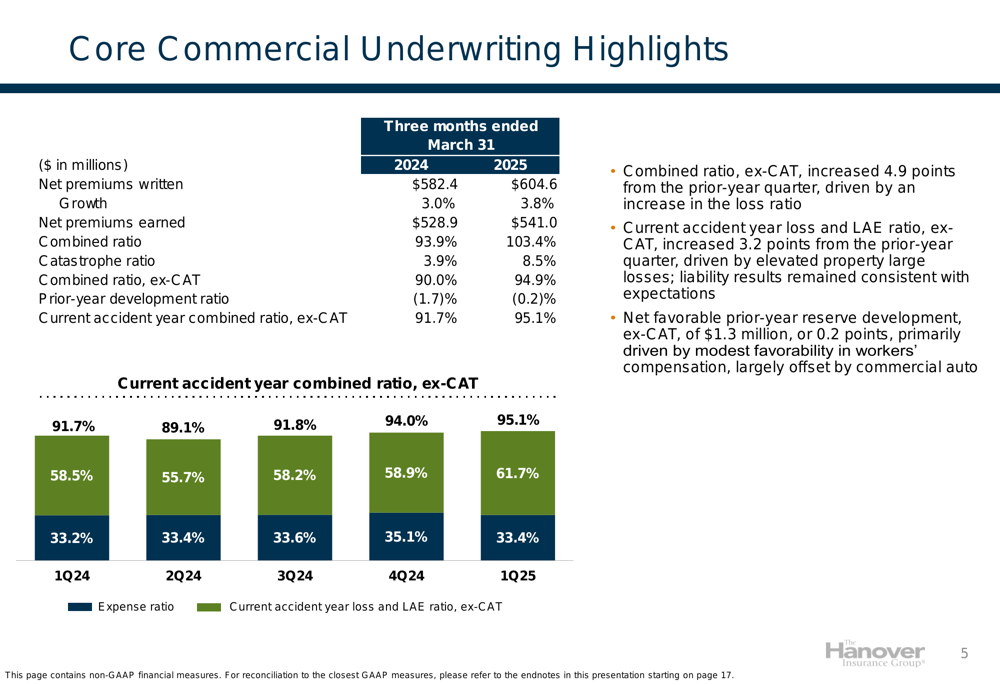
Despite the increase in the loss ratio, Core Commercial maintained strong renewal price increases of 11.1% and healthy retention at 84.4%. The company expects growth in small commercial to accelerate from a more nuanced pricing strategy after a conservative approach to new business and renewal pricing in the first quarter.
The following chart shows Core Commercial growth metrics:
Specialty
The Specialty segment delivered a 5.4% increase in net premiums written to $358.3 million, with the combined ratio, excluding catastrophes, improving by 2.0 points to 83.4% compared to 85.4% in the prior-year quarter. This improvement was driven by higher favorable prior-year reserve development of $15.9 million, or 4.7 points.
The following chart details Specialty underwriting performance:
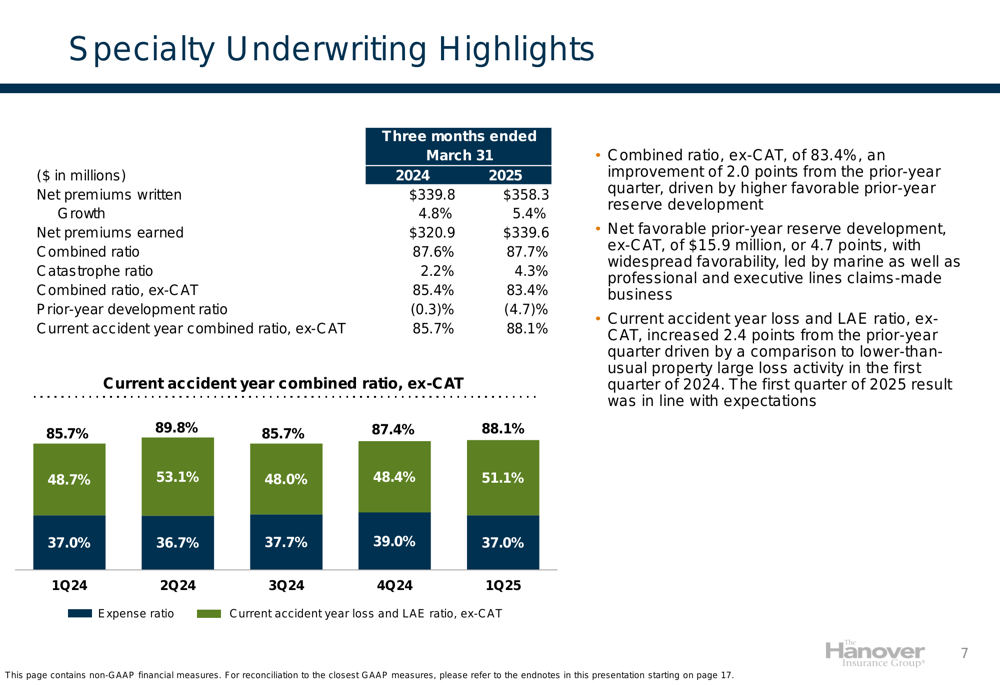
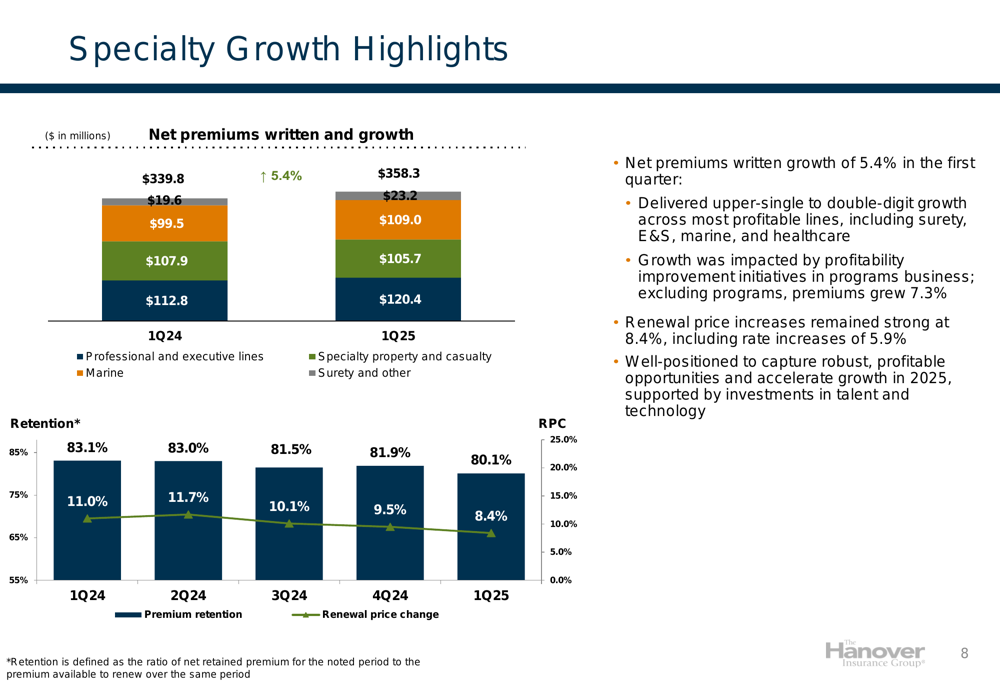
The segment achieved upper-single to double-digit growth across most profitable lines, including surety, E&S, marine, and healthcare. Excluding programs business, which was impacted by profitability improvement initiatives, premiums grew by 7.3%. Renewal price increases remained strong at 8.4%, including rate increases of 5.9%.
The following chart illustrates Specialty growth metrics:
Investment Performance
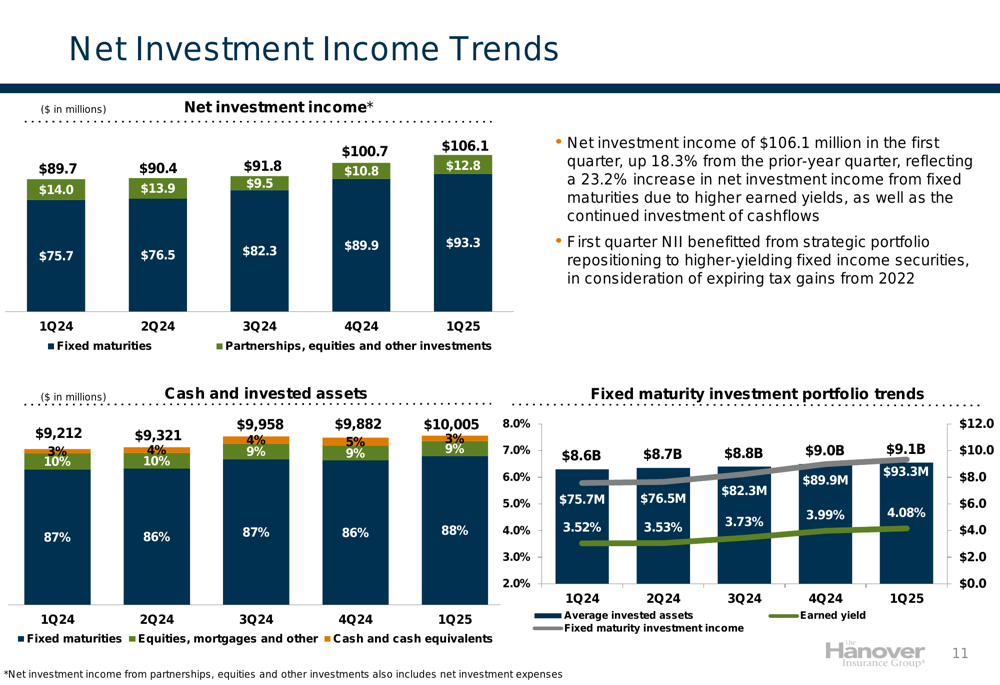
The Hanover reported net investment income of $106.1 million in the first quarter, up 18.3% from the prior-year quarter. This increase was primarily driven by a 23.2% rise in net investment income from fixed maturities due to higher earned yields and continued investment of cashflows.
The company’s investment portfolio benefited from strategic repositioning to higher-yielding fixed income securities, with the earned yield on fixed maturities increasing to 4.08% in the first quarter of 2025 from 3.52% in the same period of 2024.
The following chart shows the company’s net investment income trends:
Forward-Looking Statements
The Hanover appears well-positioned for continued growth and profitability in 2025, building on the momentum from its strong first-quarter performance. The company expects the first quarter to be the low point for premium growth in the year, with acceleration anticipated in subsequent quarters.
In Personal Lines, the successful execution of margin improvement and catastrophe mitigation initiatives enables a shift toward accelerating growth in attractive geographies. The vast majority of the Personal Lines portfolio is now under new or enhanced deductible levels, which should provide better protection against severe weather events.
For Specialty, the company is well-positioned to capture robust, profitable opportunities and accelerate growth in 2025, supported by investments in talent and technology. In Core Commercial, the improved underlying business profile from previous underwriting actions provides an opportunity to lean into growth, particularly in the middle market segment.
The company continues to expect a full-year 2025 expense ratio of 30.5%, consistent with the guidance provided in its third-quarter 2024 earnings call. With book value per share increasing 6.8% from December 31, 2024, to $84.56, and a debt-to-total capital ratio improving to 20.5% from 23.7% in the prior-year quarter, The Hanover maintains a strong capital position to support its growth initiatives.
The Hanover Insurance Group’s stock closed at $165.99 on April 30, 2025, near the upper end of its 52-week range of $119.66 to $176.16, reflecting investor confidence in the company’s performance and outlook.
This article was generated with the support of AI and reviewed by an editor. For more information see our T&C.