Microsoft sued by Australia competition regulator over Copilot, 365 pricing

Introduction & Market Context
Stratasys Ltd (NASDAQ:SSYS) presented its Q2 2025 results on August 13, 2025, highlighting improved profitability metrics despite relatively flat revenue compared to the same period last year. The 3D printing company’s stock dropped 10.73% in premarket trading to $10.15, suggesting investors may have expected stronger results or were concerned about the reduced full-year guidance.
The presentation, delivered by CEO Dr. Yoav Zeif and CFO Eitan Zamir, emphasized the company’s focus on high-value applications and strategic partnerships as it navigates a challenging market environment where capital expenditure constraints continue to impact the industry.
Quarterly Performance Highlights
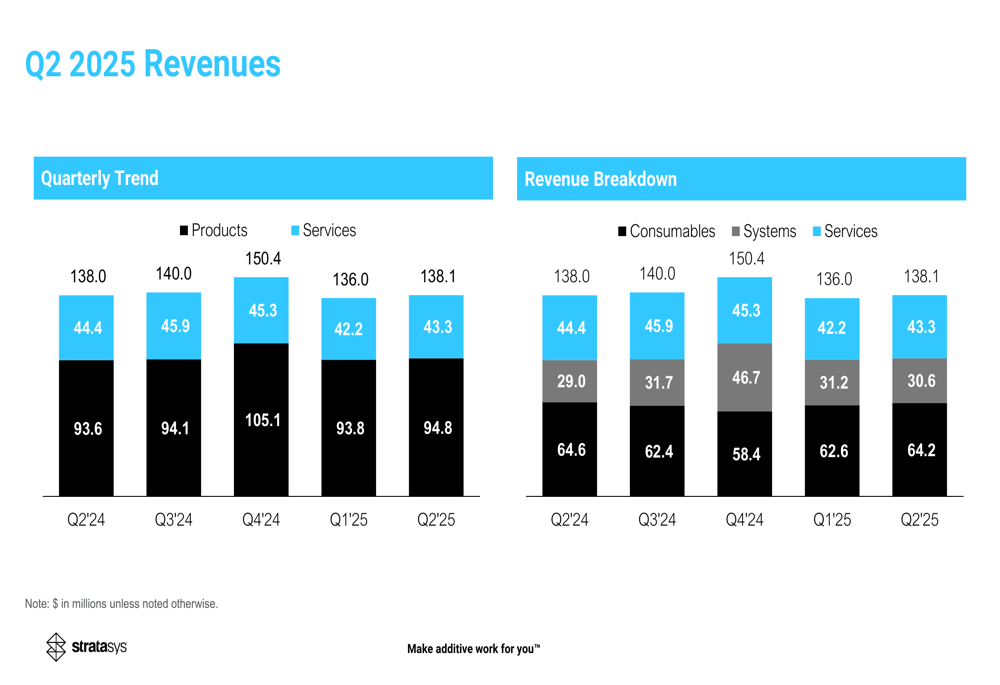
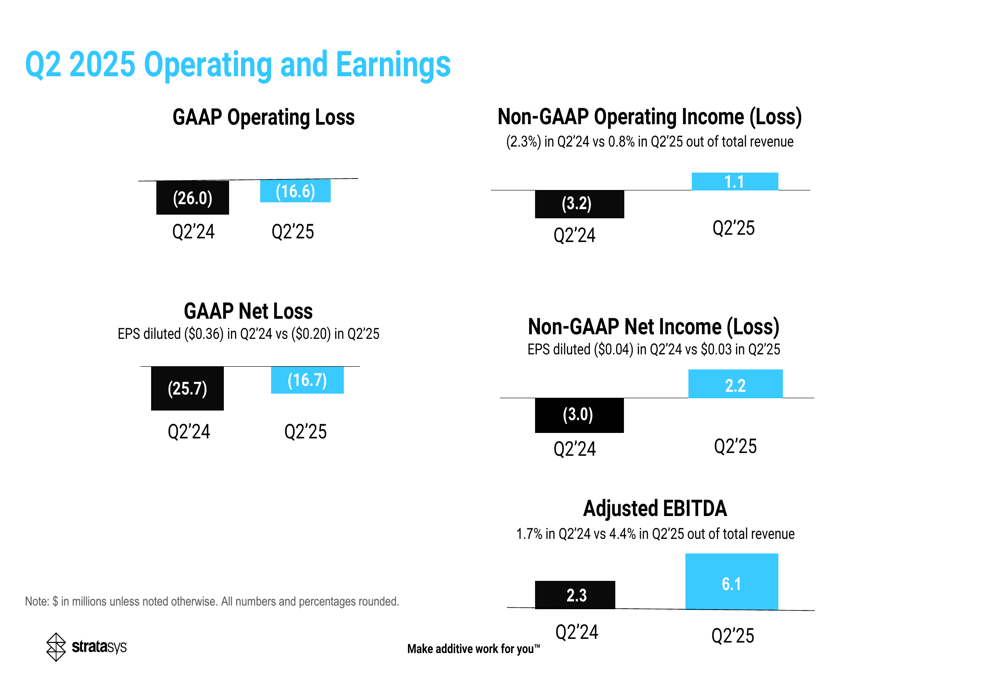
Stratasys reported Q2 2025 revenue of $138.1 million, essentially flat compared to Q2 2024, but showing a slight sequential improvement from the $136 million reported in Q1 2025. The company achieved positive non-GAAP operating income of $1.1 million, a significant improvement from the $3.2 million loss in the same period last year.
As shown in the following chart of quarterly revenue trends, the company’s revenue has remained relatively stable across recent quarters:
Non-GAAP net income reached $2.2 million in Q2 2025, compared to a $3.0 million loss in Q2 2024, while adjusted EBITDA increased to $6.1 million from $2.3 million year-over-year. These improvements reflect the company’s successful cost control initiatives and focus on operational efficiency.
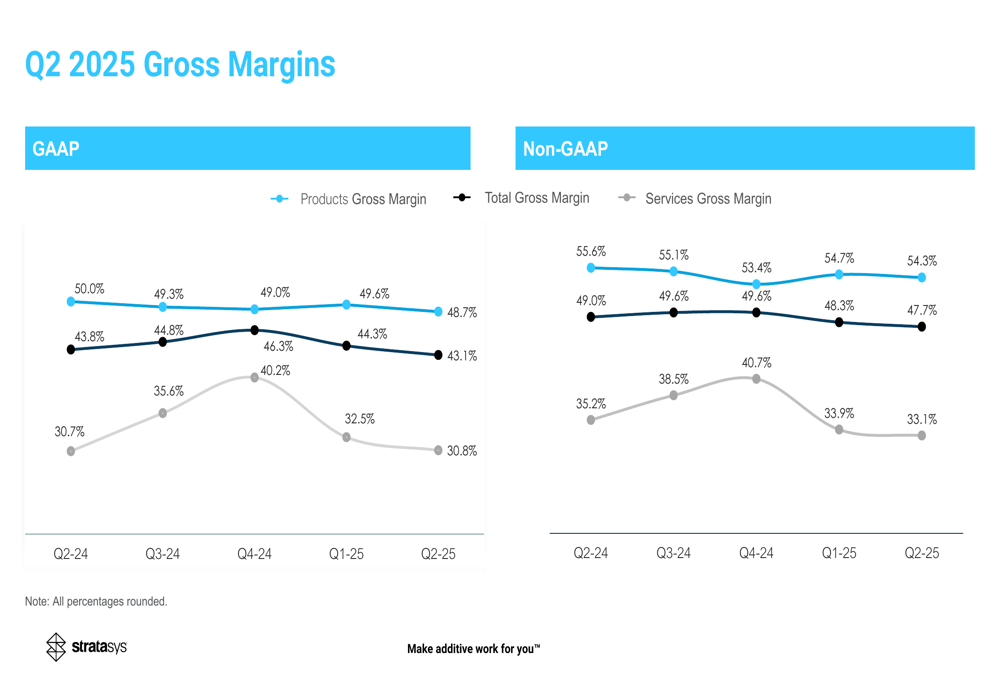
The company’s gross margins remained relatively stable, as illustrated in this chart:
Detailed Financial Analysis
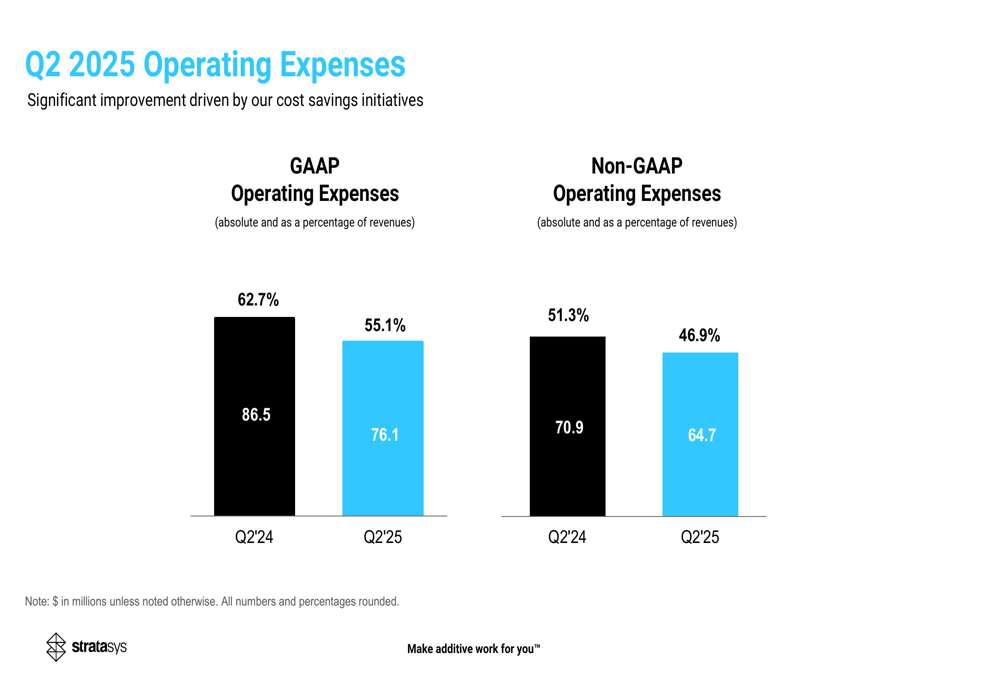
A key driver of Stratasys’ improved profitability was the reduction in operating expenses. The company reported GAAP operating expenses of $76.1 million (55.1% of revenue) in Q2 2025, down from $86.5 million (62.7% of revenue) in Q2 2024. Non-GAAP operating expenses also decreased to $64.7 million (46.9% of revenue) from $70.9 million (51.3% of revenue) year-over-year.
The following chart illustrates this significant reduction in operating expenses:
These cost reductions, combined with stable gross margins, led to improved operating and earnings metrics across the board:
Stratasys significantly strengthened its balance sheet, with cash and cash equivalents increasing to $254.6 million in Q2 2025 from $150.9 million in Q2 2024. The company also reduced its inventories from $196.5 million to $164.6 million over the same period, reflecting improved inventory management.
Strategic Initiatives
During the quarter, Stratasys launched a new US Tooling Center in Michigan, designed to help manufacturers validate and scale additive manufacturing applications. The center aims to demonstrate 3D printing technologies alongside conventional manufacturing processes and address the growing need for localized, on-demand production.
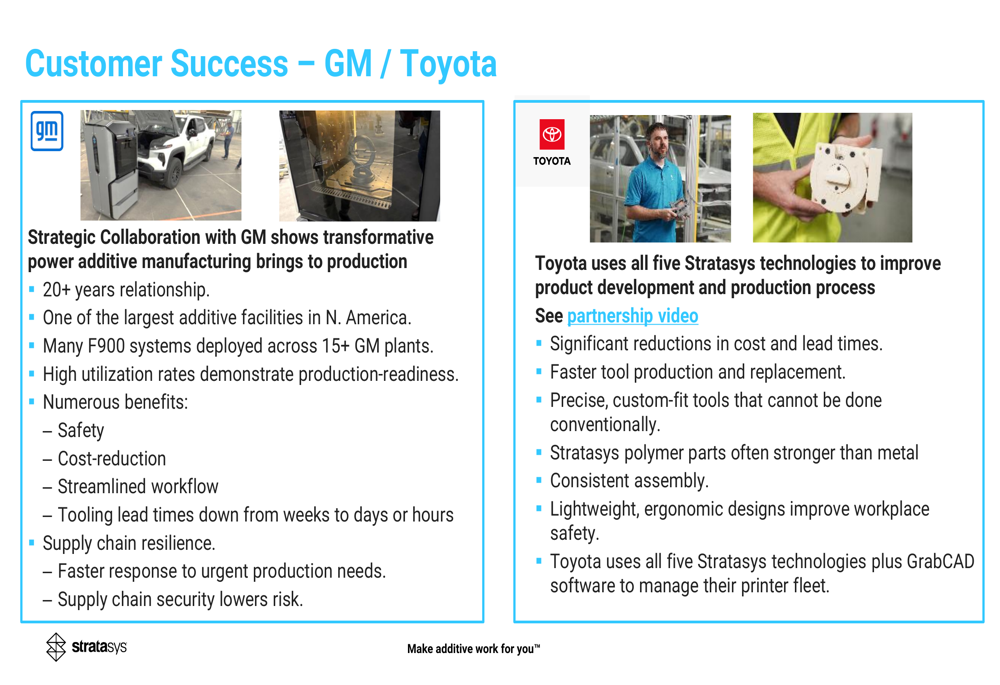
The company highlighted key customer relationships, including a 20+ year partnership with General Motors, which has deployed F900 systems across more than 15 plants with high utilization rates. Toyota was also featured as a success story, using all five Stratasys technologies and achieving significant cost and lead time reductions.
The following slide details these important customer relationships:
In the aerospace sector, Stratasys secured multiple Neo800 SL system purchases from Blue Origin, which is participating in NASA’s Artemis program. The medical sector also saw progress with the company’s J5 DAP anatomical model solutions, representing a $1.8 billion addressable opportunity.
The company continued to expand its materials and software ecosystem, launching P3 Silicone 25A high-performance material in partnership with Shin-Etsu and integrating trinckle 3D GmbH’s fixturemate into GrabCAD PrintPro through an exclusive agreement.
Forward-Looking Statements
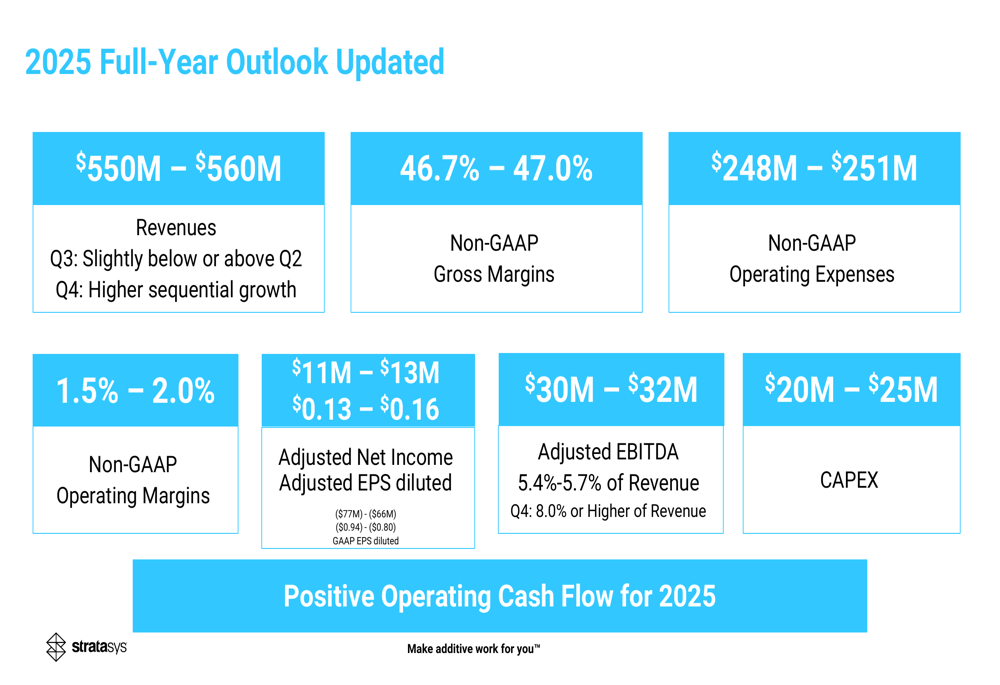
Stratasys updated its full-year 2025 outlook, projecting revenue between $550 million and $560 million, which appears to be a reduction from the $570-585 million guidance mentioned in the Q1 2025 earnings report. The company expects gross margins of 46.7%-47.0%, operating margins of 1.5%-2.0%, and adjusted EBITDA of $30-32 million.
The detailed outlook is presented in the following slide:
CEO Dr. Yoav Zeif emphasized the company’s differentiated approach and focus on high-value applications as key to long-term success. He highlighted the stability provided by recurring revenue streams and the company’s comprehensive portfolio as competitive advantages in the market.
Despite the reduced revenue guidance, Stratasys’ improved profitability metrics and strong balance sheet position the company to weather ongoing market challenges while continuing to invest in strategic growth initiatives. However, the negative premarket reaction suggests investors may be concerned about the pace of revenue growth and the lowered full-year outlook.
Full presentation:
This article was generated with the support of AI and reviewed by an editor. For more information see our T&C.