Cigna earnings beat by $0.04, revenue topped estimates

Introduction & Market Context
Strategic Education Inc. (NASDAQ:STRA) presented its Q2 2025 investor results on July 30, 2025, revealing a mixed performance characterized by strong growth in its Education Technology Services segment offsetting challenges in its higher education businesses. The company’s stock showed minimal movement in premarket trading, up just 0.06% to $79.50, following its previous close of $79.45.
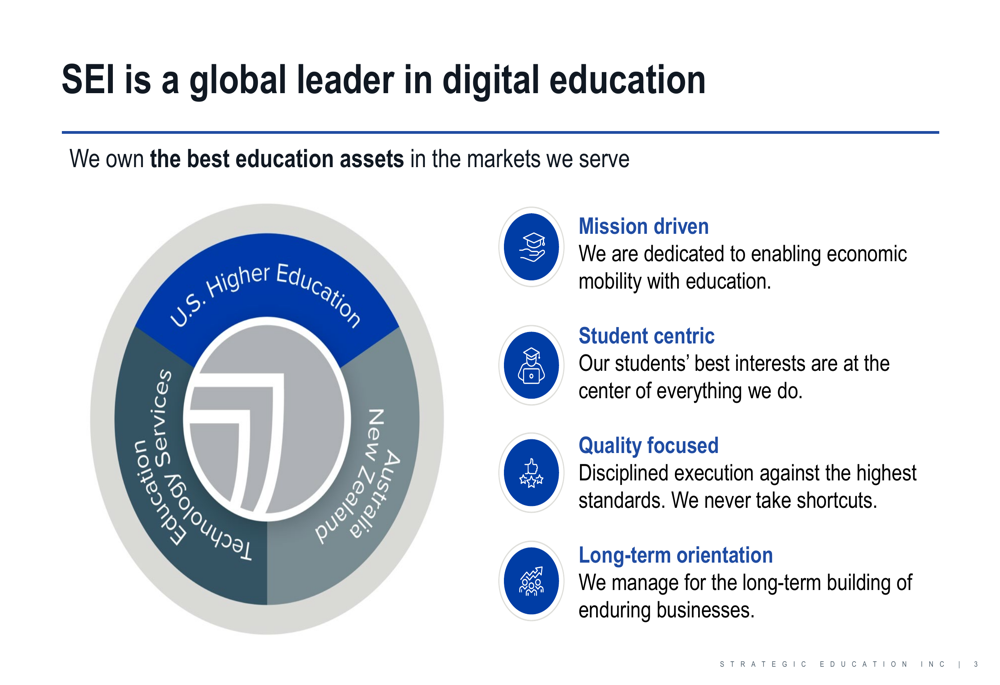
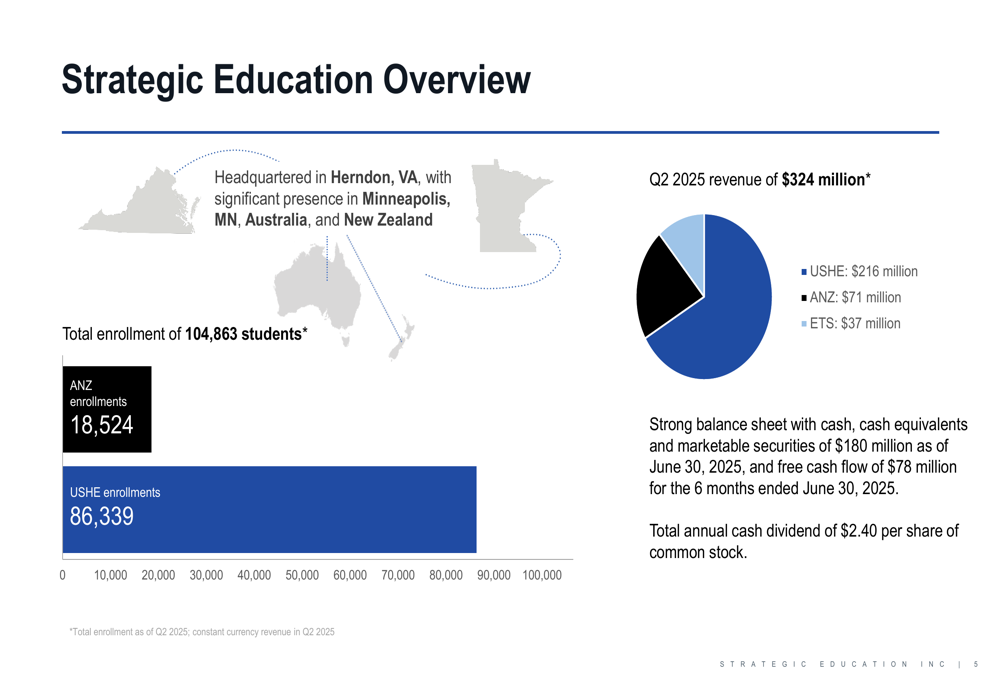
The education provider, which operates across the United States, Australia, and New Zealand, continues to position itself as a "global leader in digital education" with a diverse portfolio spanning traditional higher education institutions, skills-based learning programs, and education technology services.
As shown in the following slide highlighting the company’s global presence and core values:
Quarterly Performance Highlights
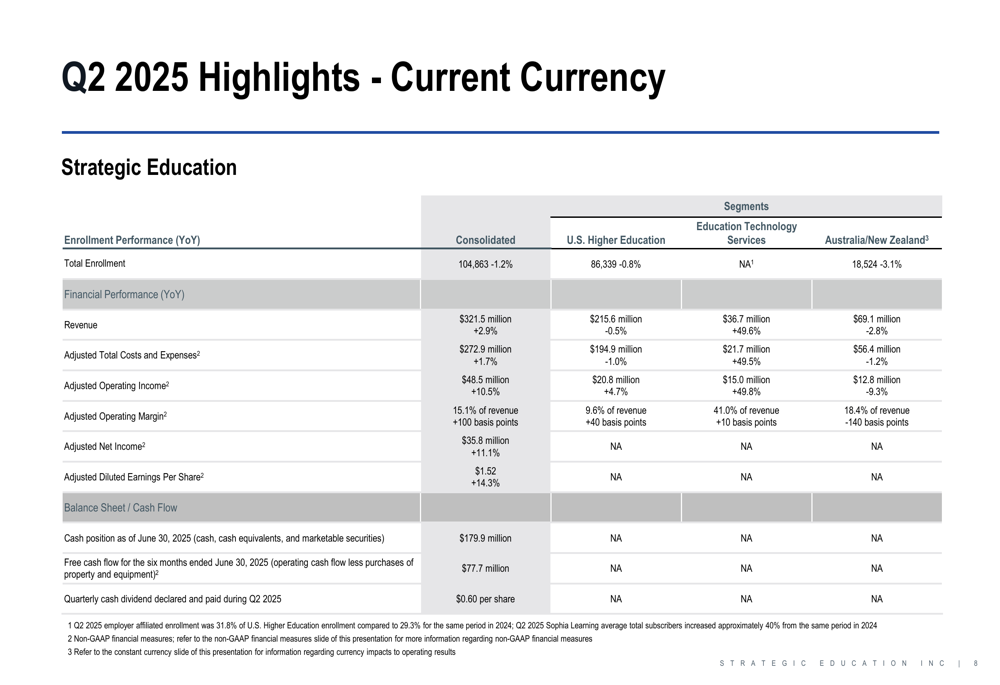
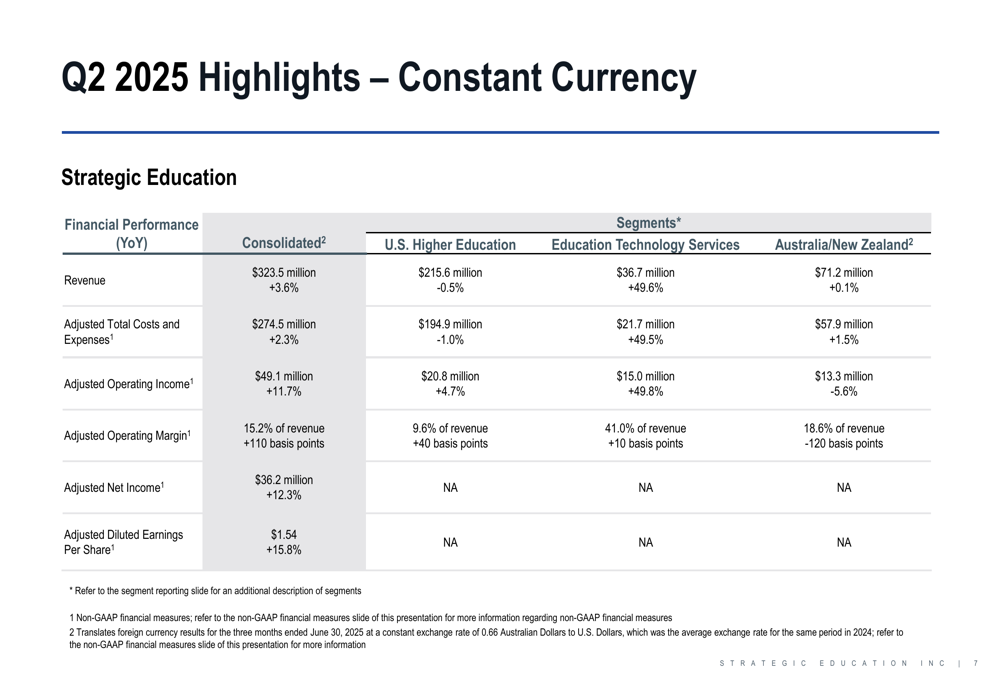
Strategic Education reported Q2 2025 revenue of $321.5 million on a current currency basis, representing a 2.9% increase year-over-year. The company’s adjusted operating income reached $48.5 million, up 10.5% from the same period last year, while adjusted operating margin expanded to 15.1% of revenue.
Total (EPA:TTEF) enrollment across all institutions stood at 104,863 students, reflecting a 1.2% decrease compared to Q2 2024. U.S. Higher Education enrollment declined 0.8% to 86,339 students, while Australia/New Zealand enrollment fell 3.1% to 18,524 students.
The company’s detailed financial performance is illustrated in the following slide:
This performance represents an improvement from Q1 2025, when the company reported an operating margin of 13.6%, demonstrating continued operational efficiency despite enrollment challenges.
Segment Performance Analysis
Strategic Education’s performance varied significantly across its three reporting segments:
1. U.S. Higher Education (USHE): Revenue declined slightly by 0.5% to $215.6 million, while adjusted operating income increased 4.7% to $20.8 million. Operating margin improved to 9.6% of revenue, up 40 basis points year-over-year.
2. Education Technology Services (ETS): This standout segment saw revenue surge 49.6% to $36.7 million, with adjusted operating income also growing 49.8% to $15.0 million. Operating margin remained strong at 41.0% of revenue.
3. Australia/New Zealand (ANZ): Revenue decreased 2.8% to $69.1 million on a current currency basis, while adjusted operating income fell 9.3% to $12.8 million. Operating margin contracted to 18.4% of revenue.
The company’s segment breakdown is detailed in the following slide:
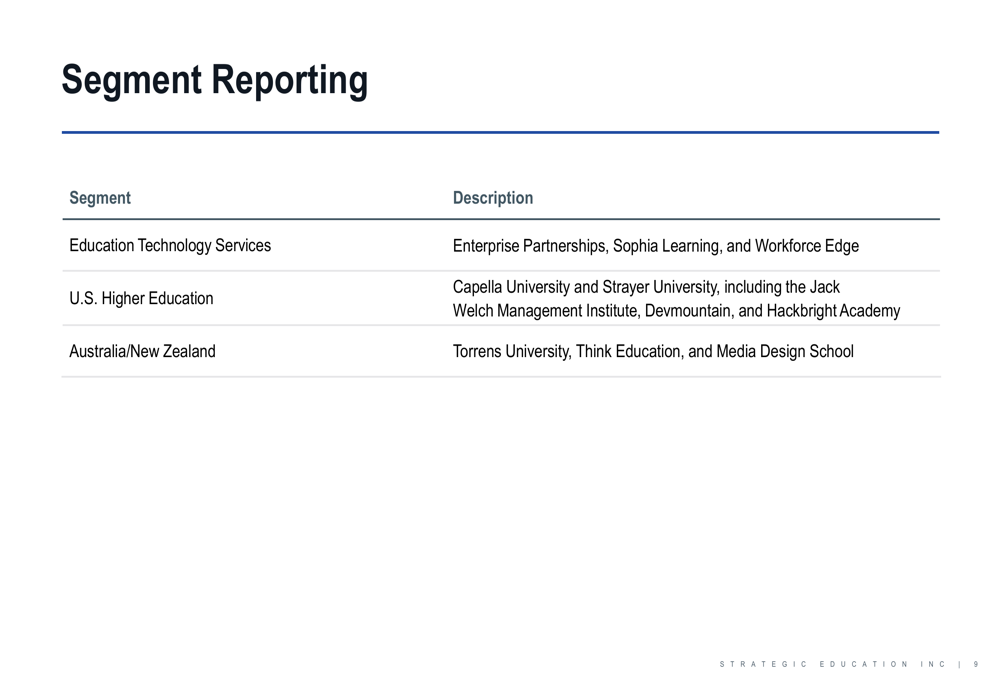
The exceptional growth in the ETS segment, which includes Enterprise Partnerships, Sophia Learning, and Workforce Edge, aligns with the company’s Q1 earnings call where management highlighted the strategic importance of corporate partnerships. Notably, Sophia Learning’s average total subscribers increased approximately 40% year-over-year, accelerating from the 37% growth reported in Q1 2025.
Strategic Positioning & Portfolio Strength
Strategic Education maintains a diversified portfolio of educational offerings, structured as a pyramid with flagship brands forming the foundation, international brands in the middle tier, skills-based learning products in the upper middle, and technology dissemination at the top.
The company’s portfolio structure is visualized in the following slide:
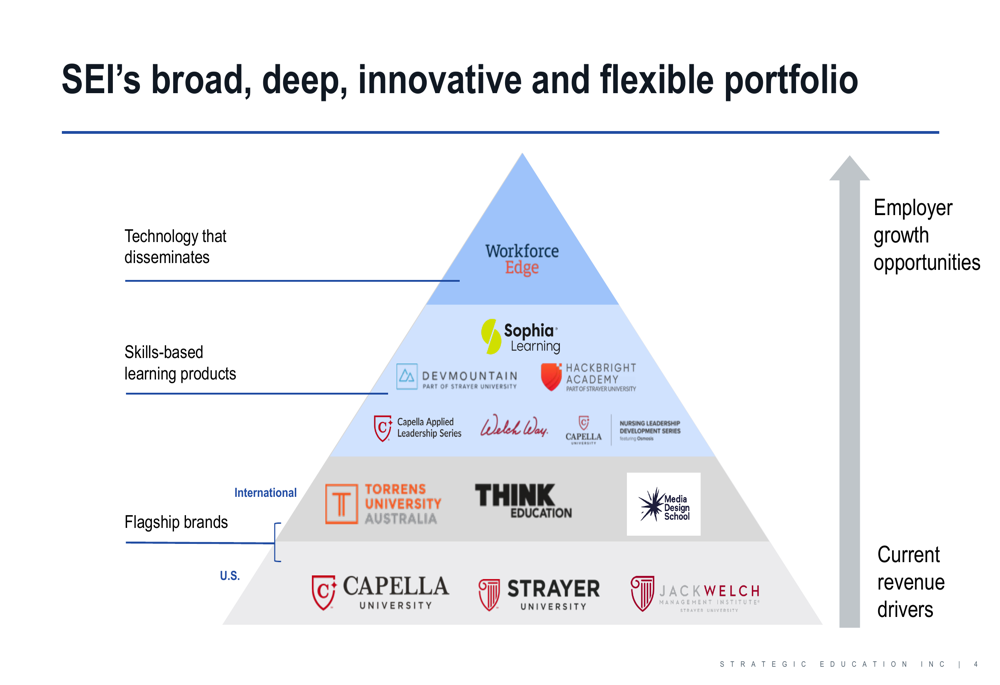
This diversified approach has provided resilience amid enrollment challenges in traditional higher education segments. The company’s flagship U.S. brands include Capella University, Strayer University, and Jack Welch Management Institute, while international operations center around Torrens University Australia, Think Education, and Media Design School.
The company’s geographic and operational overview is presented in the following slide:
Financial Health & Outlook
Strategic Education maintains a strong financial position with $180 million in cash, cash equivalents, and marketable securities as of June 30, 2025. The company generated $78 million in free cash flow for the six months ended June 30, 2025, demonstrating solid operational efficiency.
The company continues to return value to shareholders through a quarterly cash dividend of $0.60 per share, representing an annual dividend of $2.40 per share of common stock.
The detailed financial results on a constant currency basis are shown in the following slide:
While the presentation did not include specific forward guidance, the company’s performance appears generally aligned with the outlook provided during its Q1 earnings call, which targeted mid-single-digit enrollment growth and revenue growth of 4-6% for the full year 2025.
The continued strength in the Education Technology Services segment and margin expansion suggest Strategic Education is successfully executing its strategy despite enrollment headwinds in its traditional higher education segments. However, investors should monitor the enrollment trends in both U.S. and international markets, as continued declines could eventually pressure revenue growth in future quarters.
Full presentation:
This article was generated with the support of AI and reviewed by an editor. For more information see our T&C.