September looms as a risk month for stocks, Yardeni says

Introduction & Market Context
T. Rowe Price Group, Inc. (NASDAQ:TROW) released its Q2 2025 earnings presentation on August 1, 2025, revealing a mixed financial picture characterized by growing assets under management (AUM) but worsening net outflows. The asset manager’s stock was down 2.36% at the previous close, with premarket trading showing a further decline of 0.44%.
The presentation highlights the company’s continued growth in total assets, which reached $1.68 trillion, up from $1.57 trillion in the same quarter last year. However, this growth was driven entirely by market appreciation, as the firm faced accelerating outflows across several key segments.
Quarterly Performance Highlights
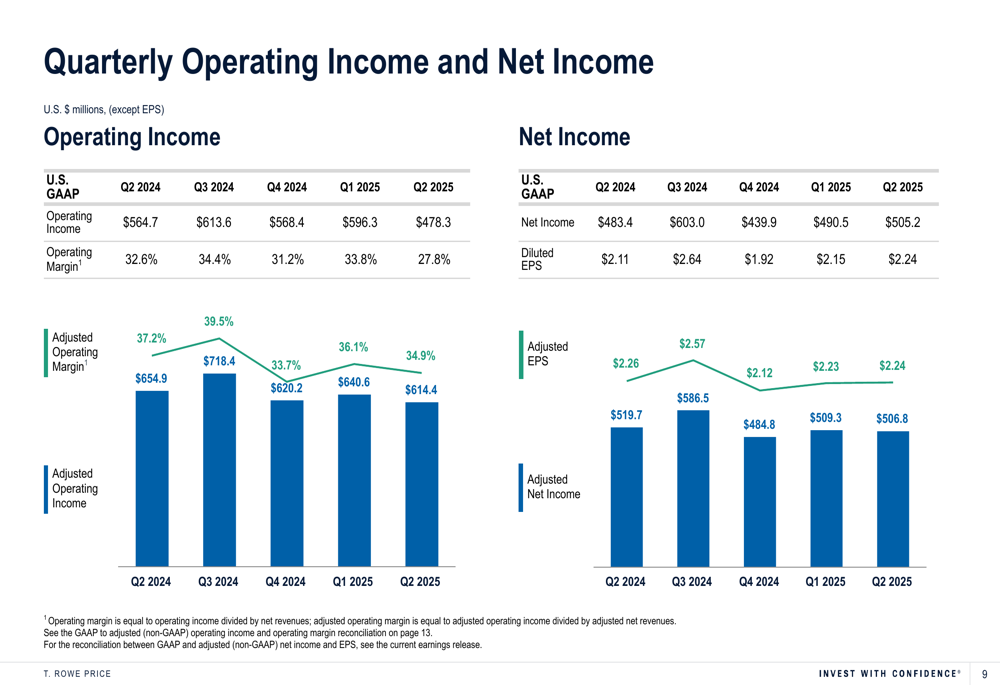
T. Rowe Price reported diluted earnings per share (EPS) of $2.24 for Q2 2025, representing a 6.2% increase from $2.11 in Q2 2024. However, adjusted EPS remained flat at $2.24 compared to $2.26 in the year-ago quarter. Net revenues slightly decreased to $1,723.3 million from $1,733.3 million in Q2 2024.
The company’s operating margin declined significantly to 27.8% from 32.6% in Q2 2024, while adjusted operating margin fell to 35.7% from 37.8%. This margin compression occurred despite the growth in AUM, suggesting increased cost pressures and fee rate compression.
As shown in the following financial highlights table:
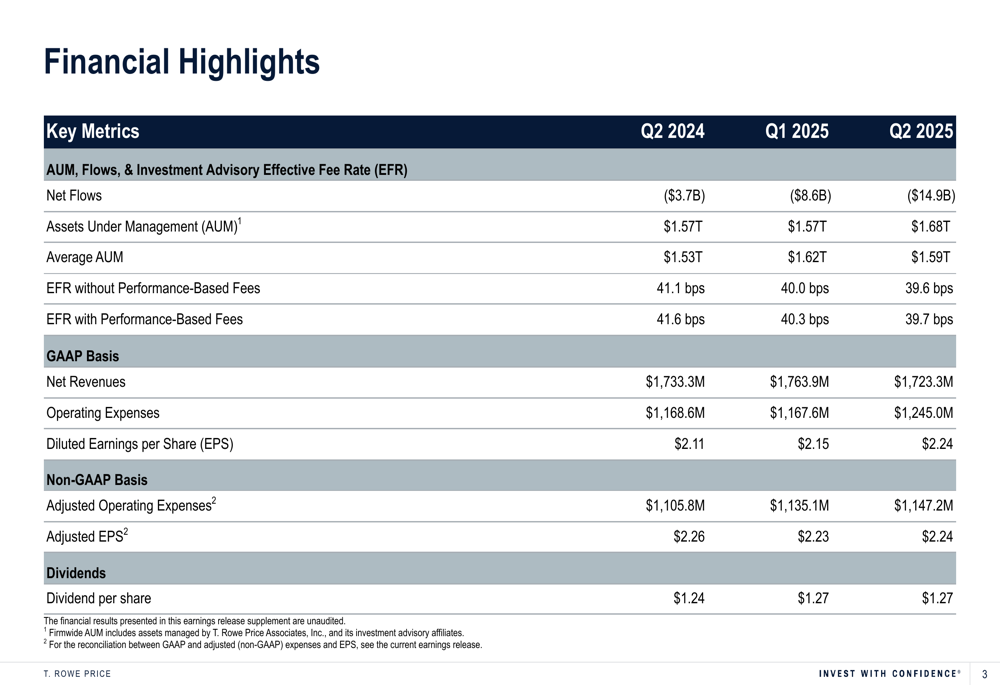
A concerning trend is the acceleration of net outflows, which reached -$14.9 billion in Q2 2025, compared to -$3.7 billion in Q2 2024 and -$8.6 billion in Q1 2025. This suggests increasing challenges in client retention and new business acquisition, despite the company’s strong long-term investment performance.
Assets Under Management Analysis
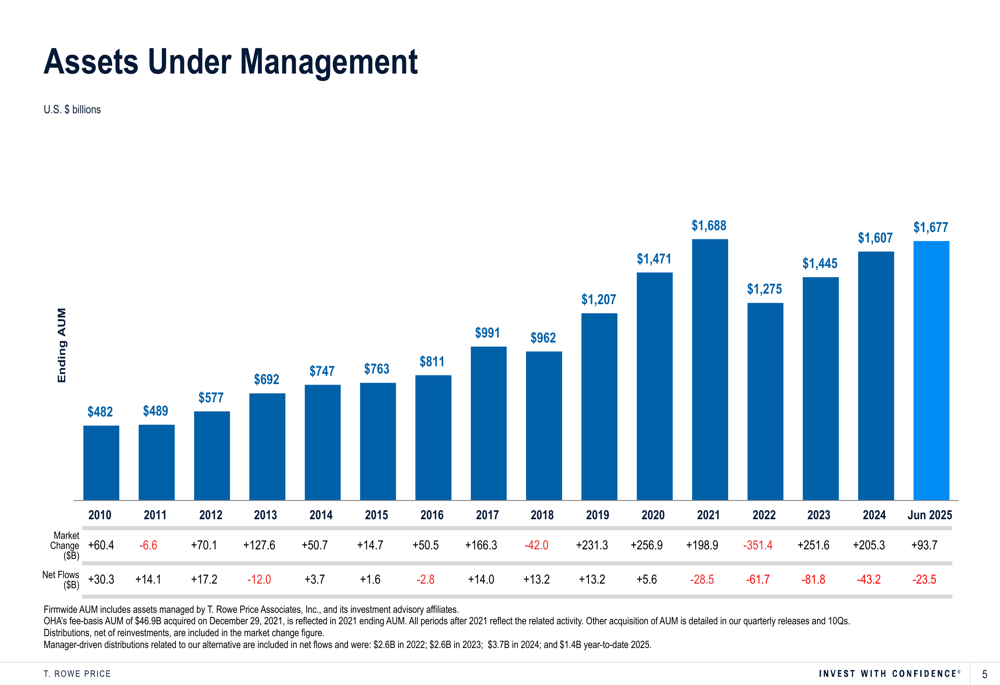
T. Rowe Price’s AUM has shown impressive long-term growth, increasing from $482 billion in 2010 to $1,677 billion by June 2025. However, this growth has been primarily driven by market appreciation rather than organic growth through net inflows. In the first half of 2025 alone, market appreciation contributed $93.7 billion to AUM growth, while net outflows reduced AUM by $23.5 billion.
The following chart illustrates this long-term AUM trend:
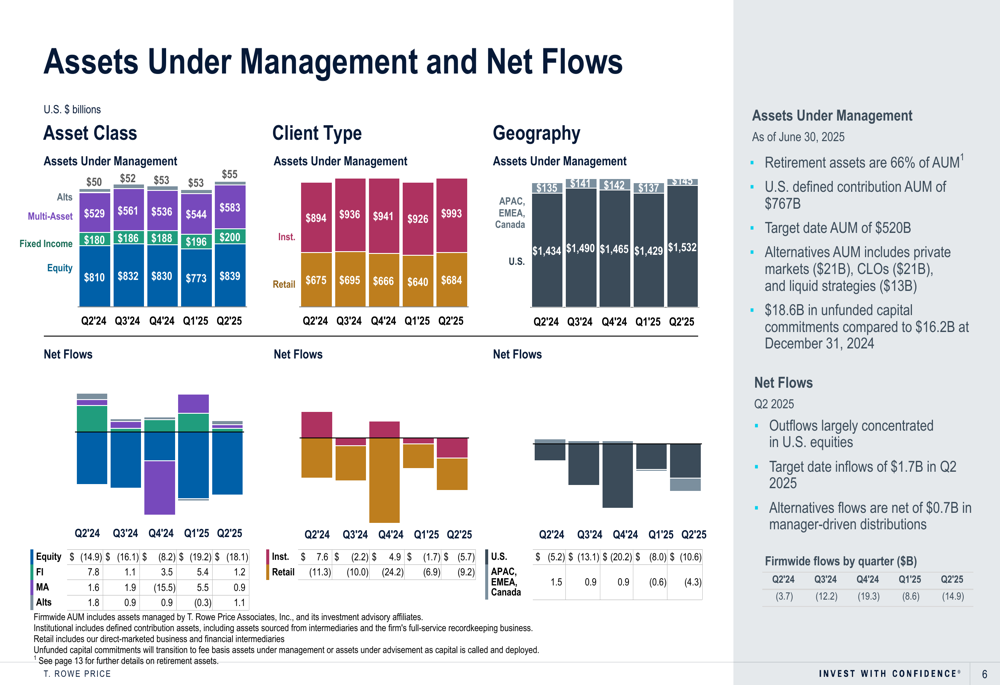
Breaking down the AUM by category reveals that equity strategies remain the largest component at $839 billion, followed by multi-asset strategies at $583 billion, fixed income at $200 billion, and alternatives at $53 billion. Institutionally-managed assets represent $993 billion, while retail accounts for $684 billion. Geographically, U.S. assets dominate at $1,532 billion, with international markets accounting for $145 billion.
The company maintains a strong position in retirement assets, which represent 66% of total AUM. Target (NYSE:TGT) date funds, a key component of retirement solutions, account for $520 billion in AUM.
The detailed breakdown of AUM by various categories is shown here:
Investment Performance
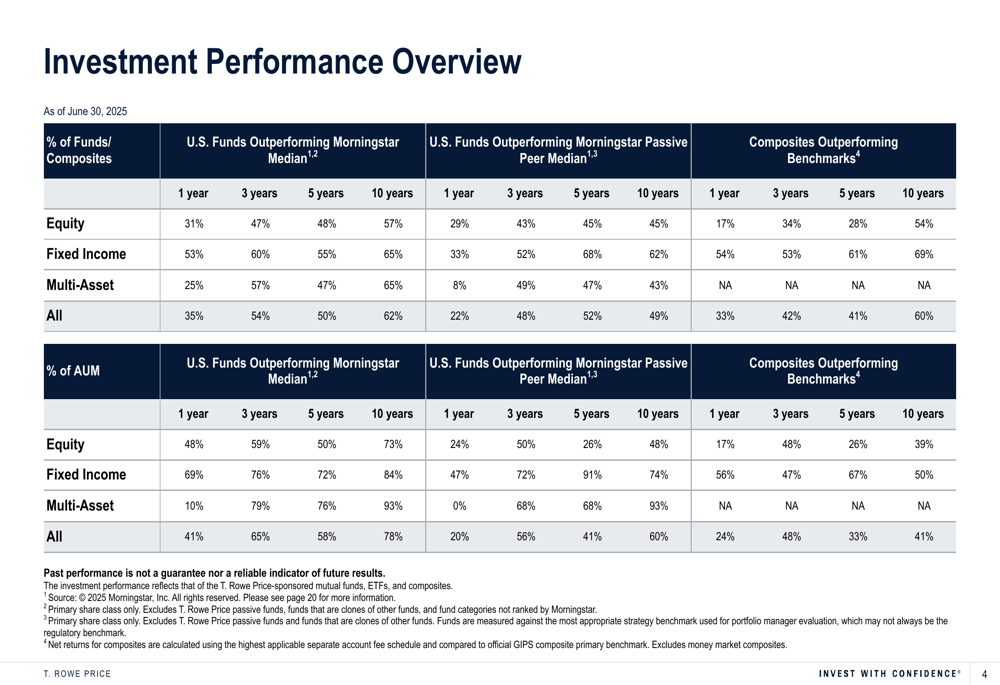
T. Rowe Price’s investment performance shows stronger results over longer time horizons, particularly in the 10-year period. For U.S. funds, 62% outperformed the Morningstar median over 10 years, representing 78% of AUM. However, shorter-term performance has been more challenging, with only 35% of funds (41% of AUM) outperforming the Morningstar median over one year.
When compared to passive peers, the picture is even more challenging, with only 22% of funds (20% of AUM) outperforming the Morningstar passive peer median over one year. This underperformance against passive strategies in shorter time frames may be contributing to the accelerating outflows.
The comprehensive investment performance metrics are displayed in this table:
Revenue and Expense Analysis
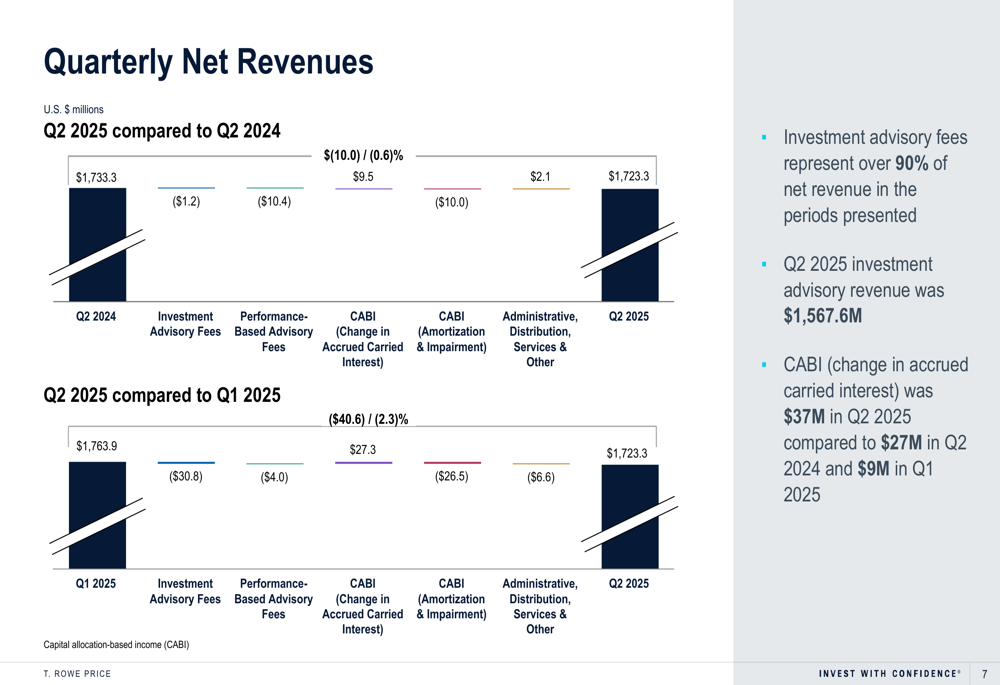
Investment advisory fees continue to be the primary revenue driver, representing over 90% of net revenue. In Q2 2025, investment advisory revenue was $1,567.6 million. The company also reported $37 million in accrued carried interest, up from $27 million in Q2 2024 and $9 million in Q1 2025, indicating growth in its alternatives business.
The breakdown of quarterly net revenues is illustrated below:
On the expense side, adjusted operating expenses increased by 3.7% year-over-year to $1,147.2 million in Q2 2025. This expense growth, coupled with the slight decline in revenues, contributed to the margin compression observed during the quarter.
Operating income for Q2 2025 was $478.3 million, down from $564.7 million in Q2 2024, while net income increased to $505.2 million from $483.4 million. This improvement in net income despite lower operating income suggests benefits from non-operating income sources, including the company’s substantial investment portfolio.
The operating income and margin trends are shown here:
Capital Management and Shareholder Returns
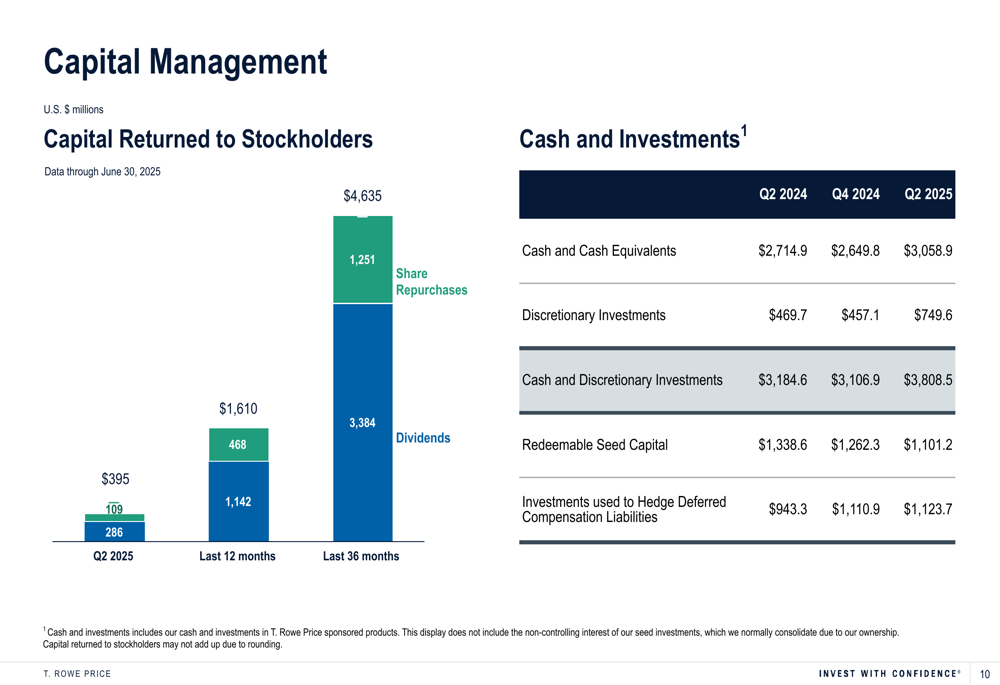
T. Rowe Price continues to prioritize returning capital to shareholders. Over the past 36 months, the company has returned $4,635 million to stockholders, with $3,384 million in dividends and $1,251 million in share repurchases. The quarterly dividend was increased to $1.27 per share, up from $1.24 in Q2 2024.
The company maintains a strong balance sheet with substantial liquidity. As of Q2 2025, cash and investments totaled $6,033.4 million, including $3,058.9 million in cash and cash equivalents, $749.6 million in discretionary investments, $1,101.2 million in redeemable seed capital, and $1,123.7 million in investments used to hedge deferred compensation liabilities.
The capital returned to stockholders is illustrated in this chart:
Strategic Initiatives and Outlook
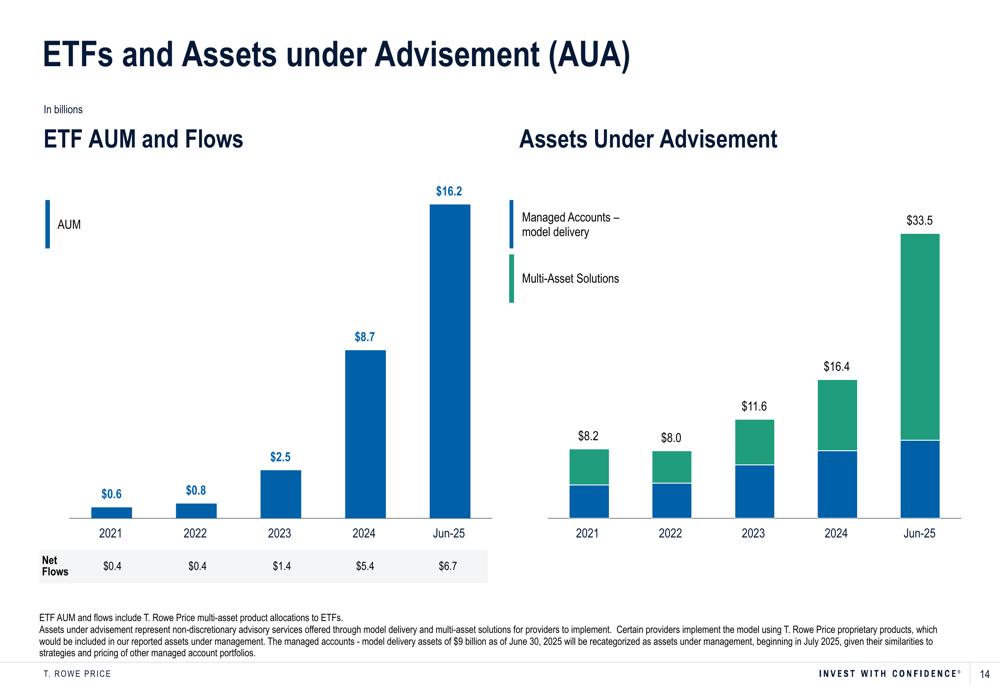
T. Rowe Price continues to expand its ETF offerings, with ETF AUM reaching $16.2 billion as of June 2025. ETFs showed positive net flows of $6.7 billion, contrasting with the overall negative flows for the firm. This suggests the company’s strategic pivot toward ETFs is gaining traction.
The firm is also focusing on its alternatives business, with $20 billion of alternatives fee-basis AUM eligible to earn carried interest. The company noted that 50%-60% of accrued carried interest is expected to be retained in operating income.
Assets under advisement reached $33.5 billion, with $17.1 billion in managed accounts-model delivery and $16.4 billion in multi-asset solutions. Notably, the company announced that $9 billion of managed accounts-model delivery assets will be recategorized as assets under management beginning in July 2025, which should provide a boost to reported AUM figures.
The ETF and assets under advisement data is shown here:
While T. Rowe Price faces challenges with continued outflows, particularly in traditional equity strategies, its strong position in retirement solutions and growing ETF business provide potential avenues for future growth. The company’s substantial cash reserves also give it flexibility to pursue strategic acquisitions or further enhance shareholder returns through dividends and share repurchases.
However, investors should monitor the accelerating pace of outflows and margin compression, which could put pressure on future financial results if these trends continue.
Full presentation:
This article was generated with the support of AI and reviewed by an editor. For more information see our T&C.