Gold prices dip as hawkish Fed minutes weigh ahead of Jackson Hole
Introduction & Market Context
TD Synnex Corp (NYSE:SNX) released its Q2 2025 investor presentation on June 24, 2025, highlighting strong gross billings growth across all regions despite facing challenges in meeting earnings expectations. The IT distribution giant’s stock has experienced volatility following its earnings announcement, with fundamentals data showing the stock trading at $130 in premarket, up 1.88% after recovering from an initial sharp decline.
The presentation comes at a time when the technology distribution sector faces both opportunities and challenges, with artificial intelligence driving new demand while economic uncertainties persist in various markets. TD Synnex’s position as a global distributor connecting vendors, service providers, and customers puts it at a critical junction in the IT ecosystem.
Quarterly Performance Highlights
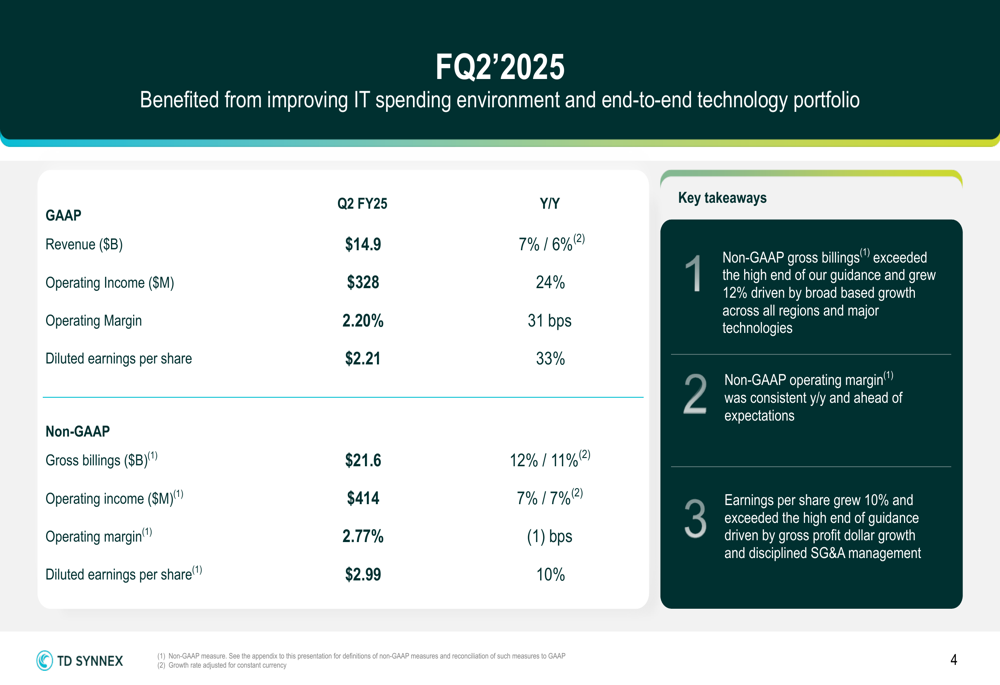
TD Synnex reported non-GAAP gross billings of $21.6 billion for Q2 2025, representing a 12% year-over-year increase. The company achieved non-GAAP diluted EPS of $2.99, up 10% year-over-year, with a non-GAAP operating margin of 2.77%. Strategic technologies now represent approximately 28% of non-GAAP gross billings, showing the company’s progress in higher-value segments.
As shown in the following snapshot of Q2 2025 performance metrics:
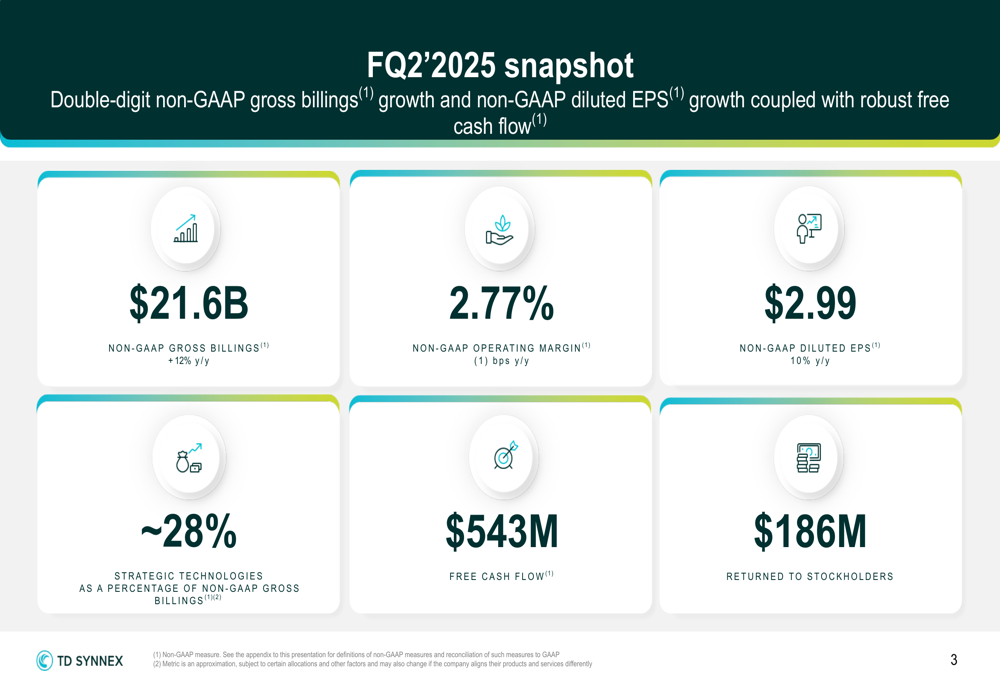
However, there appears to be a discrepancy between the figures presented in the investor slides and those reported in earnings coverage. While the presentation highlights non-GAAP diluted EPS of $2.99, earnings reports indicate actual EPS of $2.80, which missed analyst forecasts of $2.91. This discrepancy likely contributed to market volatility following the earnings announcement.
The company’s financial results demonstrate growth across key metrics despite these challenges:
Regional Performance
TD Synnex delivered strong performance across all geographic regions in Q2 2025. The Americas segment generated $13.3 billion in non-GAAP gross billings, a 9.0% year-over-year increase driven primarily by growth in Software (ETR:SOWGn), PCs, and ODM/CM (Original Design Manufacturer/Contract Manufacturing). Europe showed even stronger growth with $6.8 billion in non-GAAP gross billings, up 16.7% year-over-year, while Asia-Pacific and Japan achieved the highest growth rate at 22.0% year-over-year, reaching $1.5 billion.
The following regional breakdown illustrates the company’s global performance:
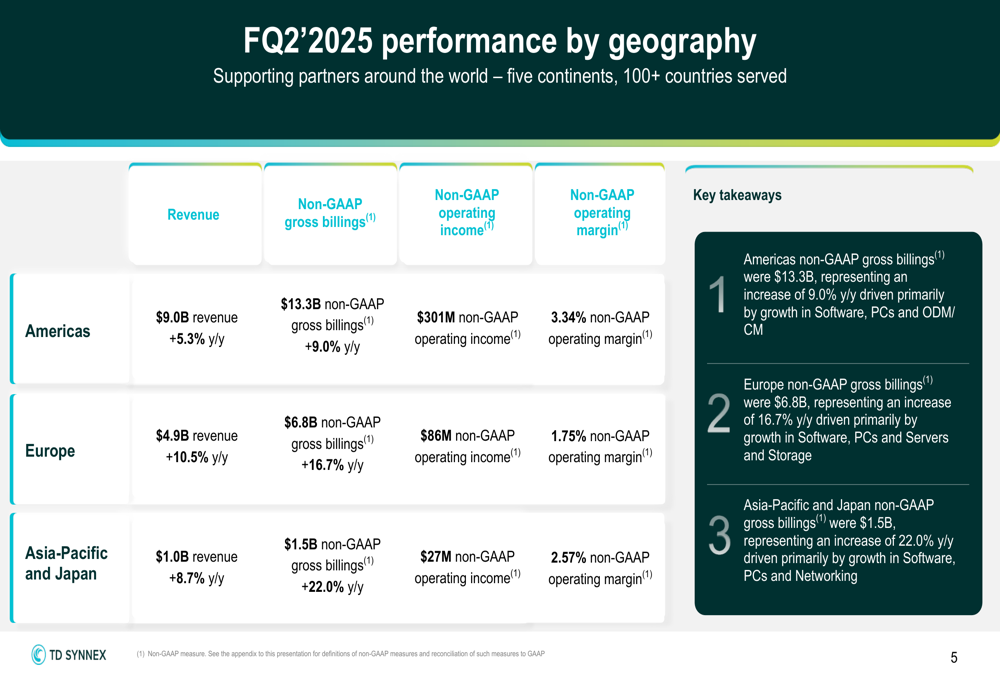
This broad-based regional growth demonstrates TD Synnex’s ability to capitalize on diverse market opportunities across its global footprint. Europe’s particularly strong performance indicates successful market penetration in a region that has historically presented challenges for many technology distributors.
Product Portfolio and Strategic Initiatives
TD Synnex maintains a balanced product portfolio across various technology categories. In Q2 2025, the company saw growth across both Advanced Solutions and Endpoint Solutions segments. Advanced Solutions non-GAAP gross billings grew by 12% year-over-year to $12.8 billion, while Endpoint Solutions increased by 13% to $8.8 billion.
The company’s product mix remains well-diversified, as shown in the following breakdown:
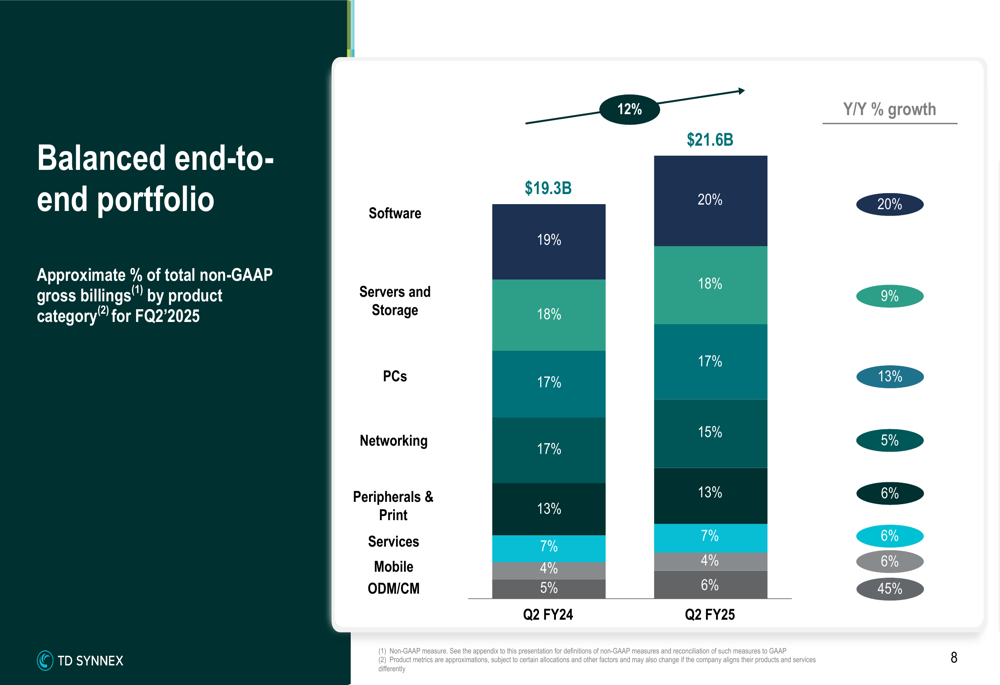
A key strategic focus for TD Synnex has been increasing the proportion of strategic technologies within its portfolio. These include cloud, security, data/AI/IoT, and hyperscale infrastructure. The company has made significant progress in this area, growing strategic technologies from 17% of non-GAAP gross billings in FY 2021 to 28% in Q2 FY25.
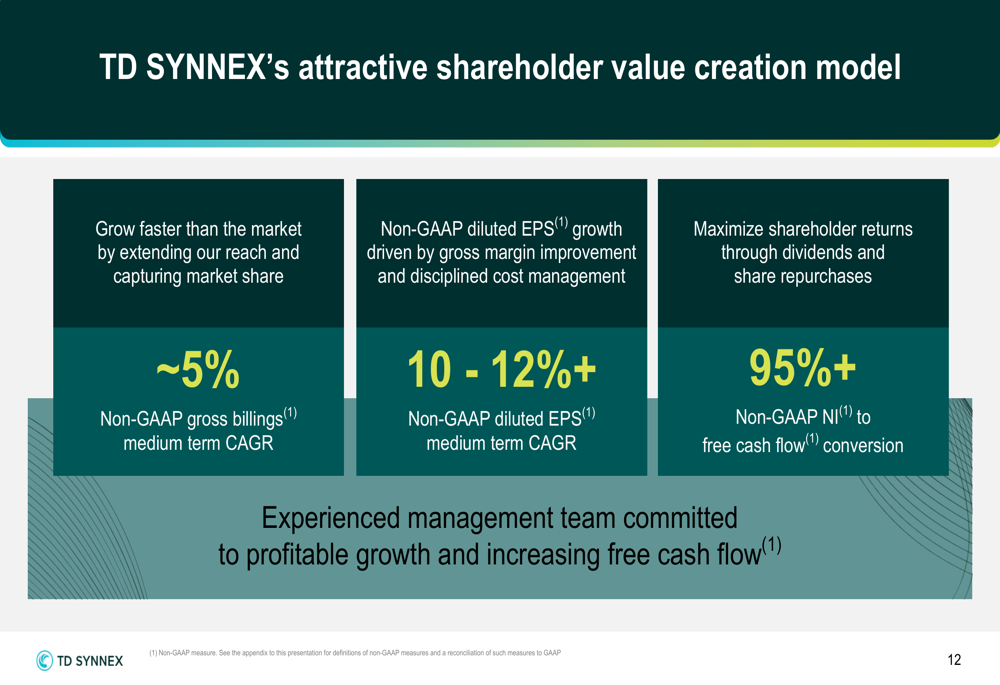
The company’s shareholder value creation model emphasizes three key pillars: growing faster than the market, delivering 10-12%+ non-GAAP diluted EPS medium-term CAGR, and maximizing shareholder returns with 95%+ non-GAAP net income to free cash flow conversion.
As illustrated in the following value creation model:
Financial Position
TD Synnex maintains a strong investment-grade balance sheet with significant liquidity. As of May 2025, the company had $767 million in cash and total liquidity of $5.6 billion. The company’s total debt leverage stands at 2.4x with net debt leverage of 1.9x, indicating a conservative financial approach.
The company generated $543 million in free cash flow during Q2 2025 and returned $186 million to stockholders through dividends and share repurchases. Year-to-date, TD Synnex has returned $323 million to shareholders, including $74 million in dividends and $249 million in share repurchases.
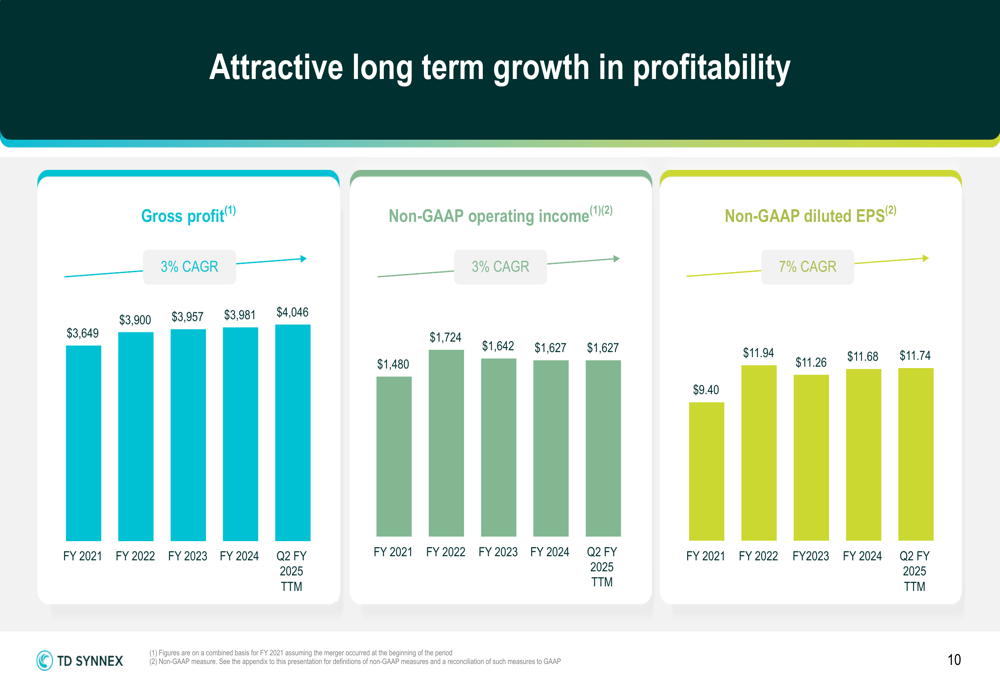
Long-term profitability trends remain positive, with a 3% CAGR in gross profit and a 7% CAGR in non-GAAP diluted EPS from FY 2021 to Q2 FY 2025 TTM:
Forward-Looking Statements
For Q3 FY2025, TD Synnex provided the following outlook:
- Non-GAAP gross billings: $21.0 - $22.0 billion
- Revenue: $14.7 - $15.5 billion
- Non-GAAP diluted EPS: $2.75 - $3.25
The company remains optimistic about its medium-term prospects, targeting approximately 5% non-GAAP gross billings medium-term CAGR and 10-12%+ non-GAAP diluted EPS medium-term CAGR.
TD Synnex is particularly well-positioned to capitalize on AI growth opportunities through its comprehensive vendor partnerships across the AI ecosystem. The company has established itself as a key player in the AI distribution space with partnerships spanning AI-enabled ISVs, AI accelerators, core AI software/platforms, and AI infrastructure.
While the Q2 earnings results presented some challenges, the company’s diverse portfolio, strong balance sheet, and strategic focus on high-growth technologies provide a foundation for future growth. Investors will be watching closely to see if TD Synnex can deliver on its Q3 outlook and address the factors that led to the Q2 earnings miss.
Full presentation:
This article was generated with the support of AI and reviewed by an editor. For more information see our T&C.