Instacart downgraded as competition tightening grip on online grocery

Transcat Inc. (NASDAQ:TRNS) presented its first quarter fiscal 2026 financial results on August 7, 2025, highlighting 15% consolidated revenue growth and the largest acquisition in company history, though profitability metrics showed some pressure.
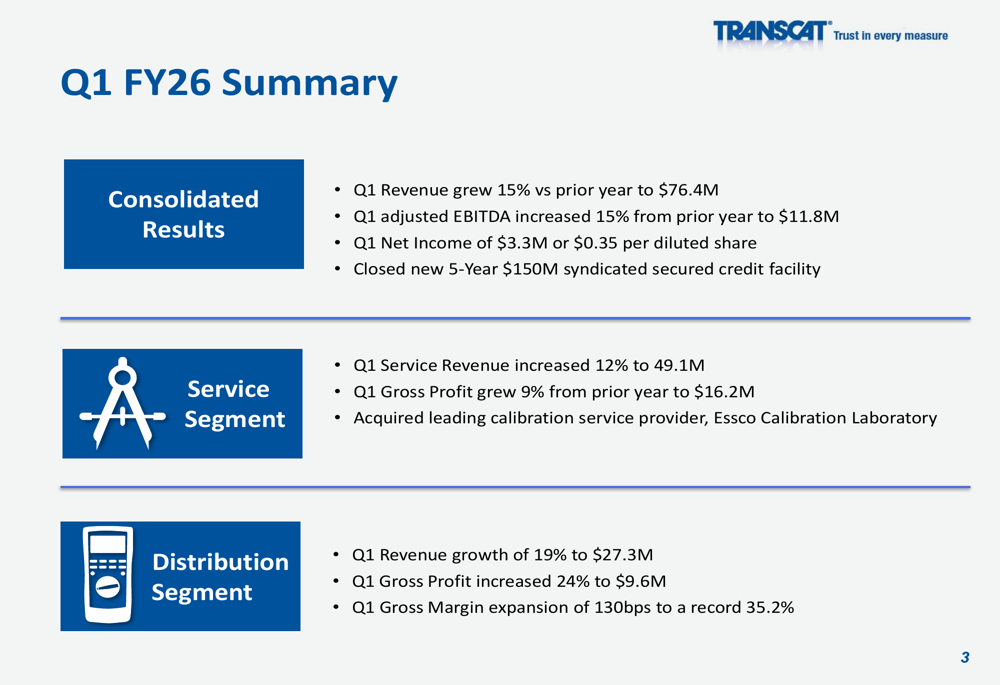
Quarterly Performance Highlights
Transcat reported consolidated revenue of $76.4 million for Q1 FY2026, representing a 15% increase compared to the same period last year. Adjusted EBITDA also grew by 15% to $11.8 million. However, net income decreased to $3.3 million ($0.35 per diluted share) from $4.4 million ($0.48 per diluted share) in Q1 FY2025, primarily due to higher interest expenses and taxes.
The company’s stock reacted positively to the results, with premarket trading showing a 6.26% increase to $82.80 per share.
As shown in the following summary of Q1 FY2026 results:
Segment Analysis
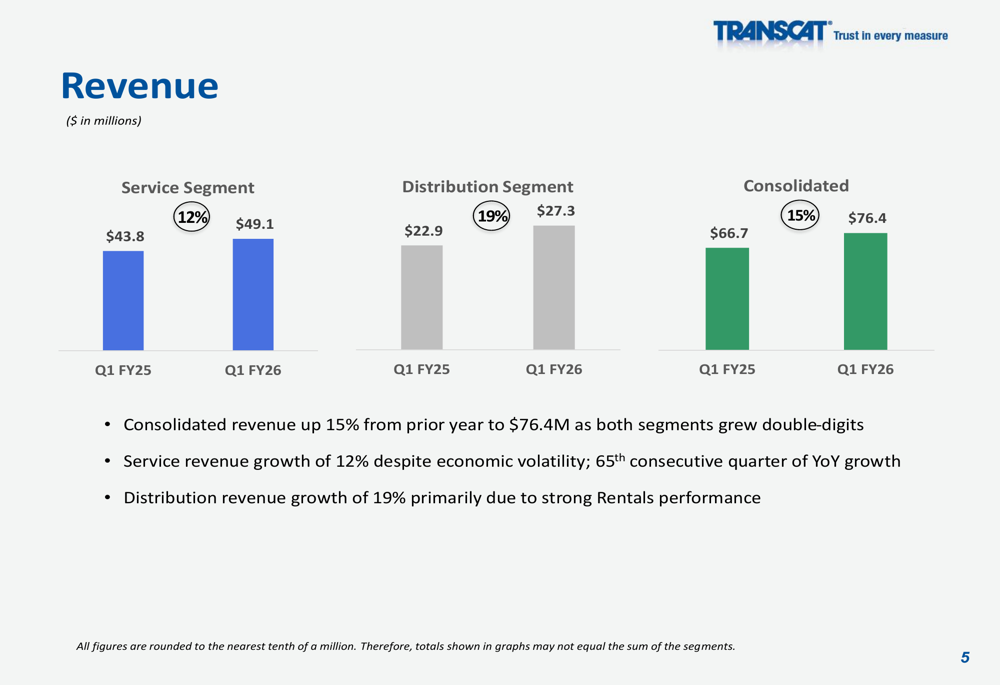
Both of Transcat’s business segments delivered double-digit revenue growth in the quarter. The Service segment, which represents approximately 64% of total revenue, increased by 12% to $49.1 million, marking the 65th consecutive quarter of year-over-year growth despite economic volatility.
The Distribution segment showed even stronger performance with 19% revenue growth to $27.3 million, driven primarily by strong rental performance. This segment also achieved record gross margin of 35.2%, an expansion of 130 basis points compared to the prior year.
The following chart illustrates the revenue growth across both segments:
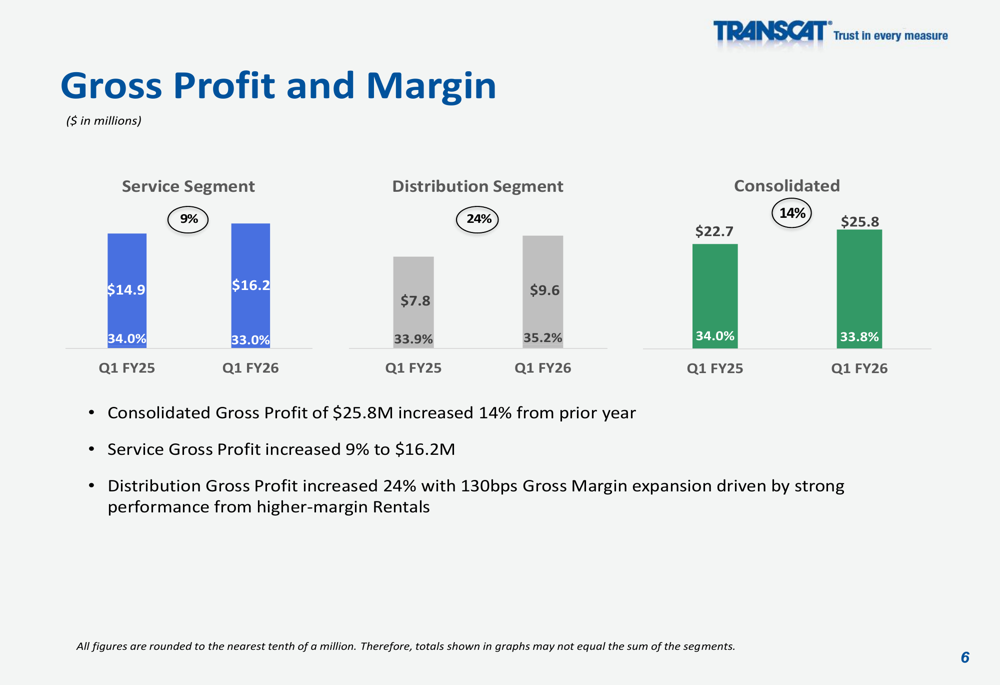
Profitability metrics by segment revealed mixed results. While consolidated gross profit increased 14% to $25.8 million, the Service segment’s gross margin contracted slightly to 33.0% from 34.0% in the prior year. Meanwhile, the Distribution segment’s gross margin expanded significantly to 35.2% from 33.9%.
The following chart details gross profit and margin performance:
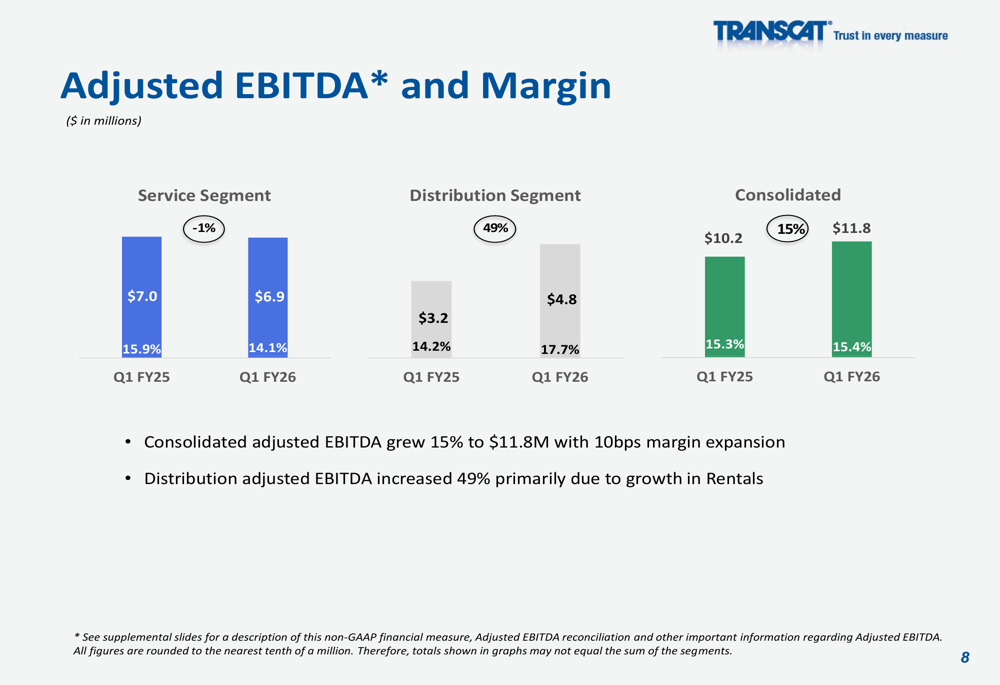
Adjusted EBITDA performance further highlighted the strength of the Distribution segment, which saw a 49% increase in adjusted EBITDA to $4.8 million with margin expansion to 17.7%. The Service segment’s adjusted EBITDA decreased slightly by 1% to $6.9 million with margin contraction to 14.1% from 15.9%.
As shown in the adjusted EBITDA breakdown by segment:
Acquisition Strategy
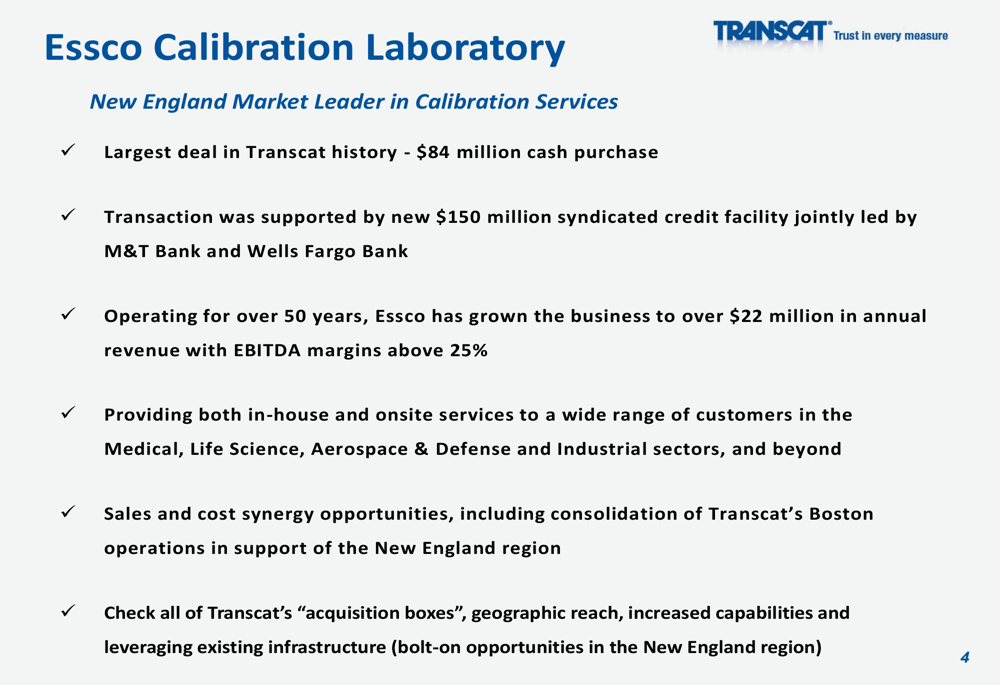
The most significant strategic development in the quarter was Transcat’s acquisition of Essco Calibration Laboratory for $84 million in cash, representing the largest deal in the company’s history. Essco is described as a New England market leader in calibration services with over 50 years of operating history and annual revenue exceeding $22 million with EBITDA margins above 25%.
The acquisition was supported by Transcat’s new $150 million syndicated credit facility jointly led by M&T Bank (NYSE:MTB) and Wells Fargo (NYSE:WFC) Bank. Management highlighted several strategic benefits, including geographic expansion, increased capabilities, and potential for sales and cost synergies.
The following slide details the Essco acquisition:
Balance Sheet and Cash Flow
Transcat’s balance sheet reflected the impact of its acquisition strategy, with total debt increasing to $34.4 million as of June 28, 2025, compared to $3.6 million a year earlier. The company reported a leverage ratio of 0.82x (total debt to TTM adjusted EBITDA) at quarter-end, indicating a conservative approach to financial leverage despite the significant acquisition activity.
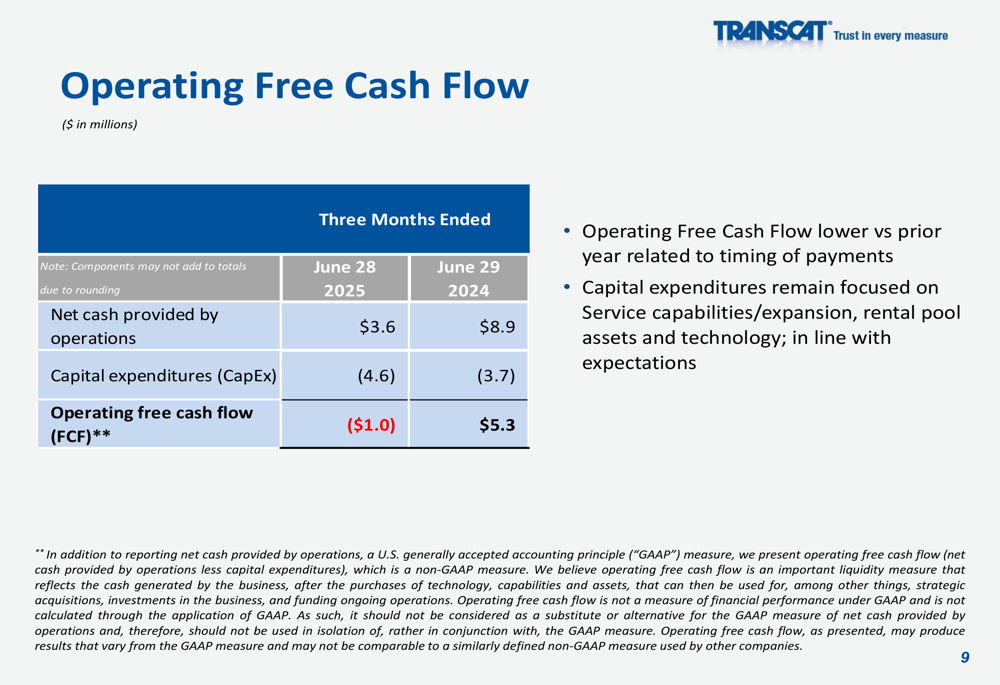
Operating free cash flow for the quarter was negative $1.0 million, compared to positive $5.3 million in the prior year period, which management attributed to timing of payments. Capital expenditures increased to $4.6 million from $3.7 million, focused on service capabilities, rental pool assets, and technology investments.
The following chart shows the operating free cash flow comparison:
Forward-Looking Statements
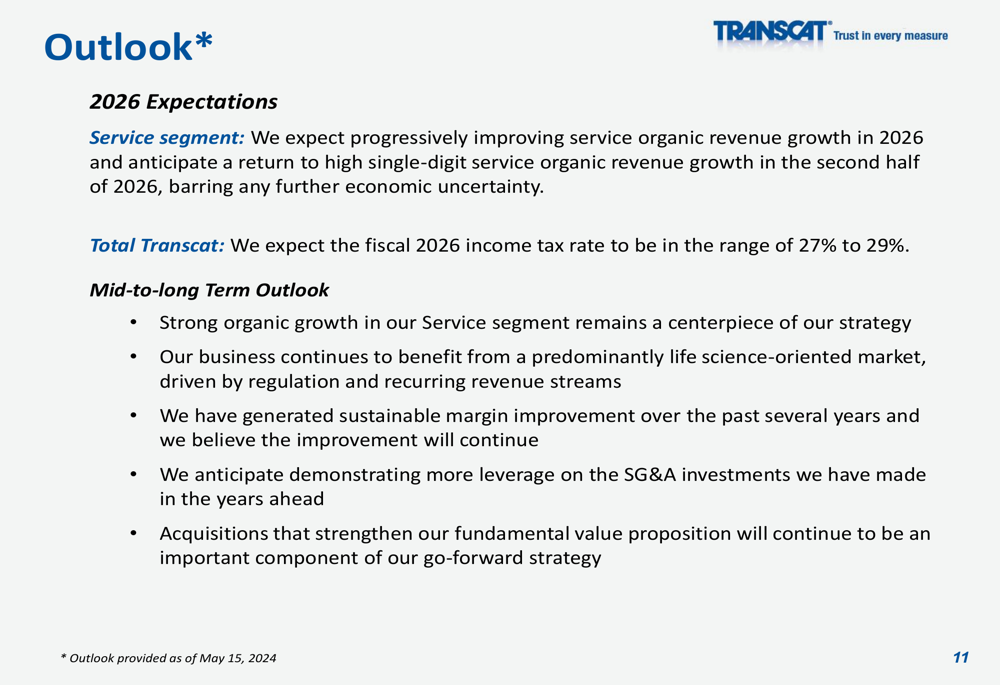
Looking ahead, Transcat management expressed optimism about progressively improving service organic revenue growth throughout fiscal 2026, anticipating a return to high single-digit growth in the second half of the year, barring further economic uncertainty. The company expects its fiscal 2026 income tax rate to be in the range of 27% to 29%.
Management reaffirmed its long-term strategy centered on strong organic growth in the Service segment, with continued focus on the life science market driven by regulation and recurring revenue streams. The company also expects to demonstrate more leverage on its SG&A investments in the years ahead and confirmed that strategic acquisitions will remain an important component of its growth strategy.
As detailed in the company’s outlook:
This Q1 performance follows Transcat’s strong Q4 FY2025 results, when the company beat analyst expectations with an EPS of $0.68 compared to the forecasted $0.65. The company appears to be maintaining its growth momentum despite some profitability challenges in the current quarter, with the Essco acquisition positioning Transcat for potential accelerated growth in its core calibration services business.
Full presentation:
This article was generated with the support of AI and reviewed by an editor. For more information see our T&C.