Oracle stock falls after report reveals thin margins in AI cloud business

Introduction & Market Context
Tri Pointe Homes Inc (NYSE:TPH) released its first quarter 2025 results on April 24, showing significant year-over-year declines in key operational metrics while maintaining improved margins. The company, which operates across 18 markets in the United States, reported a 25% decrease in home deliveries and a 22% drop in revenue compared to the same period last year, reflecting a broader slowdown in the housing market after stronger performance in previous quarters.
The homebuilder’s stock closed at $30.88 on the day of the presentation, down 0.87% and significantly below its 52-week high of $47.78, indicating ongoing investor concerns about the housing sector’s trajectory in 2025.
Quarterly Performance Highlights
Tri Pointe delivered 1,040 homes in Q1 2025, down 25% from 1,393 in Q1 2024, while the average sales price increased 5% to $693,000. Home sales revenue declined 22% to $721 million compared to $918 million in the prior year period.
As shown in the following comprehensive summary of first quarter results:
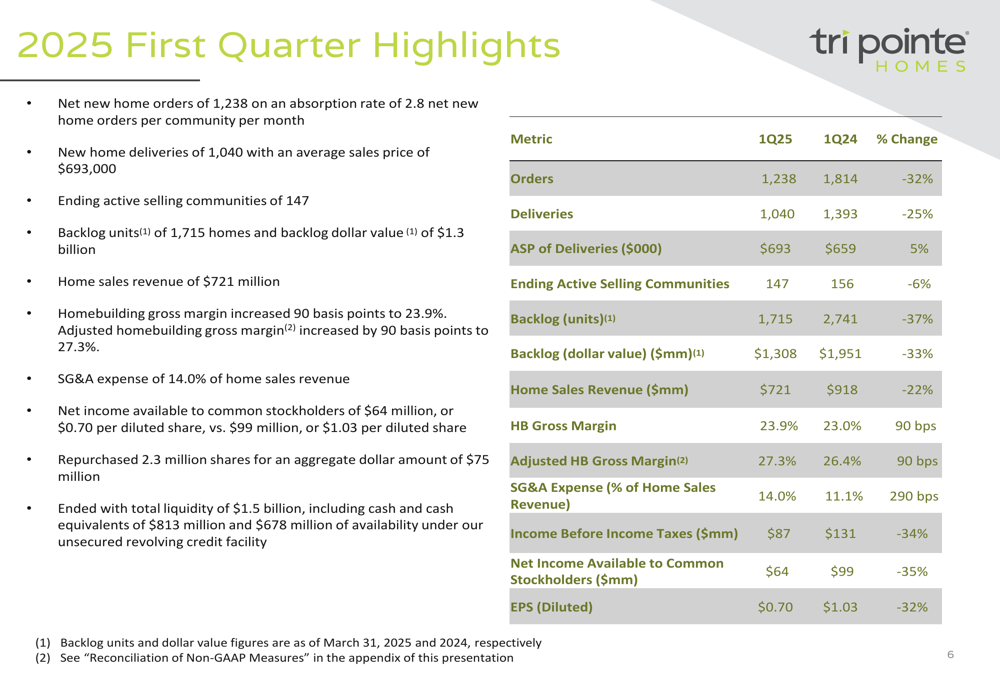
Despite the volume decline, Tri Pointe improved its homebuilding gross margin by 90 basis points to 23.9%, with adjusted homebuilding gross margin also increasing 90 basis points to 27.3%. However, SG&A expenses as a percentage of home sales revenue increased significantly to 14.0%, up 290 basis points year-over-year, reflecting the challenge of maintaining operational efficiency with lower sales volumes.
Net income available to common stockholders fell 35% to $64 million, with diluted earnings per share decreasing 32% to $0.70. During the quarter, the company repurchased 2.3 million shares for $75 million, demonstrating continued confidence in its long-term value proposition despite current market challenges.
Order Trends and Community Count
New home orders declined 32% year-over-year to 1,238 in Q1 2025, with the monthly absorption rate falling to 2.8 homes per community from 3.9 in the prior year period. The company ended the quarter with 147 active selling communities, a 6% decrease from 156 communities a year earlier.
The following chart illustrates the company’s community count and absorption rate trends:
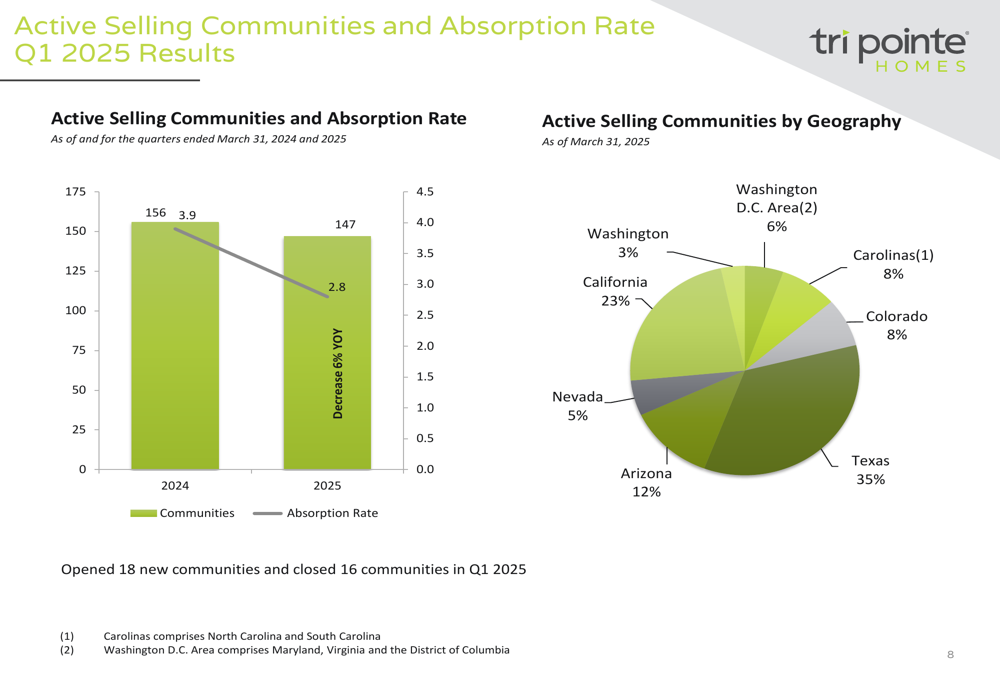
Texas represented the largest portion of Tri Pointe’s active selling communities at 35%, followed by California at 23% and Arizona at 12%. The company opened 18 new communities and closed 16 during the quarter.
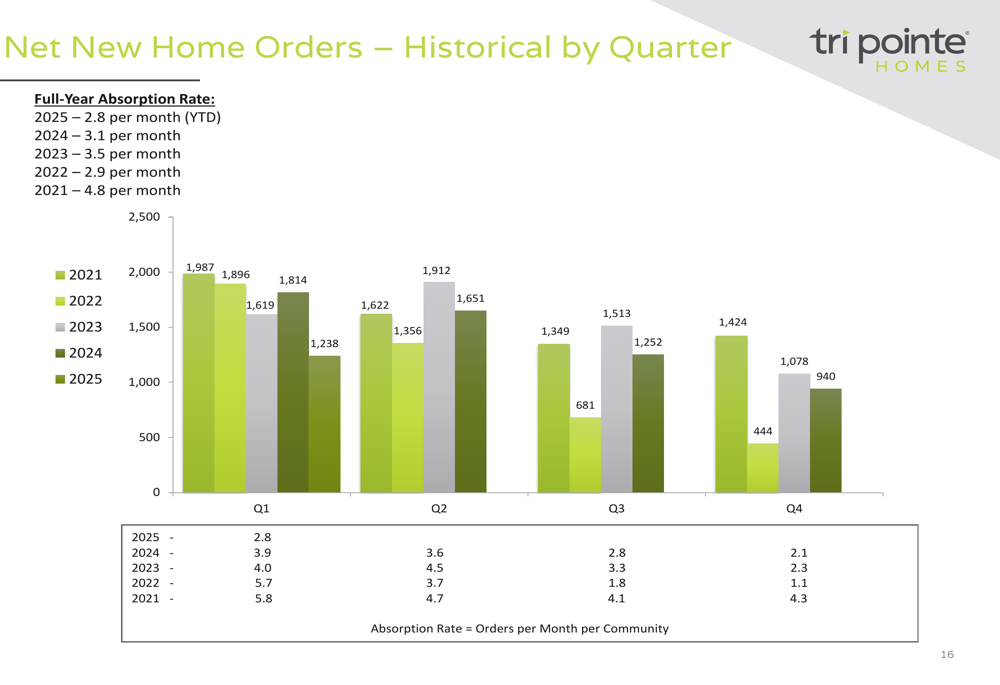
The historical quarterly order trends reveal a significant slowdown compared to previous years:
Backlog units at quarter-end stood at 1,715 homes valued at approximately $1.3 billion, representing year-over-year declines of 37% and 33%, respectively. The average sales price in backlog increased to $763,000 from $712,000 a year earlier.
Geographic Distribution and Revenue
Tri Pointe maintains a geographically diversified portfolio across the Western, Central, and Eastern United States. California represented the largest portion of home sales revenue at 30%, followed by Texas at 28% and Arizona at 15%.
The following chart shows the geographic distribution of home sales revenue:
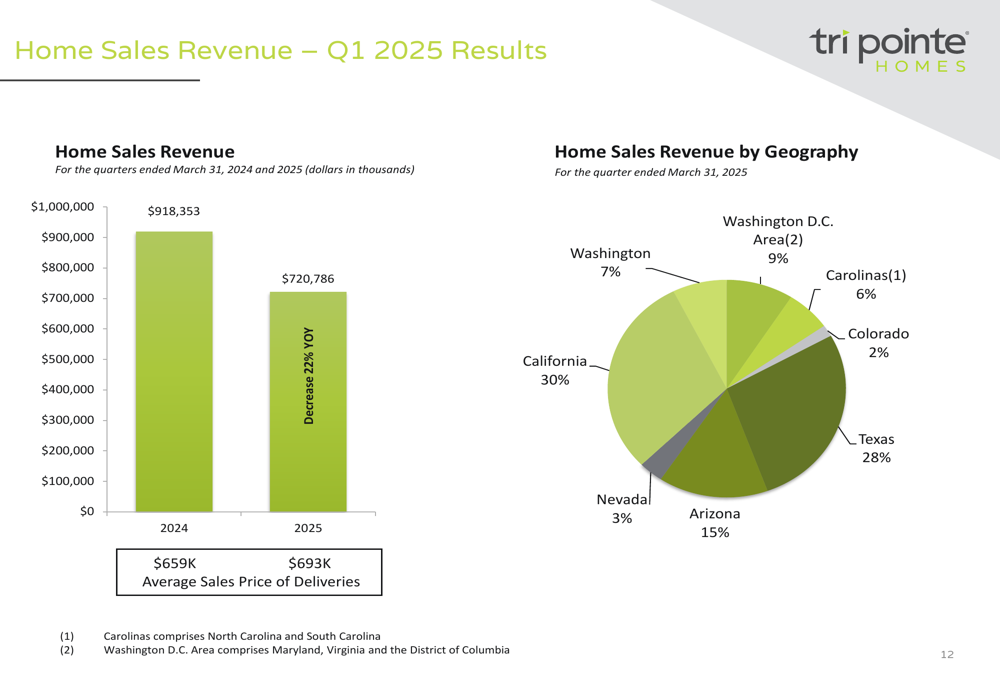
The company’s geographic diversification strategy has helped mitigate regional market fluctuations, though all regions experienced decreased delivery volumes in the first quarter. The backlog conversion ratio improved to 69% from 60% in the prior year period, indicating more efficient conversion of orders to closings despite market challenges.
Land Position and Growth Strategy
Tri Pointe maintained a strong land position with 35,201 lots owned or controlled as of March 31, 2025, representing several years of supply based on current delivery rates. Approximately 48% of these lots are owned, with the remainder under option contracts.
The following chart details the company’s land position by geography:
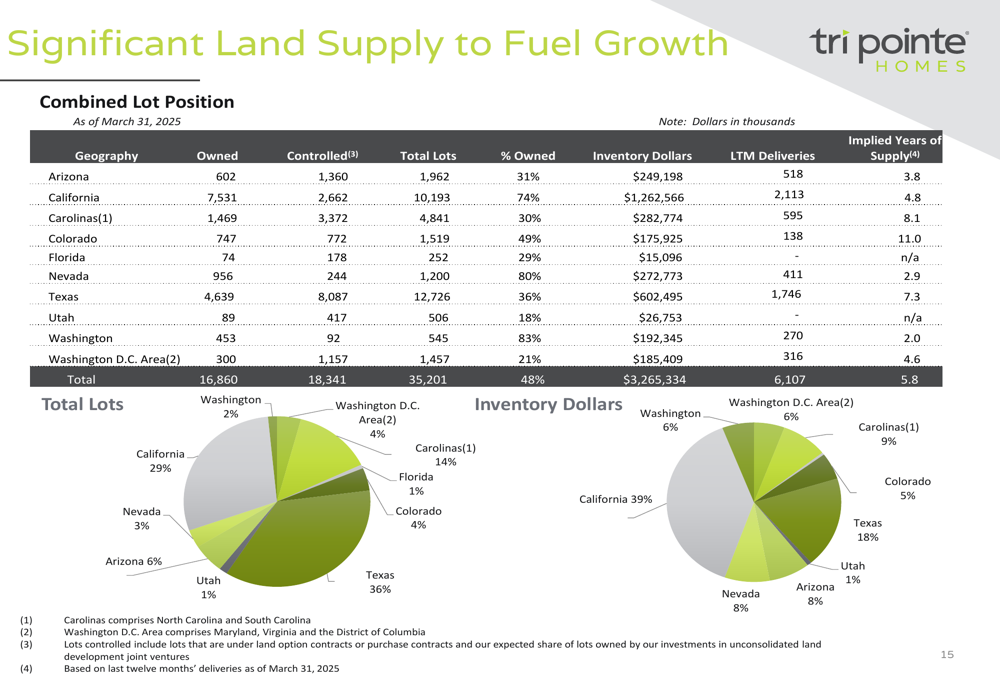
This substantial land supply provides Tri Pointe with flexibility to navigate market conditions while maintaining a pipeline for future growth. The company’s total real estate inventory stood at $3.27 billion at quarter-end, up slightly from $3.15 billion at the end of 2024.
Balance Sheet and Capital Management
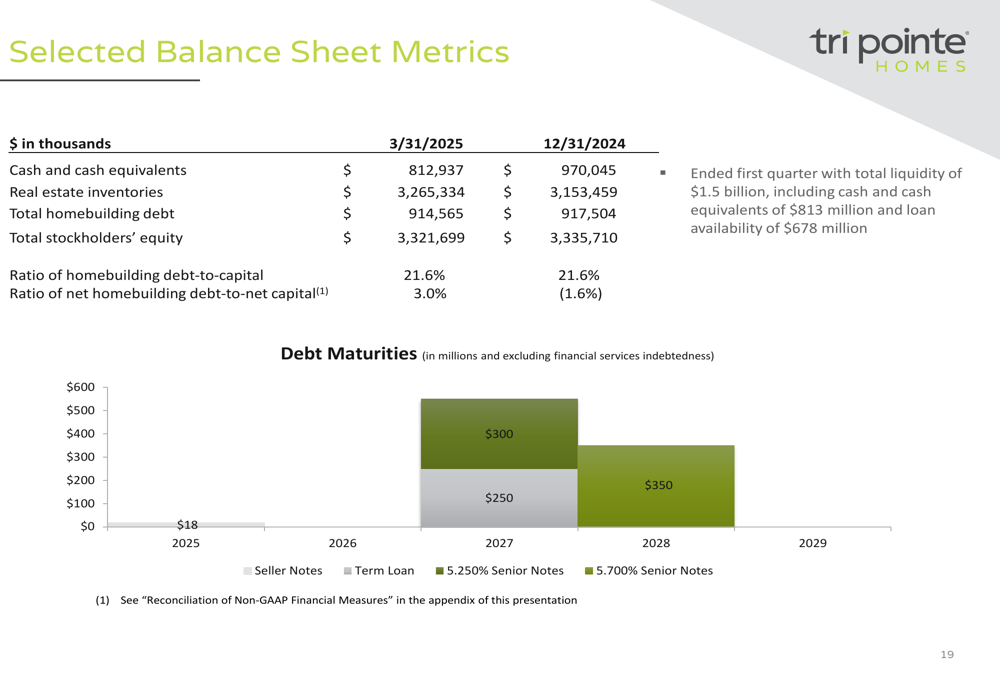
Tri Pointe maintained a strong financial position with $813 million in cash and cash equivalents and total liquidity of $1.5 billion, including availability under its revolving credit facility. The company’s homebuilding debt-to-capital ratio remained steady at 21.6%, while its net homebuilding debt-to-net capital ratio was 3.0%, up from negative 1.6% at year-end 2024.
The following chart illustrates key balance sheet metrics:
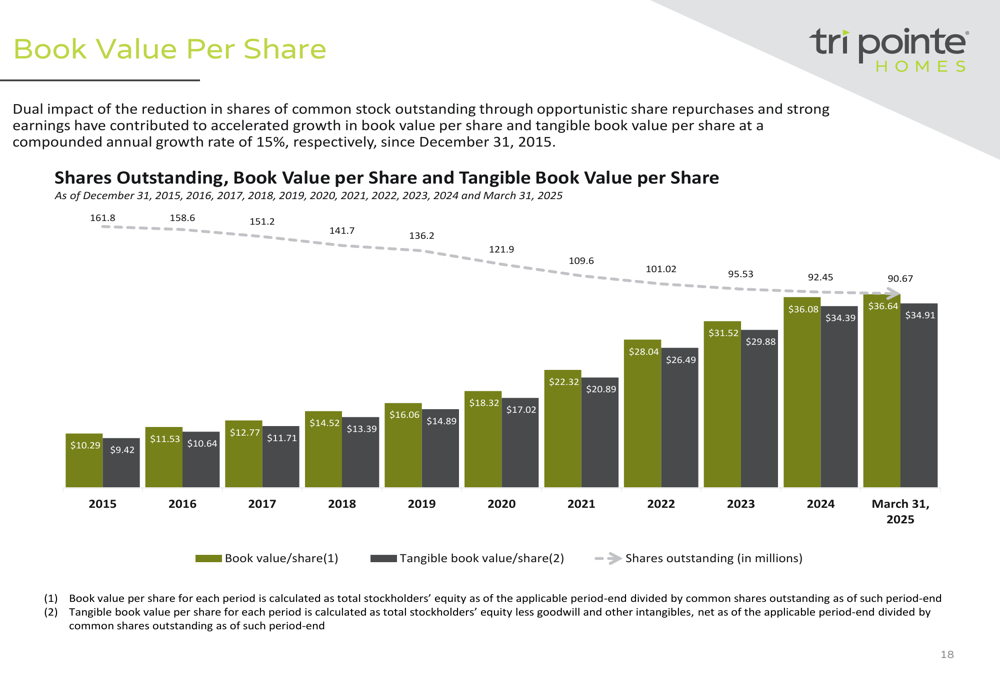
The company’s book value per share has shown consistent growth over the past decade, increasing from $10.29 in 2015 to $36.08 as of March 31, 2025, reflecting long-term value creation despite cyclical market conditions:
Management Outlook
For the second quarter of 2025, Tri Pointe anticipates delivering between 1,100 and 1,200 homes at an average sales price between $680,000 and $690,000, with homebuilding gross margin expected between 21.5% and 22.5%. SG&A expenses are projected to be 12.5% to 13.5% of home sales revenue.
For the full year 2025, the company forecasts:
- Deliveries between 5,000 and 5,500 homes
- Average sales price between $665,000 and $675,000
- Homebuilding gross margin between 20.5% and 22.0%
- SG&A expense ratio between 11.5% and 12.5%
- Effective tax rate of approximately 27.0%
These projections suggest management anticipates continued market challenges throughout 2025, with full-year deliveries representing a significant decline from the 6,107 homes delivered in the trailing twelve months ended March 31, 2025.
Conclusion
Tri Pointe Homes’ first quarter results reflect a significant cooling in the housing market compared to the stronger performance seen in previous quarters. While the company has maintained improved margins and a strong balance sheet, the substantial year-over-year declines in orders, deliveries, and revenue highlight the challenges facing homebuilders in the current economic environment.
The company’s geographic diversification, substantial land position, and financial flexibility provide some insulation against market volatility, but management’s cautious outlook for the remainder of 2025 suggests continued headwinds. Investors will likely focus on whether Tri Pointe can maintain its improved margins while navigating lower delivery volumes and potentially increasing competitive pressures in key markets.
Full presentation:
This article was generated with the support of AI and reviewed by an editor. For more information see our T&C.