AlphaTON stock soars 200% after pioneering digital asset oncology initiative

Introduction & Market Context
Uber Technologies Inc (NYSE:UBER) reported strong second-quarter 2025 results on August 6, with revenue climbing 18% year-over-year to $12.65 billion, according to the company’s earnings presentation. The ride-hailing and delivery giant’s shares closed at $89.39 prior to the release, with premarket trading showing a slight decline of 0.92% to $88.57.
The company’s Q2 performance demonstrated continued momentum across its business segments, with particular strength in its core Mobility and Delivery operations. This follows a solid Q1 where Uber beat earnings expectations but slightly missed on revenue, resulting in a stock pullback at that time.
Quarterly Performance Highlights
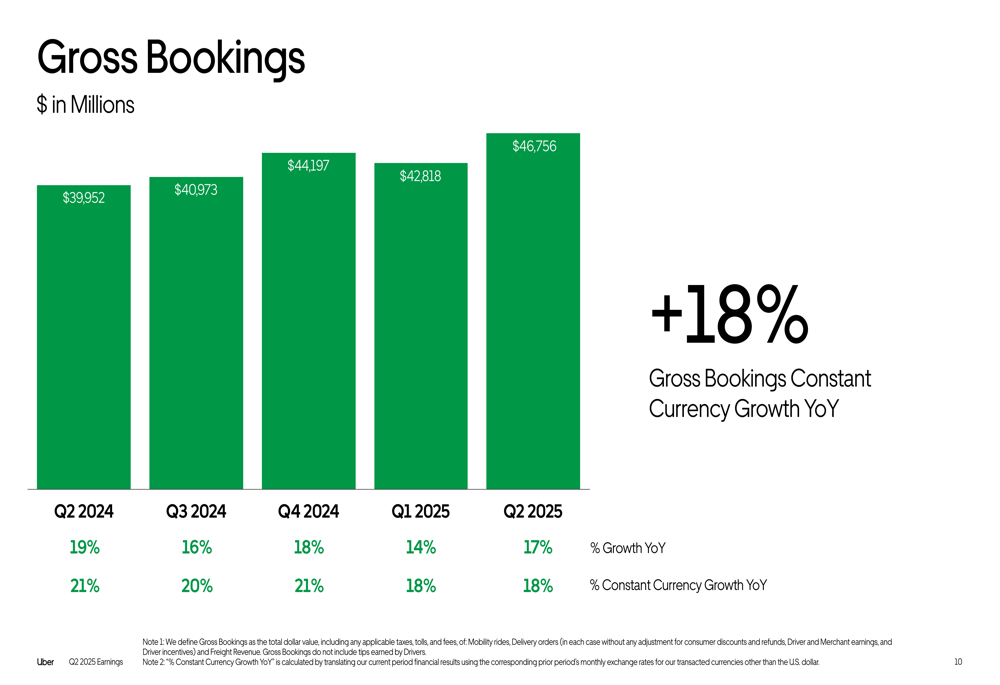
Uber’s Q2 2025 results showed impressive growth across key metrics. Gross Bookings reached $46.76 billion, representing a 17% increase year-over-year (18% in constant currency).
As shown in the following chart of quarterly Gross Bookings growth:
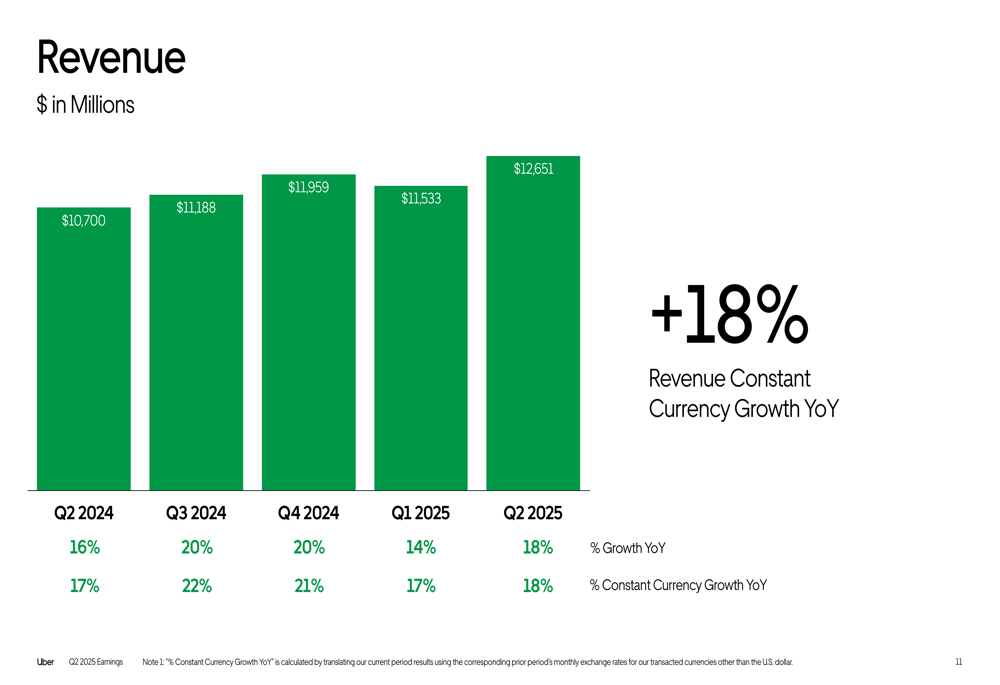
Revenue growth maintained strong momentum at 18% year-over-year (18% in constant currency), reaching $12.65 billion compared to $10.70 billion in Q2 2024.
The revenue growth trend over five quarters is illustrated here:
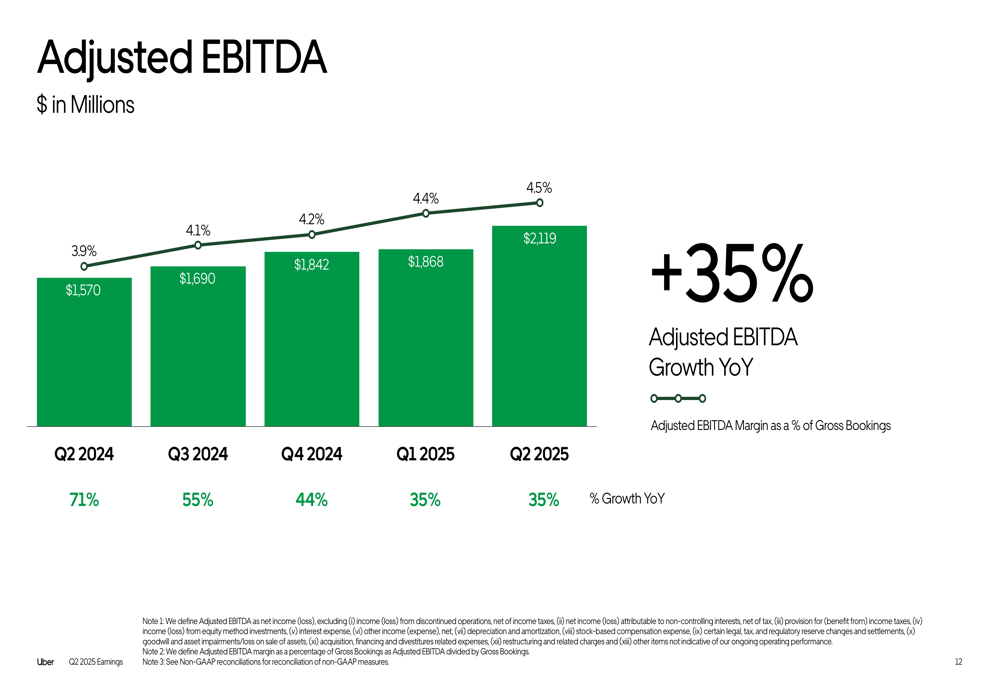
Profitability metrics showed even stronger improvement, with Adjusted EBITDA surging 35% year-over-year to $2.12 billion. Notably, Adjusted EBITDA margin as a percentage of Gross Bookings expanded to 4.5%, up from 3.9% in the same quarter last year.
The following chart demonstrates this consistent margin expansion:
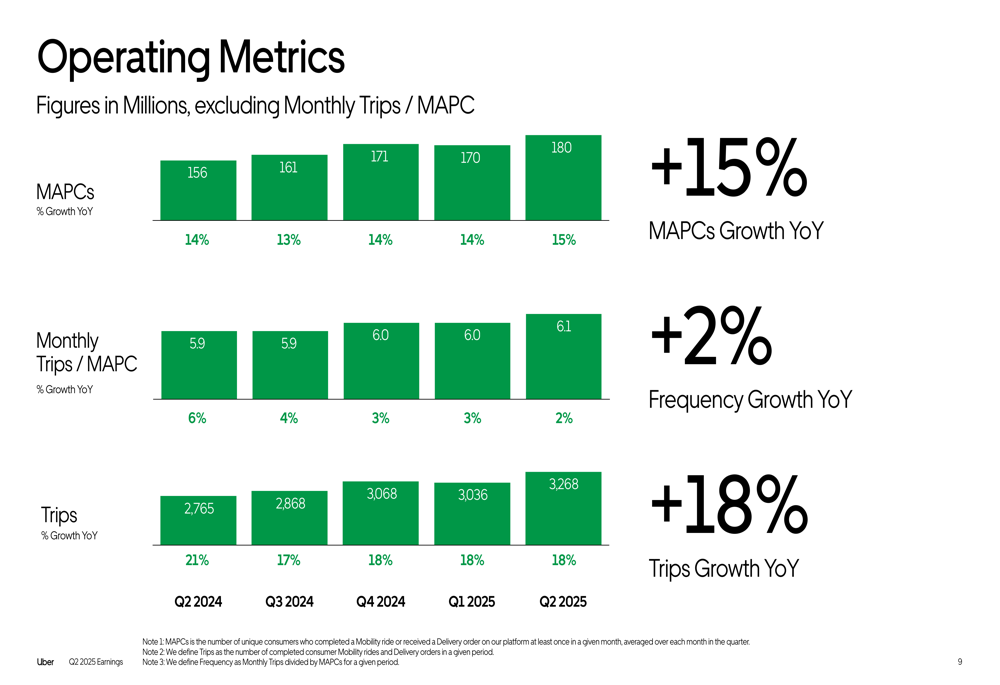
User engagement metrics were similarly robust, with Monthly Active Platform Consumers (MAPCs) growing 15% year-over-year to 180 million. Monthly trips per MAPC increased 2% to 6.1, while total trips grew 18% to 3.27 billion.
The company’s operating metrics are visualized in this chart:
Segment Analysis
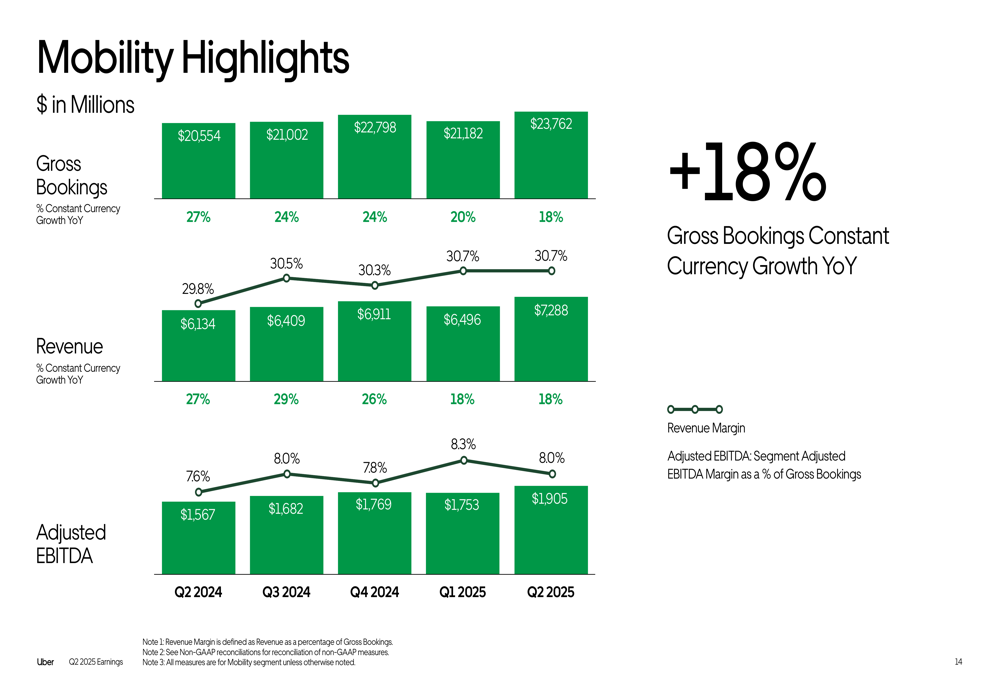
Uber’s Mobility segment, which includes its ride-hailing business, posted Gross Bookings of $23.76 billion, up 18% year-over-year. Revenue for the segment reached $7.29 billion, also up 18% in constant currency. Segment Adjusted EBITDA was $1.91 billion.
The Mobility segment performance is illustrated here:
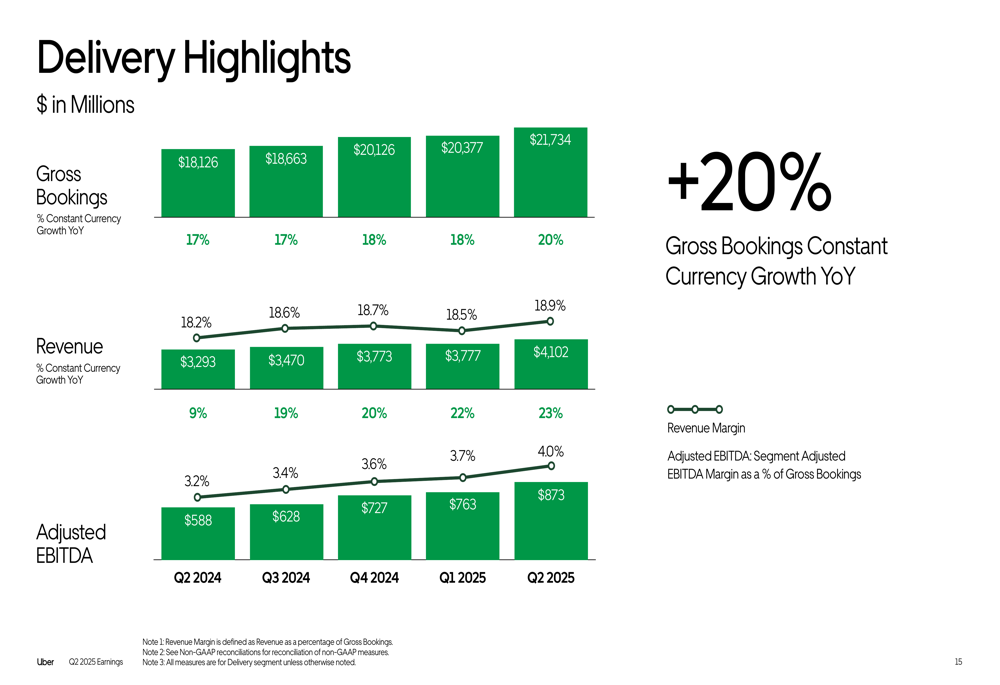
The Delivery segment continued its strong growth trajectory with Gross Bookings of $21.73 billion, increasing 20% year-over-year. Revenue grew even faster at 23% in constant currency to $4.10 billion. Segment Adjusted EBITDA reached $873 million, showing substantial profitability improvement.
The Delivery segment’s financial performance is shown in this chart:
Uber’s smaller Freight segment generated $1.26 billion in revenue, relatively flat compared to Q2 2024. However, the segment’s Adjusted EBITDA loss narrowed to $6 million from $12 million a year earlier, demonstrating progress toward profitability.
Strategic Initiatives
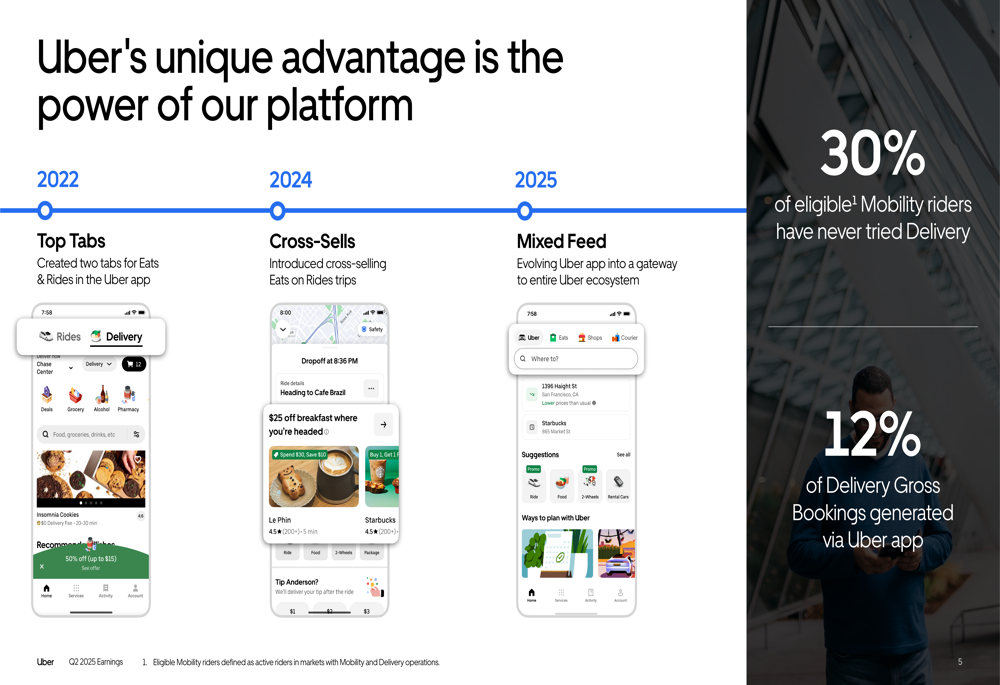
Uber highlighted its platform integration strategy as a key competitive advantage. The company has evolved from offering separate services to creating a unified ecosystem, with the app now featuring a mixed feed that serves as a gateway to all Uber services.
The presentation illustrated this evolution in the following slide:
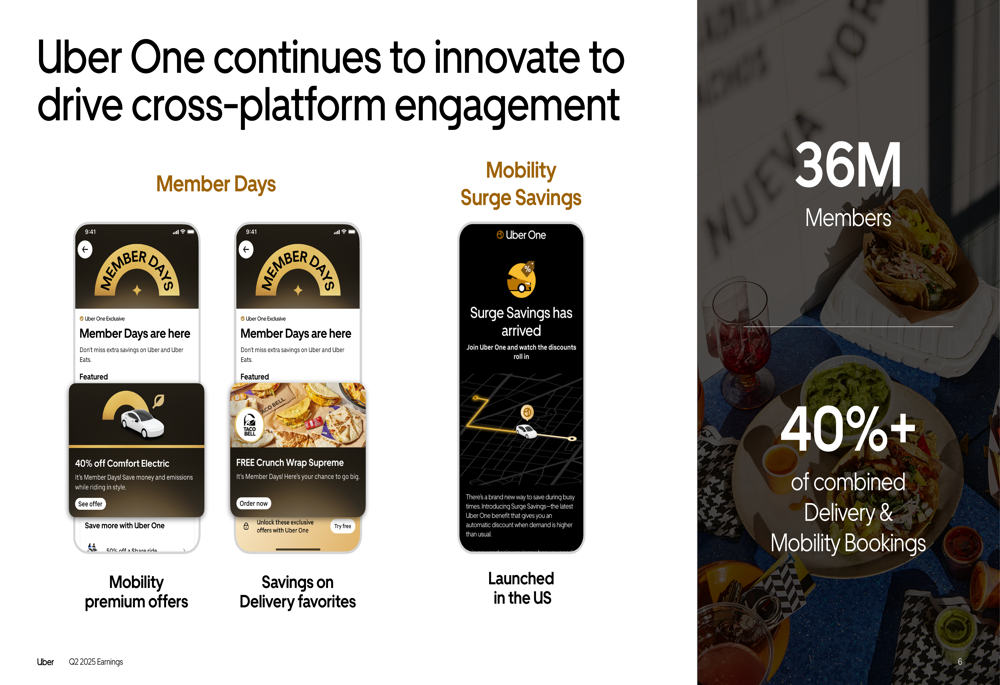
Uber One membership has become a significant driver of cross-platform engagement, with 36 million members generating over 40% of combined Delivery and Mobility Bookings. The company showcased "Member Days" with exclusive offers and introduced "Surge Savings" as a new benefit for U.S. members.
The Uber One membership benefits are highlighted in this slide:
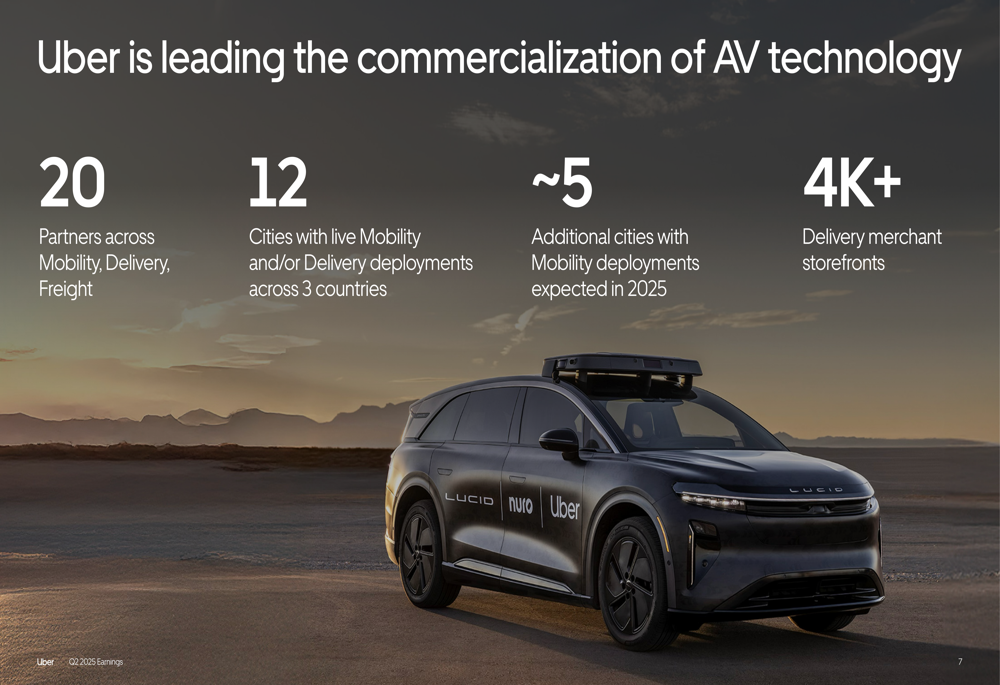
Autonomous vehicle technology commercialization is progressing rapidly, with Uber now having 20 partners across its Mobility, Delivery, and Freight segments. The company has live autonomous deployments in 12 cities across three countries and plans to expand to approximately five additional cities in 2025.
The autonomous vehicle strategy is illustrated here:
Financial Position and Cash Flow
Uber reported net income attributable to the company of $1.36 billion for Q2 2025, up from $1.02 billion in Q2 2024. The company’s balance sheet showed total assets of $55.98 billion as of June 30, 2025, compared to $51.24 billion at the end of 2024.
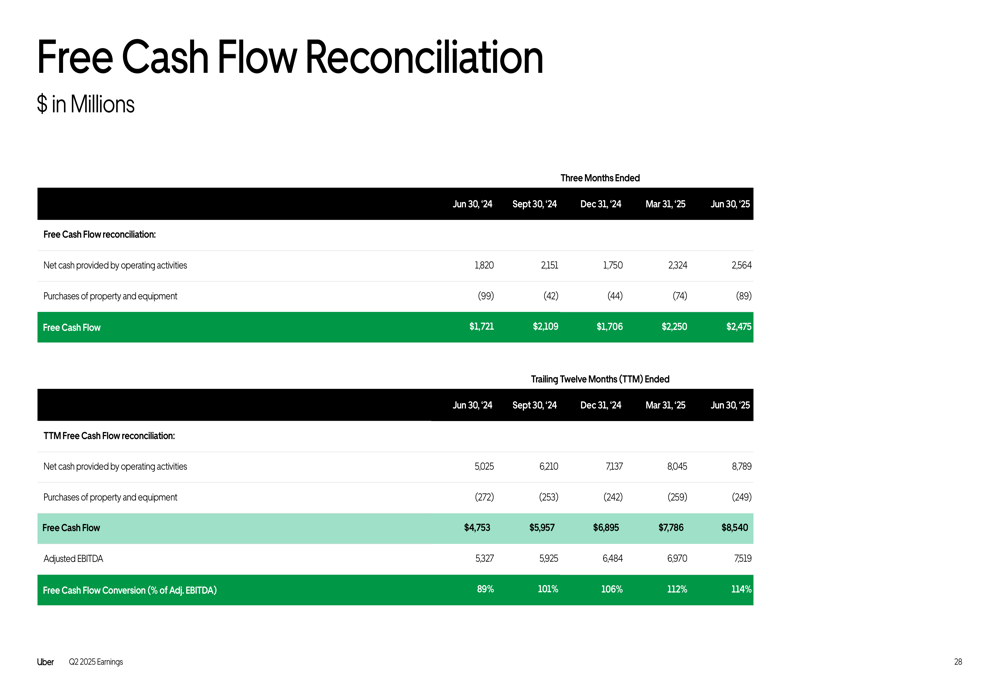
Free Cash Flow reached $2.48 billion in Q2 2025, with an impressive Free Cash Flow conversion rate of 114% of Adjusted EBITDA, up from 89% in Q2 2024. This demonstrates Uber’s improving ability to convert earnings into cash.
The Free Cash Flow performance is shown in this chart:
Forward-Looking Statements
While specific guidance figures weren’t provided in the presentation slides, Uber’s consistent growth across segments suggests continued momentum. The company’s investments in platform integration, Uber One membership, and autonomous vehicle technology position it for future growth.
The autonomous vehicle initiative appears to be a particular focus, with plans to expand Mobility deployments to approximately five additional cities in 2025. This aligns with the company’s long-term strategy of reducing driver costs and improving operational efficiency.
The company’s improving margins and strong cash flow conversion indicate that Uber continues to strengthen its financial position while investing in strategic growth initiatives, suggesting a balanced approach to growth and profitability.
Full presentation:
This article was generated with the support of AI and reviewed by an editor. For more information see our T&C.