Trump/Cook, Nissan weakness, more tariffs and gold - what’s moving markets

Introduction & Market Context
Valley National Bancorp (NASDAQ:VLY) released its first quarter 2025 earnings presentation on April 24, 2025, highlighting continued improvement in profitability metrics driven by net interest margin expansion for the fourth consecutive quarter. The bank reported GAAP net income of $106.1 million, up from $96.3 million in the same quarter last year, while maintaining its focus on balance sheet strength and deposit cost optimization.
The bank’s stock closed at $8.63 on April 23, 2025, showing a gain of 2.98% in the most recent trading session. Valley’s shares have traded between $6.47 and $11.10 over the past 52 weeks, indicating ongoing volatility in the regional banking sector.
Quarterly Performance Highlights
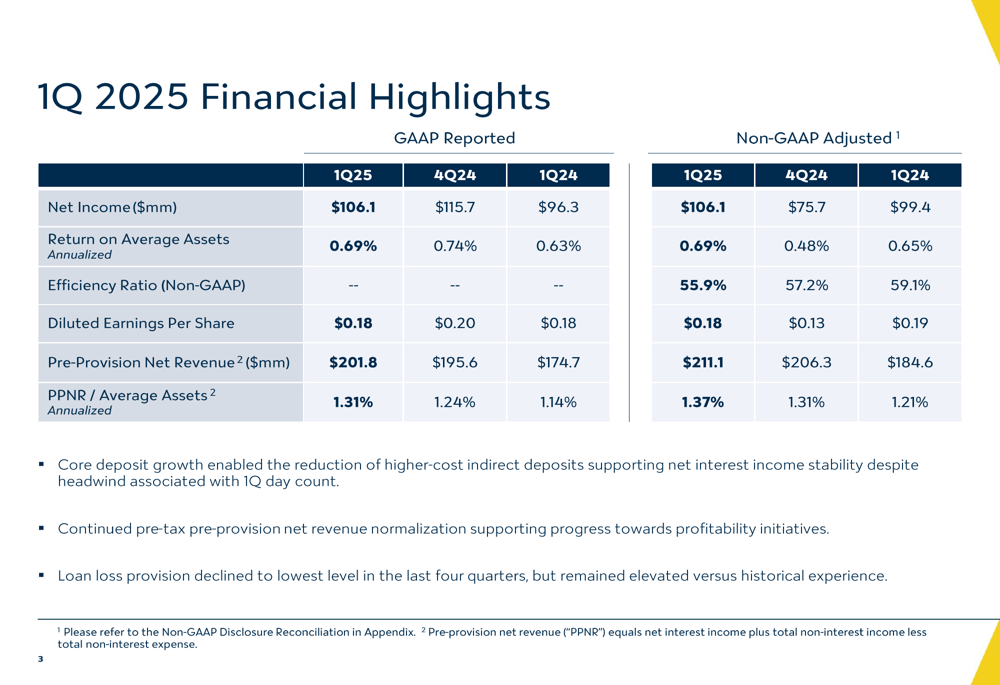
Valley National reported GAAP net income of $106.1 million for Q1 2025, compared to $115.7 million in Q4 2024 and $96.3 million in Q1 2024. Diluted earnings per share remained steady year-over-year at $0.18, while return on average assets improved to 0.69% from 0.63% in the prior-year quarter.
The bank’s efficiency ratio showed notable improvement, decreasing to 55.9% from 59.1% a year earlier, reflecting effective expense management. Pre-provision net revenue (PPNR) increased to $201.8 million from $174.7 million in Q1 2024, with PPNR to average assets rising to 1.31% from 1.14%.
As shown in the following financial highlights chart, both GAAP and non-GAAP metrics demonstrate the bank’s improving performance trajectory:
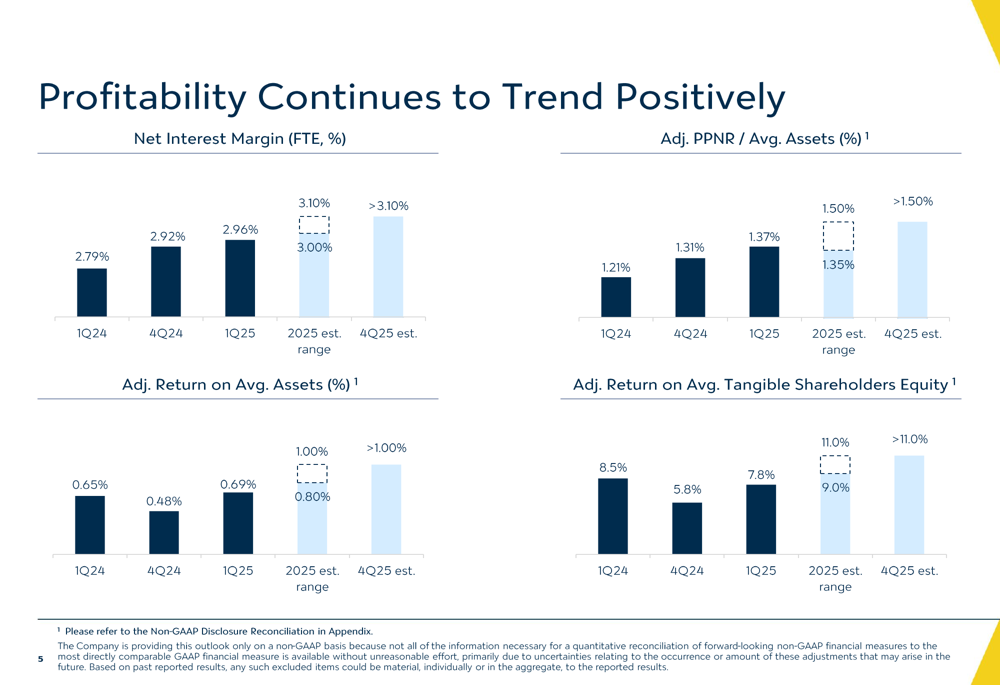
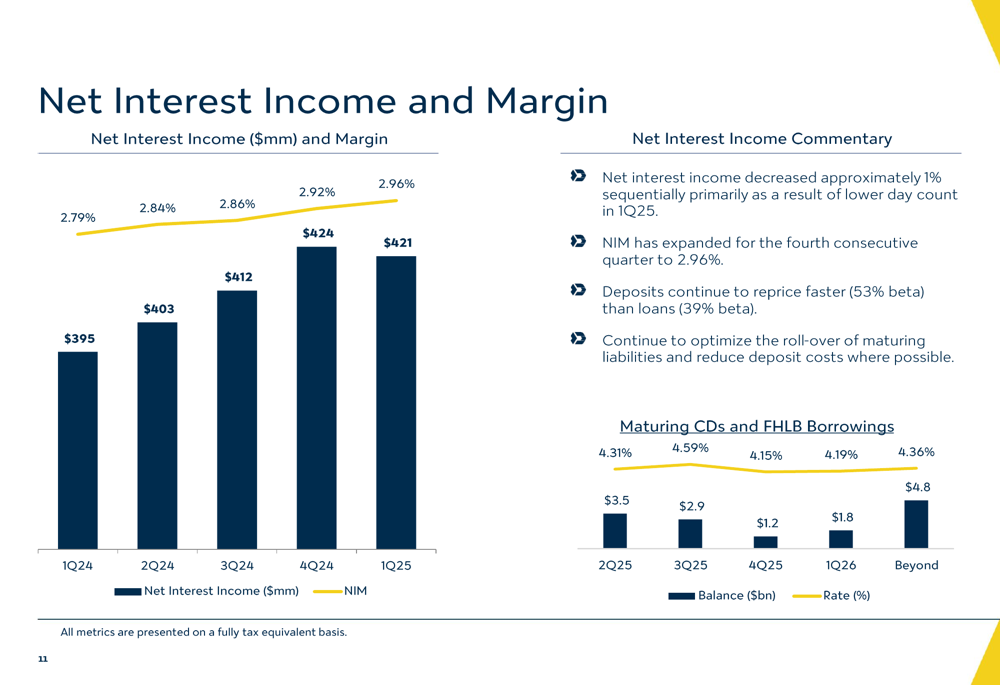
A key driver of Valley’s improved performance has been the continued expansion of its net interest margin (NIM), which reached 2.96% in Q1 2025, up from 2.79% in Q1 2024 and 2.92% in the previous quarter. This marks the fourth consecutive quarter of NIM expansion, as deposits continue to reprice faster than loans in the current rate environment.
The following chart illustrates Valley’s positive profitability trends, including projections for continued improvement through the end of 2025:
Balance Sheet Strength & Asset Quality
Valley National has made significant progress in strengthening its balance sheet, with multiple key metrics showing improvement. The bank’s Common Equity Tier 1 (CET1) ratio stood at 10.80% as of March 31, 2025, up substantially from 9.34% a year earlier. The loan-to-deposit ratio improved to 97.4% from 101.7% in the prior-year period, reflecting the bank’s focus on deposit growth and liability management.
The following chart demonstrates Valley’s balance sheet strengthening across multiple metrics:
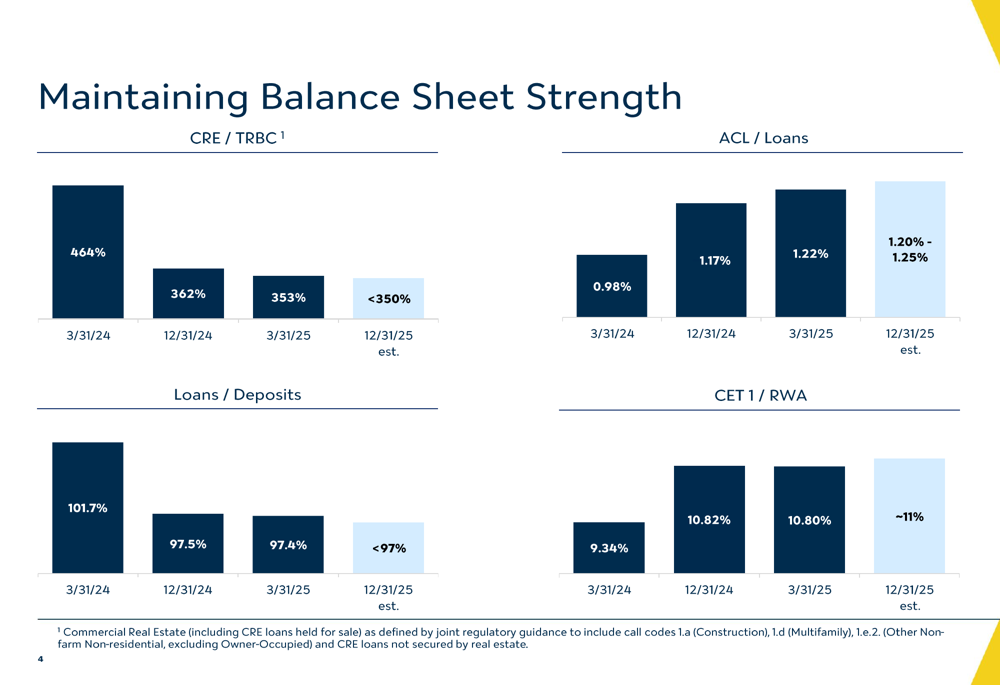
Asset quality remained stable, with non-accrual loans representing 0.71% of total loans, a slight improvement from 0.74% in the previous quarter. The allowance for credit losses (ACL) to total loans ratio increased to 1.22%, up from 0.98% a year earlier, indicating a more conservative approach to potential credit risks.
The bank’s loan portfolio remained diversified, with Commercial and Industrial (C&I) loans comprising 33% of the total, Commercial Real Estate (CRE) at 42%, and residential and consumer loans making up the remaining 25%. This diversification helps mitigate concentration risks in any single sector.
Strategic Initiatives
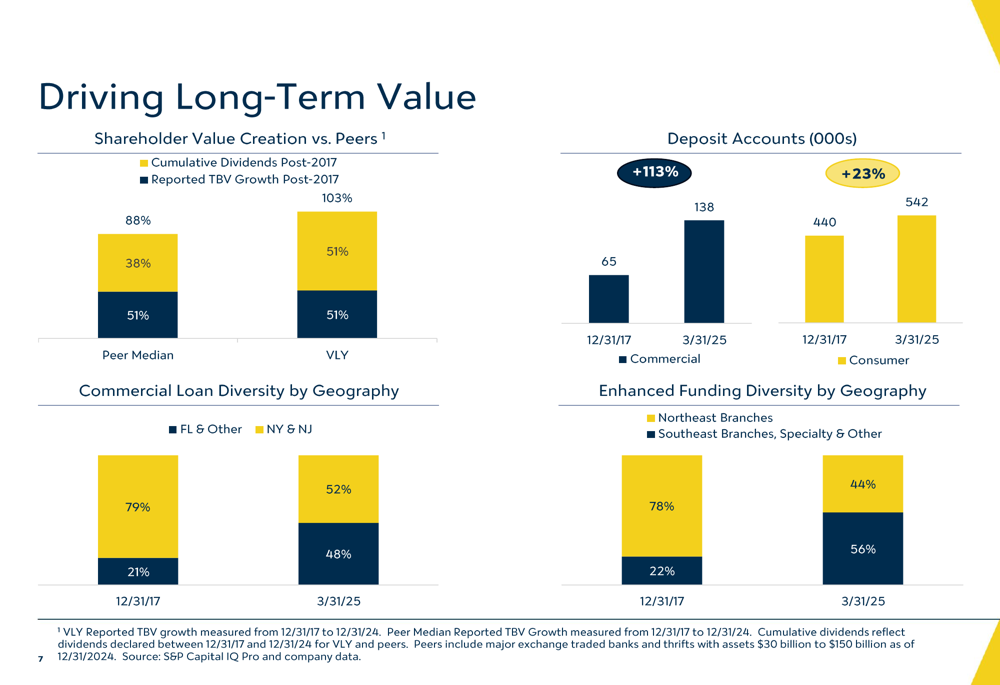
Valley National has been actively diversifying its deposit base and funding sources, which has contributed to its improved financial performance. The bank has grown its commercial deposit accounts by 113% since 2017, while consumer accounts have increased by 23% over the same period.
The bank’s deposit strategy has focused on reducing reliance on higher-cost indirect deposits while growing core deposits. As illustrated in the following chart, Valley has successfully lowered its deposit costs as the Federal Reserve has begun cutting interest rates:
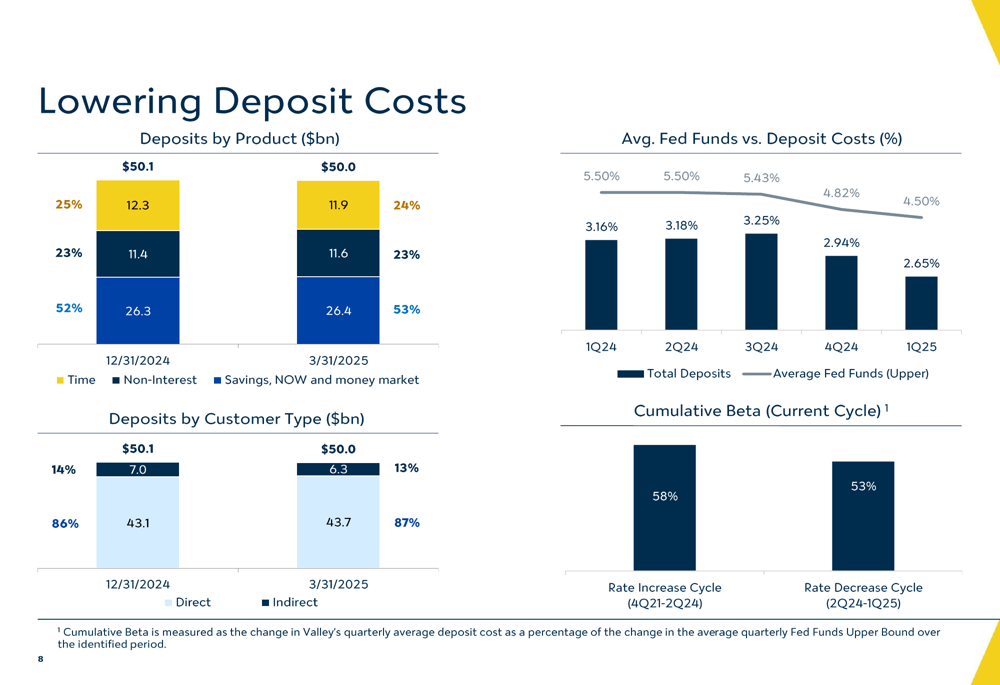
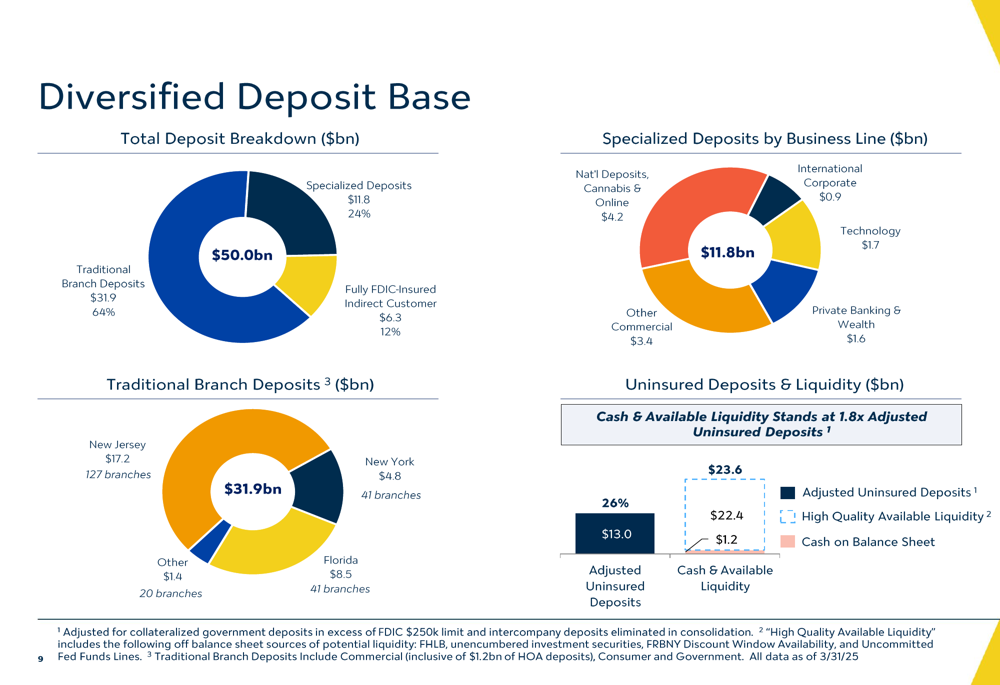
Valley’s deposit base has become increasingly diversified, with traditional branch deposits accounting for 64% of the total, specialized deposits at 24%, and fully FDIC-insured indirect customers representing 12%. This diversification helps provide stability to the bank’s funding sources.
The following chart provides a detailed breakdown of Valley’s deposit base:
The bank has also made significant progress in diversifying its commercial loan portfolio geographically, shifting from a heavy concentration in New York and New Jersey to a more balanced approach that includes Florida and other markets. Similarly, its funding sources have become more geographically diverse, with Southeast branches, specialty deposits, and other sources now representing 56% of funding compared to just 22% in 2017.
As shown in the following chart, these strategic initiatives have helped Valley outperform its peers in terms of shareholder value creation:
Forward-Looking Statements
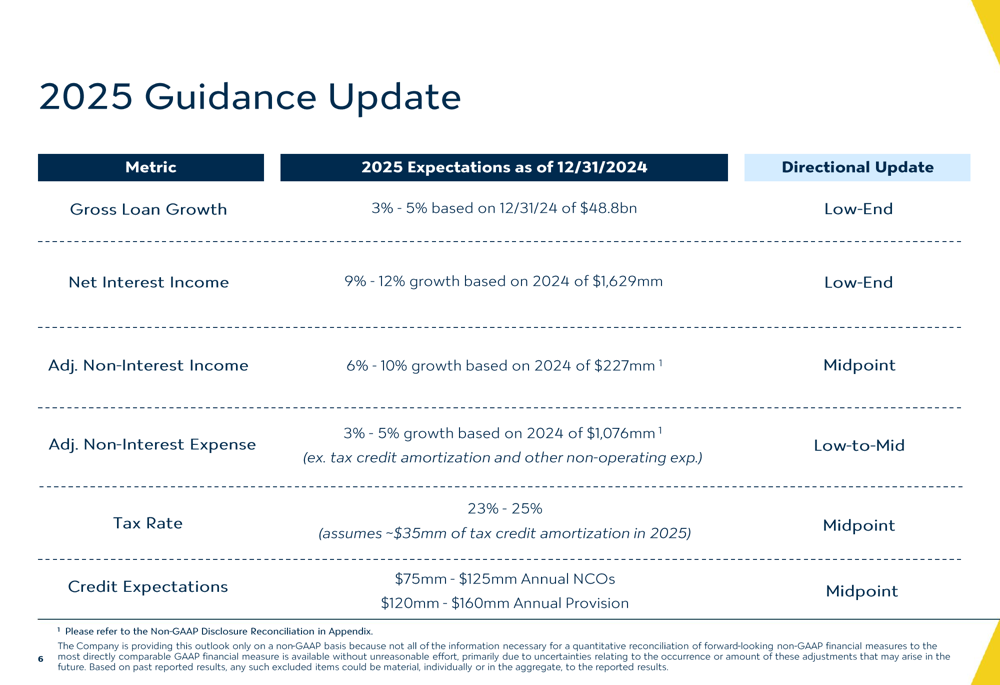
Valley National updated its 2025 guidance, indicating that it expects to achieve the lower end of its previously provided ranges for gross loan growth (3-5%) and net interest income growth (9-12%). The bank maintains its mid-point expectations for adjusted non-interest income growth (6-10%), credit metrics, and tax rate, while anticipating low-to-mid range growth in adjusted non-interest expenses (3-5%).
The following chart details Valley’s updated 2025 guidance:
Management expects net interest margin to continue expanding, potentially exceeding 3.10% by the fourth quarter of 2025. The bank anticipates further improvements in profitability metrics, with adjusted return on average assets potentially exceeding 1.00% and adjusted return on average tangible shareholders’ equity exceeding 11.0% by Q4 2025.
The bank’s net interest income and margin trends are illustrated in the following chart, showing the consistent improvement in NIM over the past five quarters:
Valley National’s strategic focus remains on optimizing its balance sheet, managing deposit costs, and driving long-term shareholder value through disciplined growth and operational efficiency. With its strengthened capital position and improving profitability metrics, the bank appears well-positioned to navigate the evolving interest rate environment and competitive landscape in the regional banking sector.
Full presentation:
This article was generated with the support of AI and reviewed by an editor. For more information see our T&C.