CTAs keep buying Treasuries, gold longs face stop-loss risk: BofA

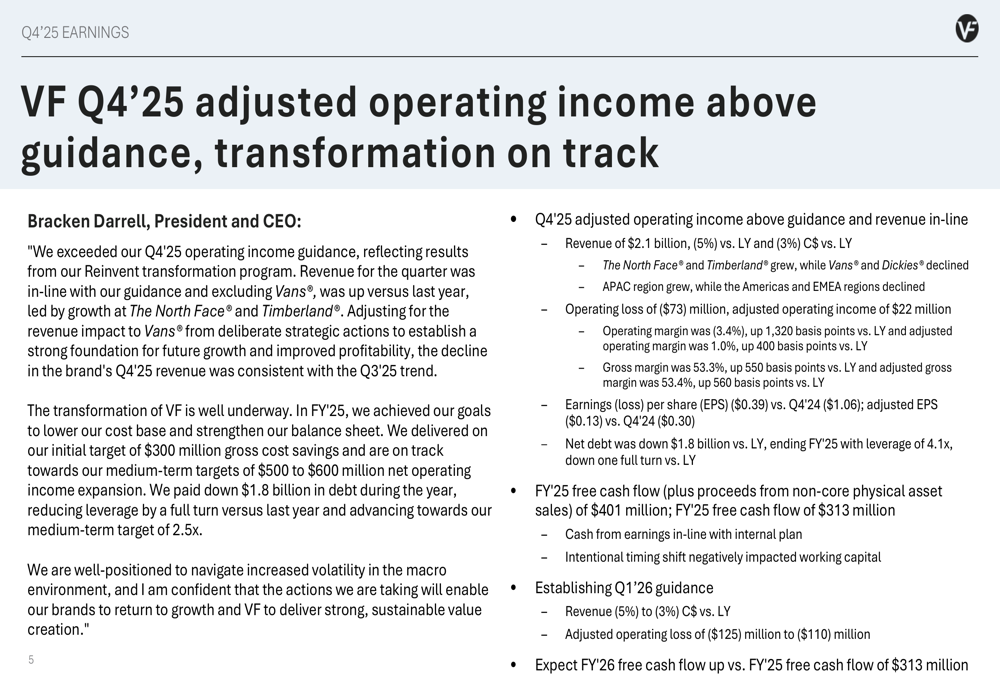
VF Corporation (NYSE:VFC) presented its fourth quarter fiscal year 2025 results on May 21, showing progress on its strategic transformation initiatives despite ongoing revenue challenges. The apparel and footwear conglomerate reported revenue declines but beat its adjusted operating income guidance, while making significant strides in debt reduction and cost-saving measures.
Quarterly Performance Highlights
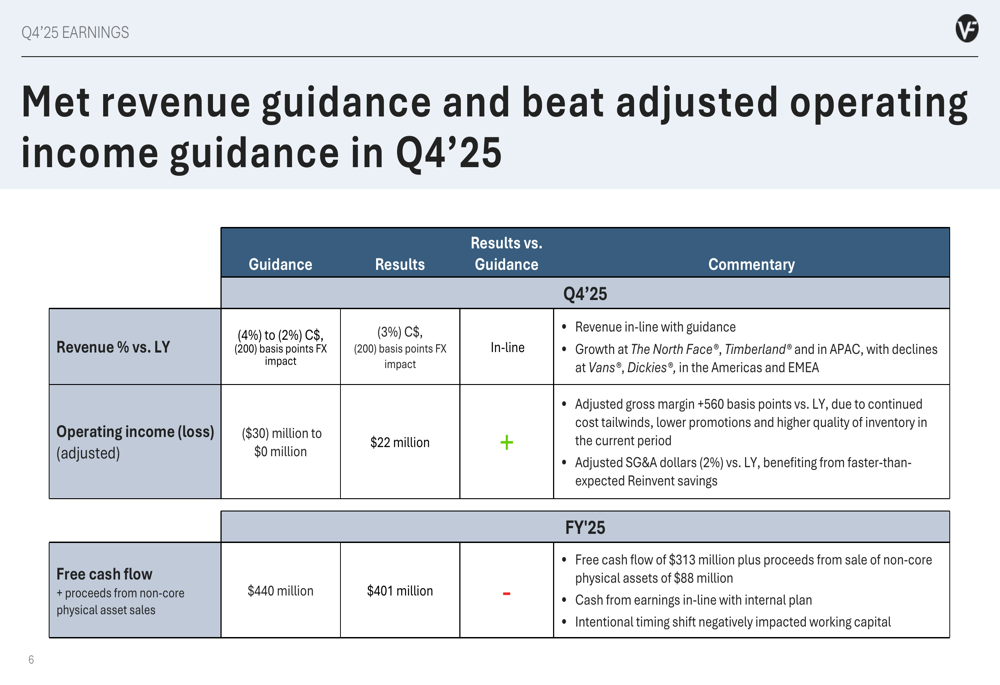
VF Corp reported Q4 revenue of $2.1 billion, down 5% year-over-year and 3% in constant currency, which was in line with the company’s guidance. Despite the revenue decline, adjusted operating income reached $22 million with a 1.0% adjusted operating margin, exceeding the company’s previous guidance.
"We delivered adjusted operating income above guidance and revenue in line with guidance," noted President and CEO Bracken Darrell in the presentation. The company highlighted a 560 basis point improvement in adjusted gross margin compared to the previous year.
As shown in the following performance summary:
The company’s performance against its previously issued guidance demonstrates that while revenue challenges persist, operational improvements are taking hold:
Brand Performance Analysis
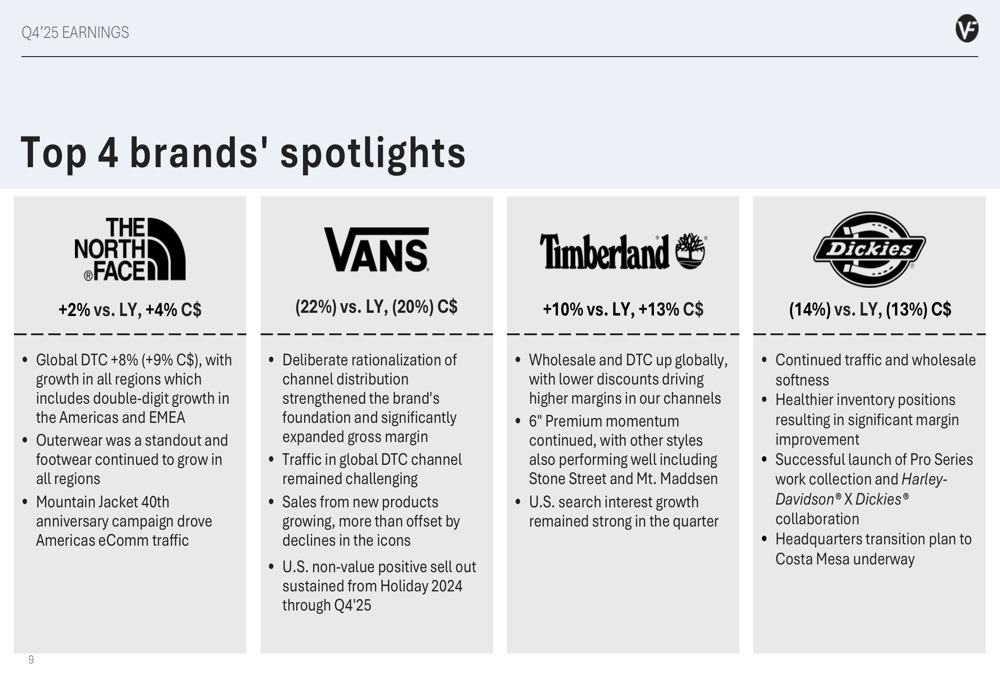
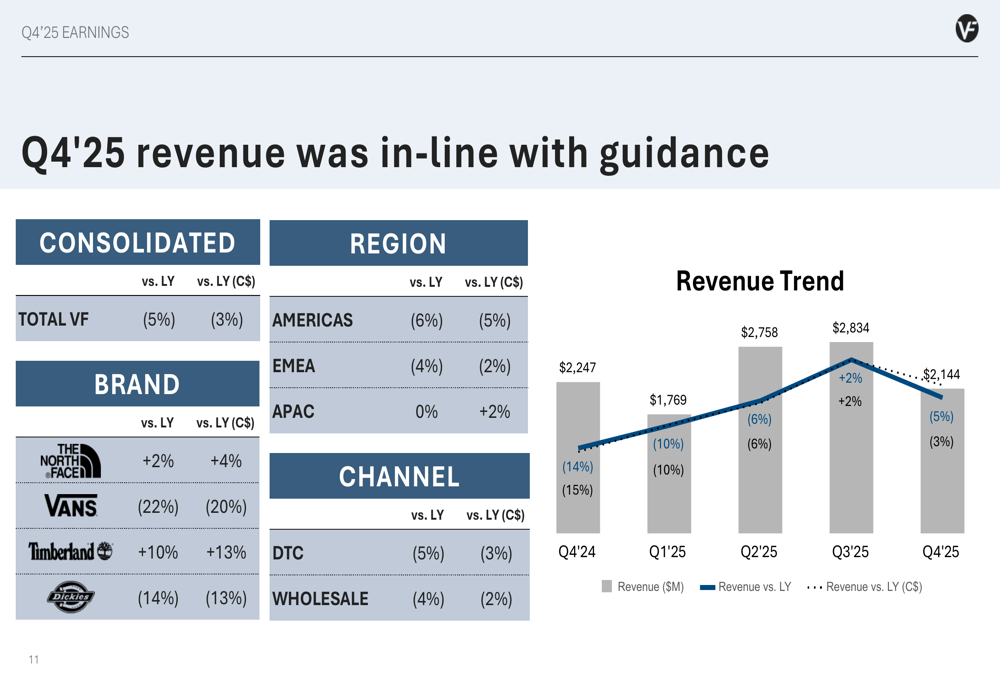
VF Corp’s brand portfolio showed divergent performance in the quarter. The outdoor segment outperformed, with The North Face growing 2% (4% in constant currency) and Timberland posting impressive 10% growth (13% in constant currency). However, Vans continued to struggle with a 22% decline (20% in constant currency), while Dickies fell 14% (13% in constant currency).
The company’s brand performance breakdown reveals the stark contrast between its growing and declining brands:
Regional performance was similarly mixed, with the Americas down 6%, EMEA (Europe, Middle East, and Africa) down 4%, while APAC (Asia-Pacific) remained flat. The direct-to-consumer channel declined 5%, while wholesale was down 4%.
The following chart illustrates the revenue performance across regions and channels:
Strategic Initiatives Progress
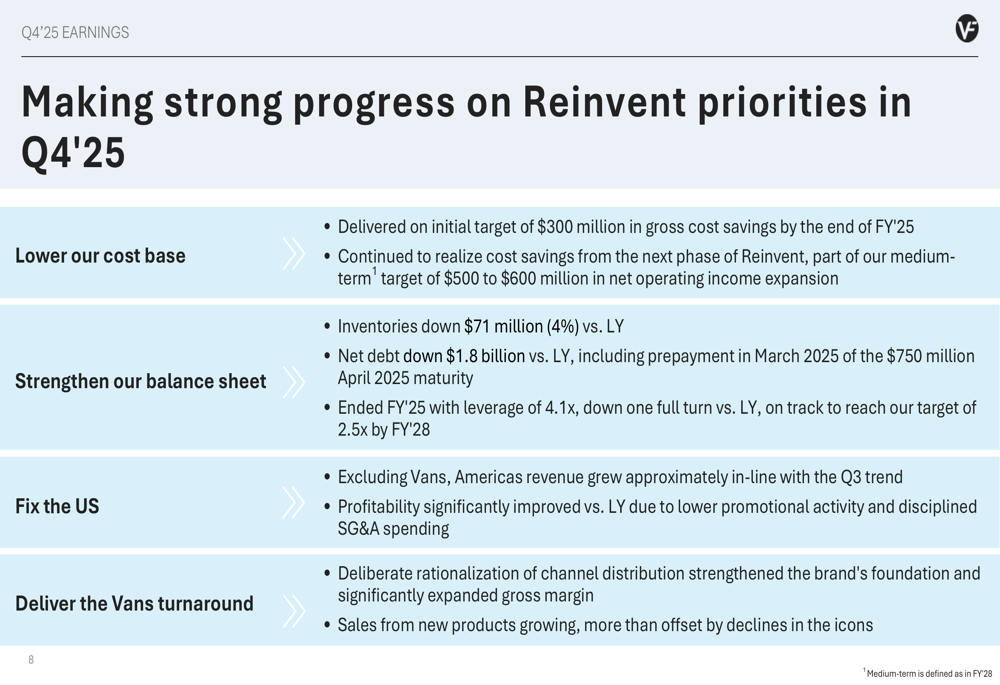
VF Corp continues to make progress on its "Reinvent" transformation strategy, which focuses on four key priorities: lowering the cost base, strengthening the balance sheet, fixing the US business, and delivering a Vans turnaround.
The company reported delivering initial cost savings of $300 million by FY’25 and is progressing toward a medium-term target of $500-600 million. The US business showed stabilization with Americas revenue in line with Q3 and improved profitability, while the Vans turnaround efforts included strengthened channel distribution, expanded gross margin, and growth in new product sales.
The following slide details the progress on these strategic initiatives:
Balance Sheet Improvements
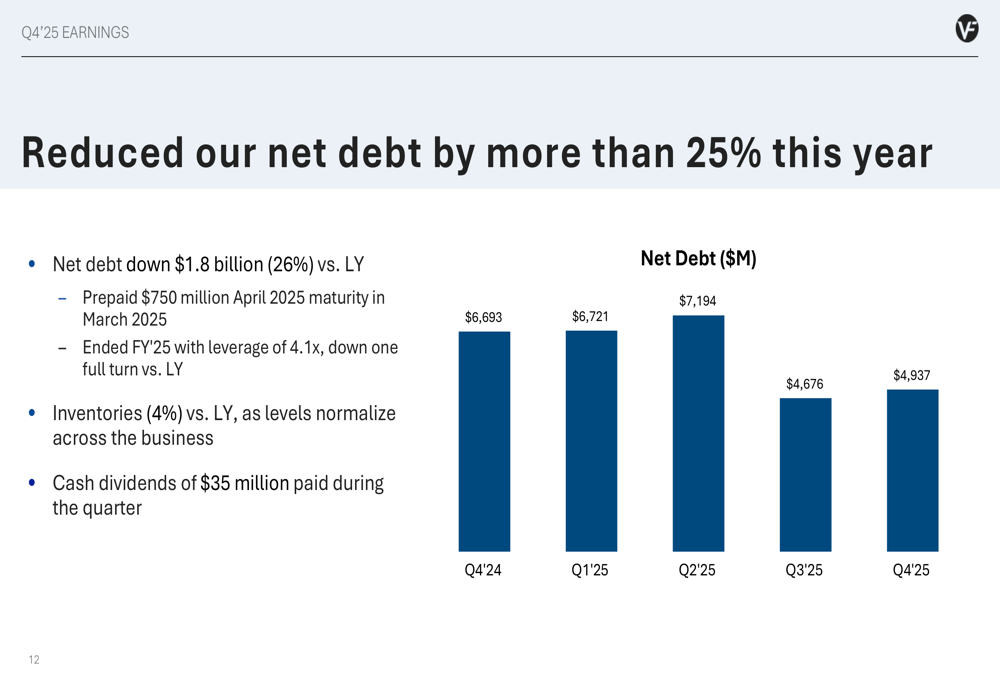
One of the most significant achievements highlighted in the presentation was VF Corp’s substantial debt reduction. Net debt decreased by $1.8 billion or 26% compared to the previous year, bringing the company’s leverage ratio to 4.1x at the end of FY’25. Management indicated they remain on track to reach their target leverage of 2.5x by FY’28.
Inventory management also showed improvement, with inventories down $71 million or 4% year-over-year, reflecting the company’s efforts to optimize its supply chain and working capital.
The following chart illustrates the company’s net debt reduction progress:
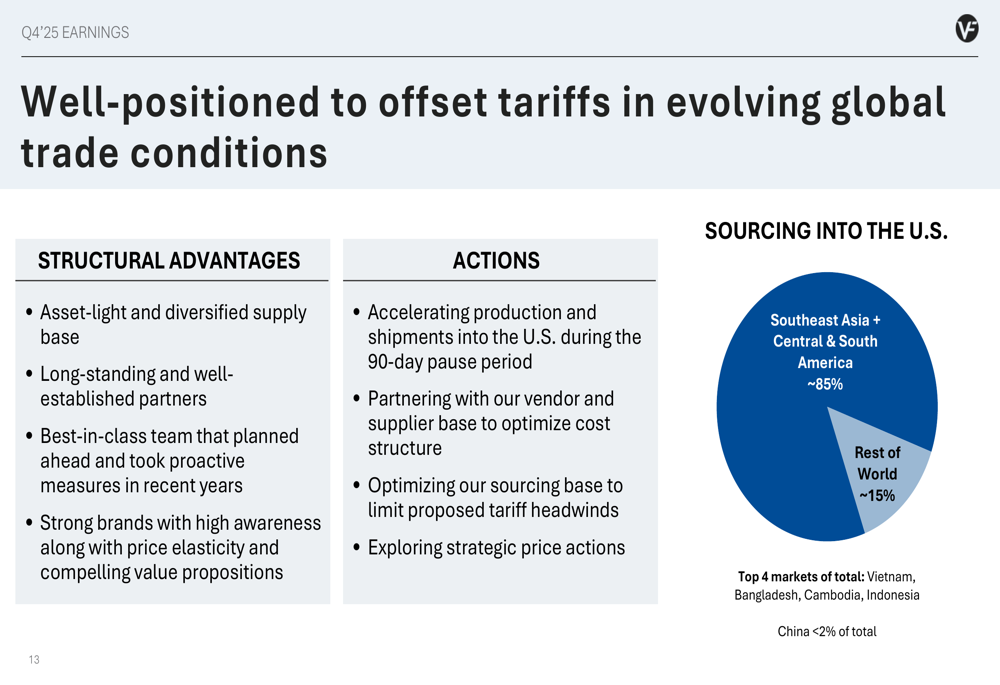
VF Corp also highlighted its tariff mitigation strategy in response to evolving global trade conditions. The company emphasized its diversified supply base, with approximately 85% of its sourcing into the U.S. coming from Southeast Asia, Central America, and South America.
As shown in the following supply chain strategy slide:
Forward Guidance & Outlook
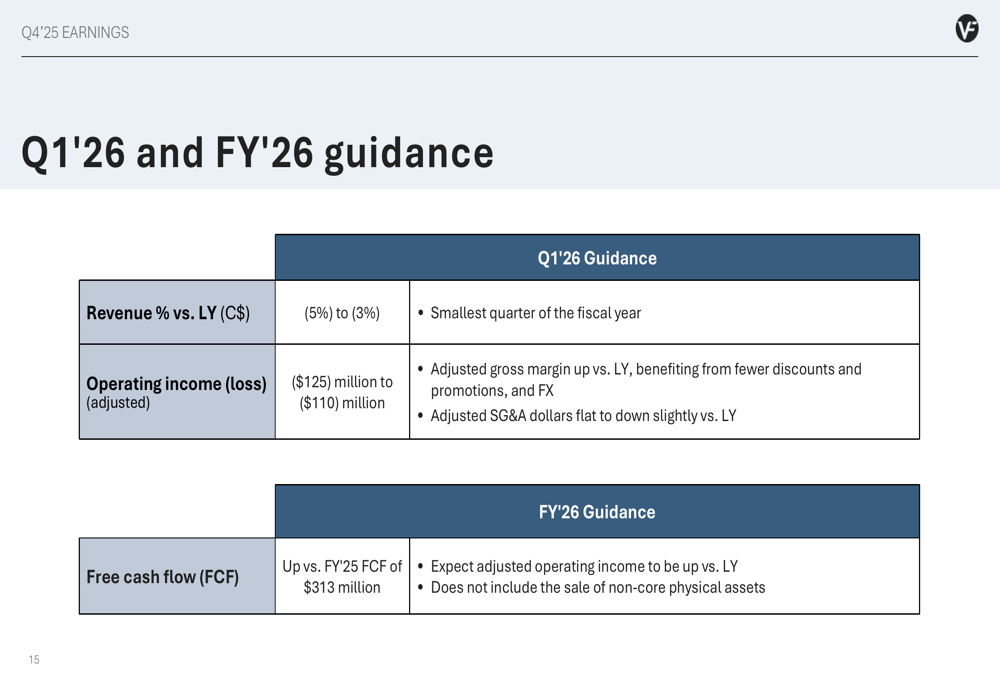
Looking ahead, VF Corp provided guidance for the first quarter of fiscal year 2026, projecting revenue to decline between 5% and 3% compared to the previous year. The company expects an adjusted operating loss of $125 million to $110 million for Q1’26.
For the full fiscal year 2026, VF Corp anticipates free cash flow to increase compared to FY’25’s $313 million, suggesting continued improvement in operational efficiency and working capital management despite ongoing revenue challenges.
The company’s guidance is summarized in the following slide:
VF Corp’s stock closed at $14.43 on May 20, 2025, but was trading down 2.84% in pre-market activity following the earnings presentation, indicating that investors may remain cautious about the company’s turnaround timeline despite the progress on strategic initiatives.
The company faces continued challenges in revitalizing its Vans brand and navigating a difficult consumer spending environment, but its debt reduction progress and cost-cutting measures provide some financial flexibility as it works to return to sustainable growth.
Full presentation:
This article was generated with the support of AI and reviewed by an editor. For more information see our T&C.