Trump announces 100% chip tariff as Apple ups U.S. investment

Introduction & Market Context
Visa Inc (NYSE:V) presented its fiscal third quarter 2025 financial results on July 29, 2025, revealing strong growth across key metrics despite macroeconomic uncertainties. The payment processing giant reported a 14% year-over-year increase in net revenue, reaching $10.2 billion, while non-GAAP earnings per share surged 23% to $2.98.
The company’s stock responded with mixed signals, declining 1.18% during regular trading to close at $355.47, but recovering 0.29% in after-hours trading to $356.49. This performance comes against the backdrop of Visa’s strong second quarter, which saw 9% revenue growth and EPS of $2.76.
Quarterly Performance Highlights
Visa’s third quarter results demonstrated acceleration across multiple business segments compared to the previous quarter. The company reported GAAP net income of $5.3 billion, up 8% year-over-year, while non-GAAP net income reached $5.8 billion, representing a 19% increase.
As shown in the following comprehensive summary of Visa’s Q3 2025 financial performance:
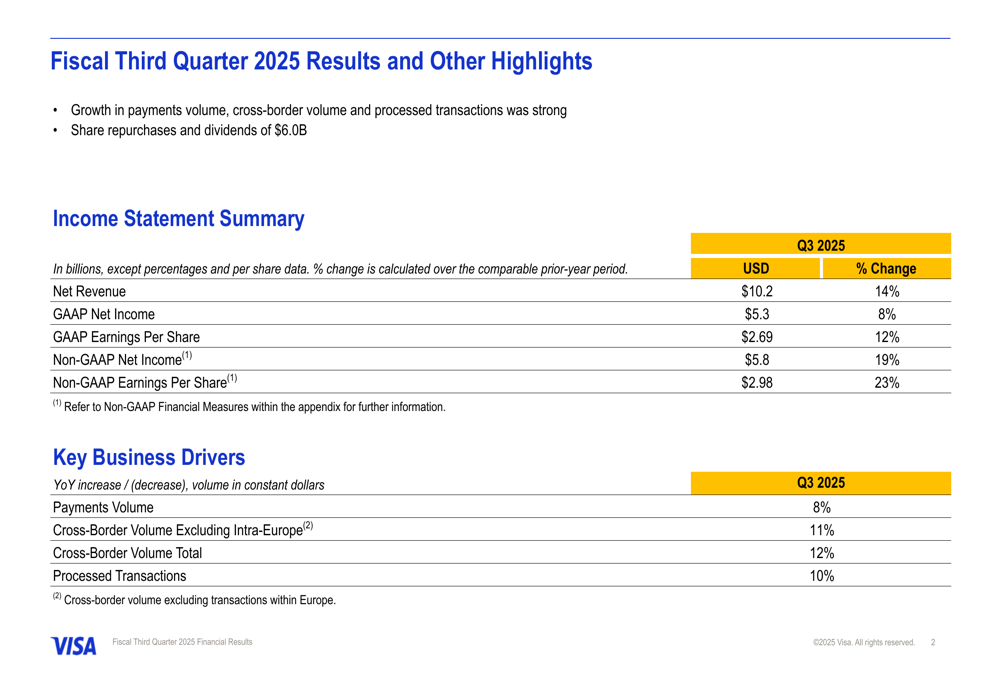
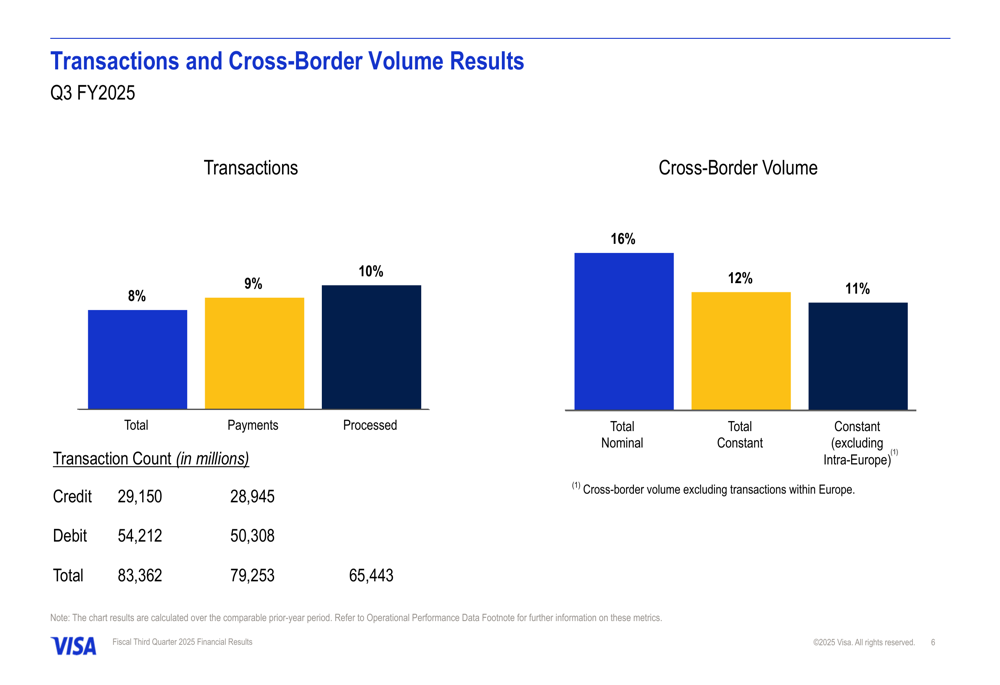
Key business drivers showed robust growth, with payments volume increasing 8%, cross-border volume (excluding intra-Europe) rising 11%, and processed transactions growing 10% compared to the same period last year. These metrics indicate continued strong demand for Visa’s payment processing services globally.
The company’s card base continued to expand, reaching 4.8 billion cards worldwide, a 7% increase from the previous year. Credit cards grew 8% to 1.4 billion, while debit cards increased 6% to 3.4 billion.
Detailed Financial Analysis
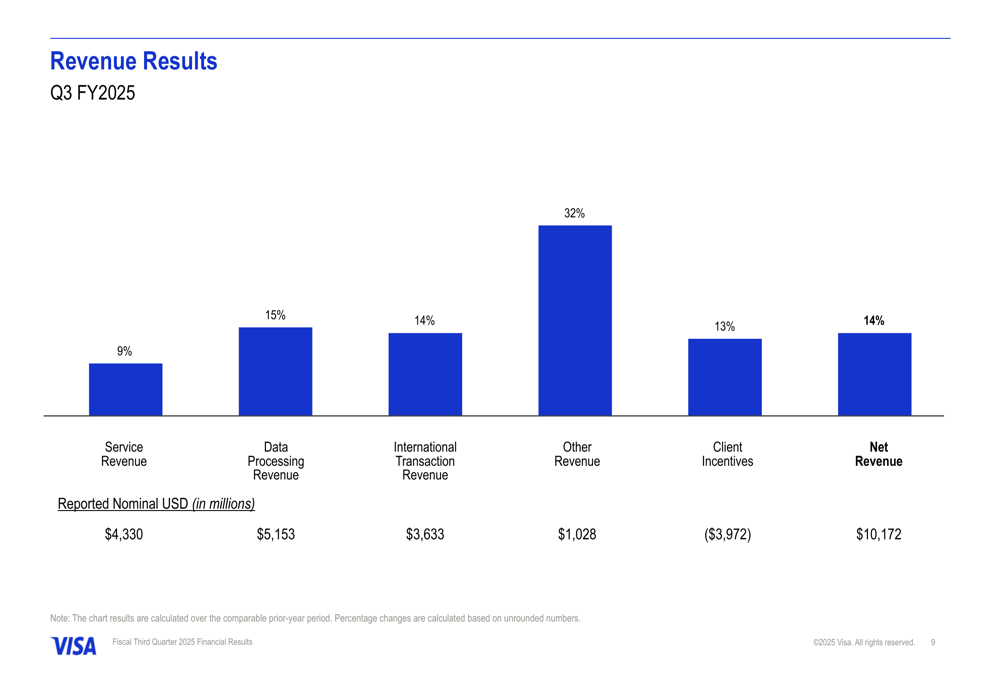
Visa’s revenue growth was broad-based across all major categories. Data processing revenue led with 15% growth, followed by international transaction revenue at 14%. Other revenue showed particularly strong performance with 32% growth, while service revenue increased by 9%.
The revenue breakdown by category is illustrated in the following chart:
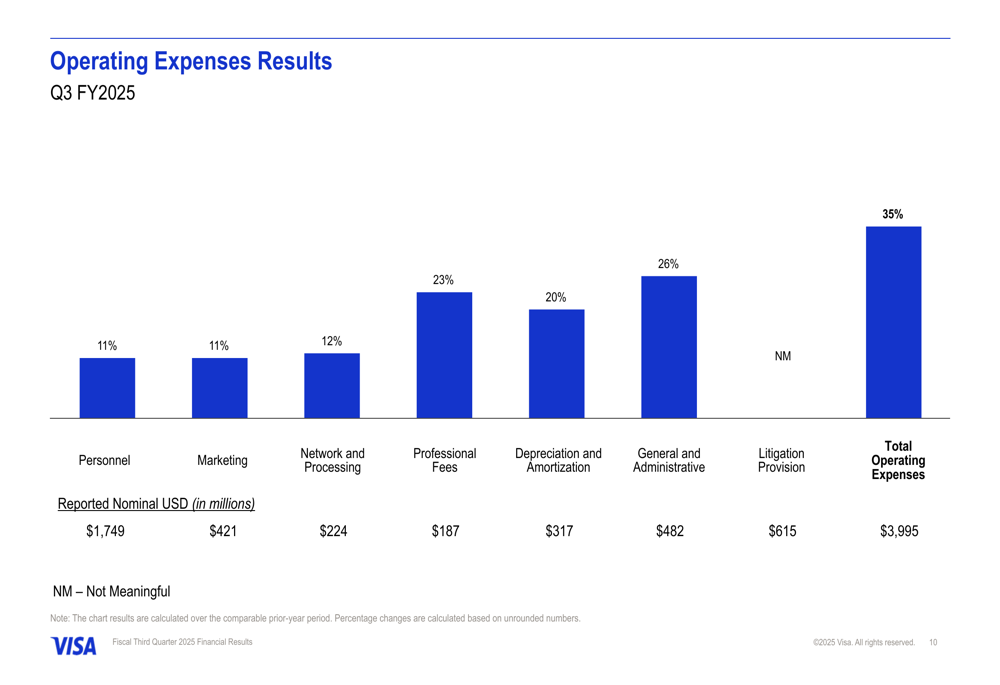
On the expense side, Visa reported a 35% increase in total operating expenses on a GAAP basis, reaching $3,995 million. However, on a non-GAAP basis, operating expenses grew by a more modest 13%. The significant difference was largely attributable to a $615 million litigation provision.
General and administrative expenses increased 26%, while professional fees rose 23%. Personnel costs, which represent the largest expense category at $1,749 million, grew by 11% year-over-year.
The detailed breakdown of operating expenses is shown here:
Cross-border volume, a key driver of Visa’s high-margin international transaction revenue, showed strong growth. Total (EPA:TTEF) cross-border volume increased 12% on a constant currency basis, while transactions grew at a healthy pace across all categories.
The following chart illustrates the transaction and cross-border volume results:
Strategic Initiatives & Capital Allocation
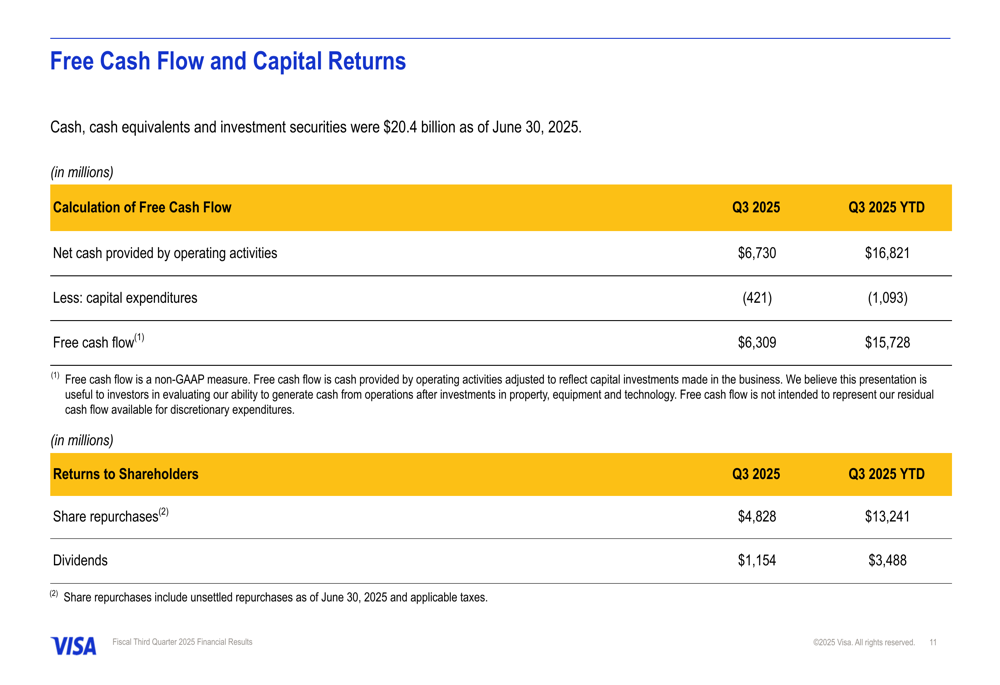
Visa maintained a strong cash position, with cash, cash equivalents, and investment securities totaling $20.4 billion as of June 30, 2025. The company generated $6.73 billion in operating cash flow during the quarter, resulting in free cash flow of $6.31 billion after $421 million in capital expenditures.
The company continued its robust capital return program, distributing $6.0 billion to shareholders through $4.83 billion in share repurchases and $1.15 billion in dividends during the quarter.
The following chart details Visa’s free cash flow and capital returns:
In May 2025, Visa issued fixed-rate senior notes in an aggregate principal amount of €3.5 billion with maturities ranging between 3 and 19 years, and interest rates from 2.250% to 3.875%. The company indicated it intends to use the proceeds for general corporate purposes, including potential refinancing of existing debt.
Forward-Looking Statements
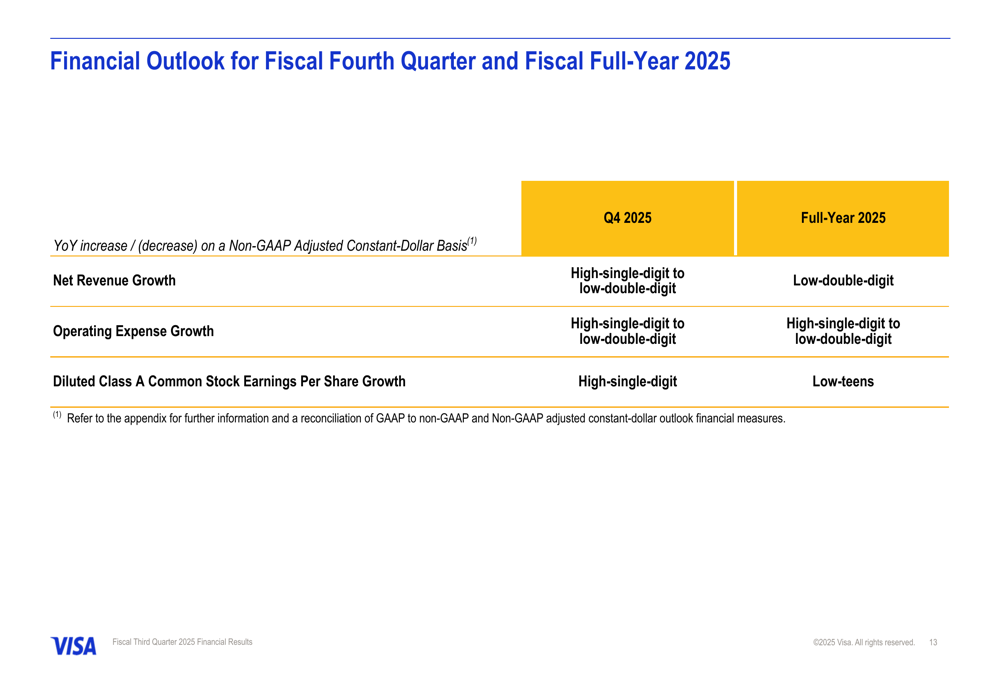
Looking ahead, Visa provided guidance for both the fiscal fourth quarter and full-year 2025. The company expects net revenue growth in the high-single-digit to low-double-digit range for Q4, and low-double-digit growth for the full fiscal year on a non-GAAP adjusted constant-dollar basis.
Operating expense growth is projected in the high-single-digit to low-double-digit range for both Q4 and the full year. Diluted earnings per share growth is expected to be in the high-single-digit range for Q4 and low-teens for the full fiscal year.
The detailed financial outlook is presented in the following chart:
This guidance represents an acceleration from the company’s Q2 2025 performance, where revenue grew 9% year-over-year. The projected EPS growth in the low-teens for the full year aligns with the company’s long-term growth trajectory, despite ongoing macroeconomic uncertainties.
Visa’s Q3 2025 presentation demonstrates the company’s continued ability to drive growth across its global payments network, leveraging its strong market position to generate substantial cash flow and returns for shareholders. While operating expenses have increased, particularly due to litigation provisions, the underlying business fundamentals remain robust with double-digit growth across key metrics.
Full presentation:
This article was generated with the support of AI and reviewed by an editor. For more information see our T&C.