BofA sees higher gold prices, likely to hit $5,000/oz in 2026

Introduction & Market Context
Vulcan Materials Company (NYSE:VMC) released its second quarter 2025 supplemental presentation on July 31, highlighting continued margin expansion and pricing strength despite modest volume challenges. The construction materials leader reported a 9% increase in adjusted EBITDA to $660 million, even as aggregates shipment volumes declined slightly.
The company’s stock traded down 4.09% in pre-market trading to $261.62, suggesting investors may have had even higher expectations despite the solid performance. This reaction comes after VMC’s shares had approached their 52-week high of $298.31 in recent weeks.
Quarterly Performance Highlights
Vulcan reported total revenues of $2.102 billion for Q2 2025, representing a 4% year-over-year increase. The company’s aggregates segment demonstrated strong pricing power with an 8% mix-adjusted price increase, which more than offset a 1% volume decline.
As shown in the following quarterly highlights:
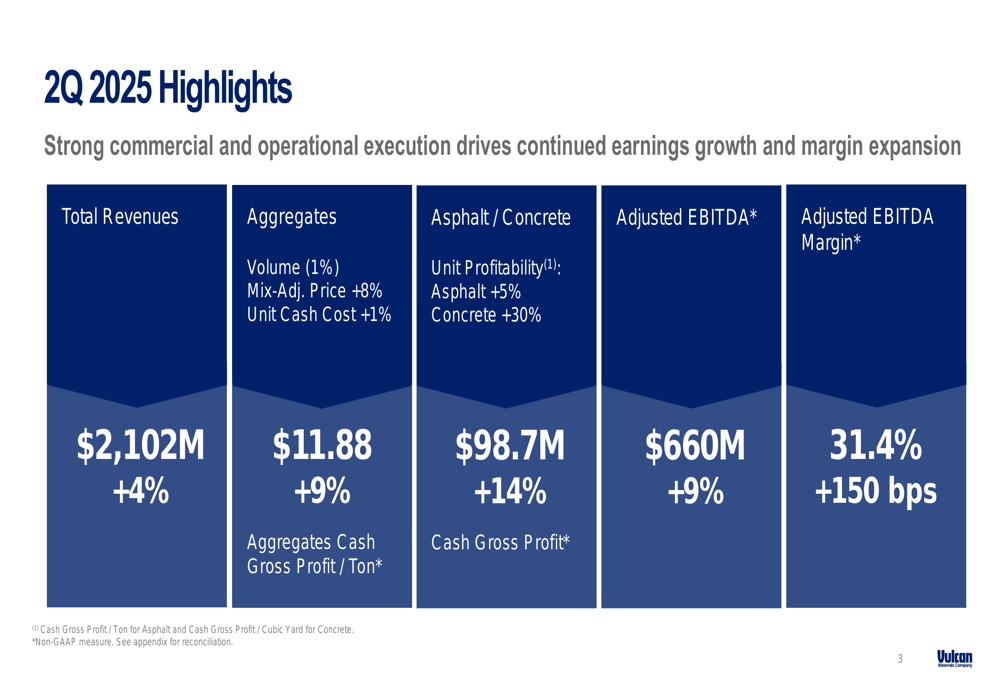
The company’s adjusted EBITDA margin expanded by 150 basis points to 31.4%, reflecting Vulcan’s ability to control costs while implementing price increases. Particularly impressive was the performance in downstream businesses, with asphalt and concrete cash gross profit increasing 14% to $98.7 million, driven by 5% growth in asphalt and 30% growth in concrete.
For the first half of 2025, Vulcan’s performance showed even stronger profitability metrics despite the slight volume decline:
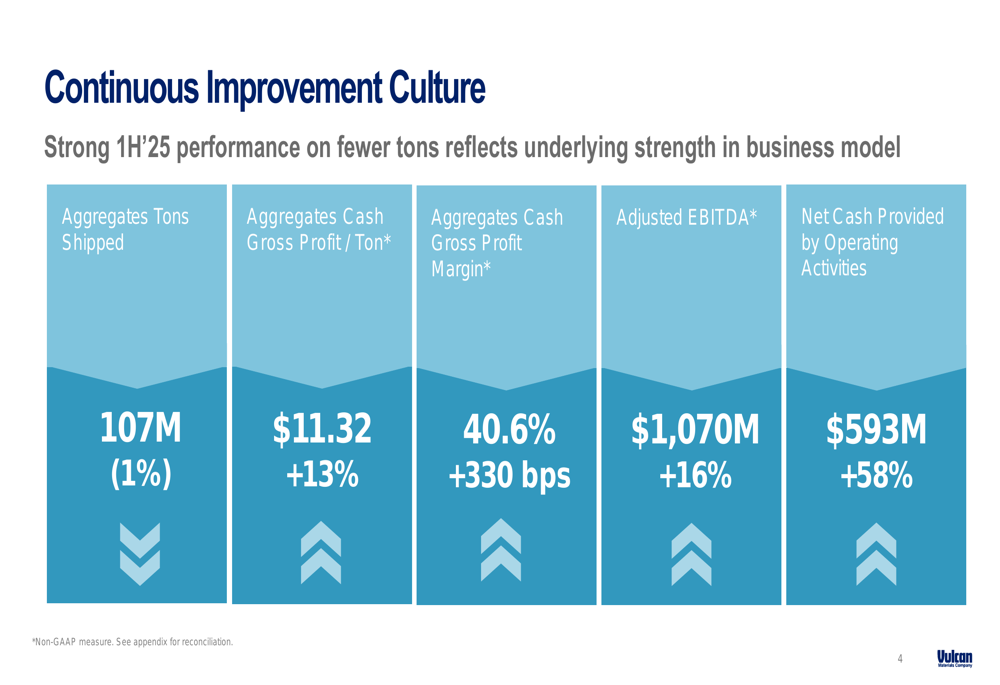
The company’s aggregates cash gross profit per ton increased 13% to $11.32 for the first half of 2025, with cash gross profit margin expanding 330 basis points to 40.6%. This performance demonstrates Vulcan’s continued focus on operational efficiency and pricing discipline. Net cash provided by operating activities surged 58% to $593 million, reflecting the company’s strong cash conversion capabilities.
Financial Position & Capital Allocation
Vulcan maintained a disciplined approach to capital allocation while investing significantly in growth opportunities. The company’s balance sheet remains solid with a debt-to-adjusted EBITDA ratio of 2.2x, providing flexibility for continued strategic investments.
The following slide illustrates Vulcan’s balanced capital allocation strategy:
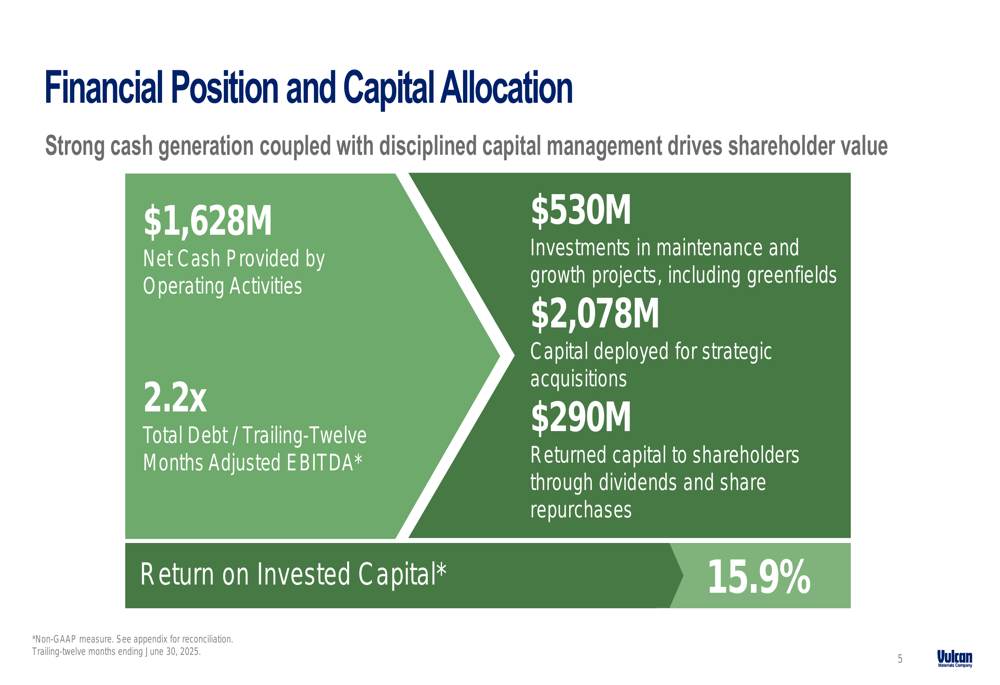
The company generated $1.628 billion in operating cash flow on a trailing twelve-month basis, deploying $530 million toward maintenance and growth projects, including greenfield developments. Notably, Vulcan invested $2.078 billion in strategic acquisitions while returning $290 million to shareholders through dividends and share repurchases. The company’s return on invested capital reached an impressive 15.9%, demonstrating efficient capital deployment.
Market Dynamics & Competitive Positioning
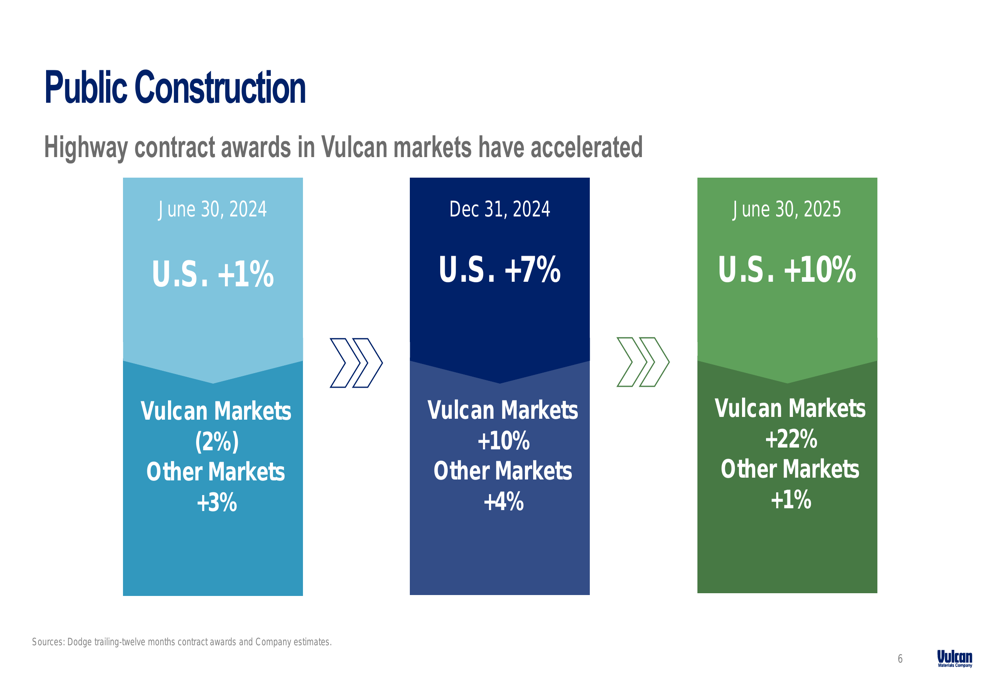
Vulcan’s strategic positioning in high-growth markets continues to provide tailwinds for future growth. The company highlighted the acceleration of highway contract awards in its key markets, which increased 22% year-over-year as of June 30, 2025, significantly outpacing the national average of 10%.
The following chart illustrates this favorable trend in public construction spending:
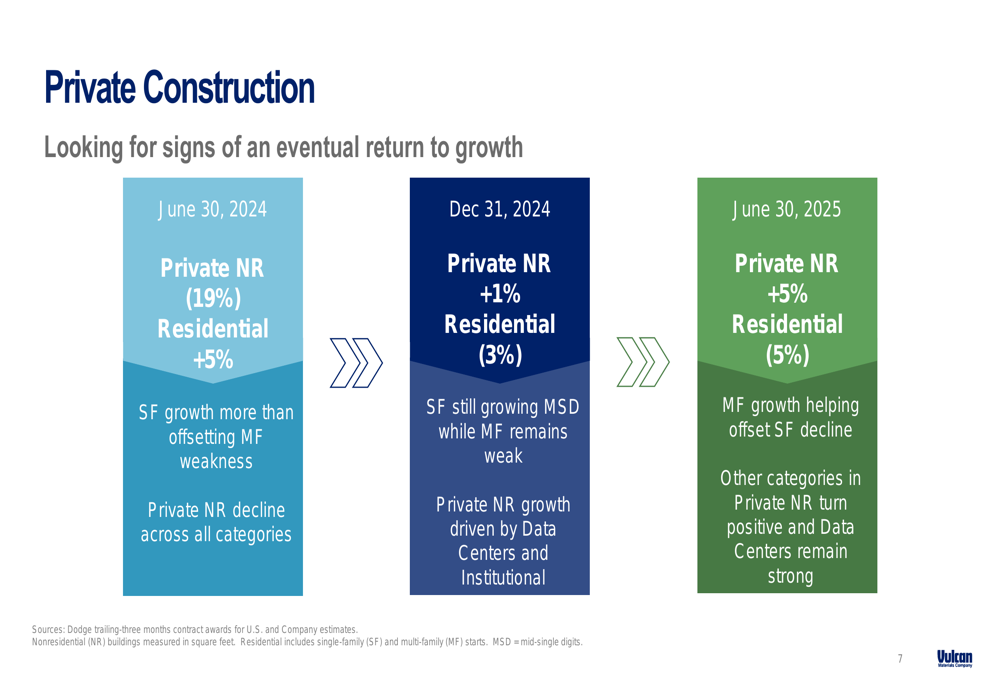
Private construction markets showed mixed results, with nonresidential construction growing 5% while residential construction declined 5%. Data centers remain a bright spot, consistent with CEO Tom Hill’s comments during the Q1 earnings call that "data centers will be a really bright spot for us and one that is a go."
The private construction trends are illustrated in the following slide:
Vulcan’s competitive advantages stem from its strategic geographic footprint and market leadership. The company serves 35 of the top 50 fastest-growing markets in the United States, with 90% of its revenues coming from markets where it holds the #1 or #2 position. Additionally, 67% of Infrastructure Investment and Jobs Act highway formula dollars are allocated to states where Vulcan operates.
2025 Outlook & Forward Guidance
Vulcan maintained its full-year 2025 adjusted EBITDA guidance of $2.35 billion to $2.55 billion, representing a 19% increase at the midpoint compared to 2024. This outlook is supported by several positive factors highlighted in the presentation:
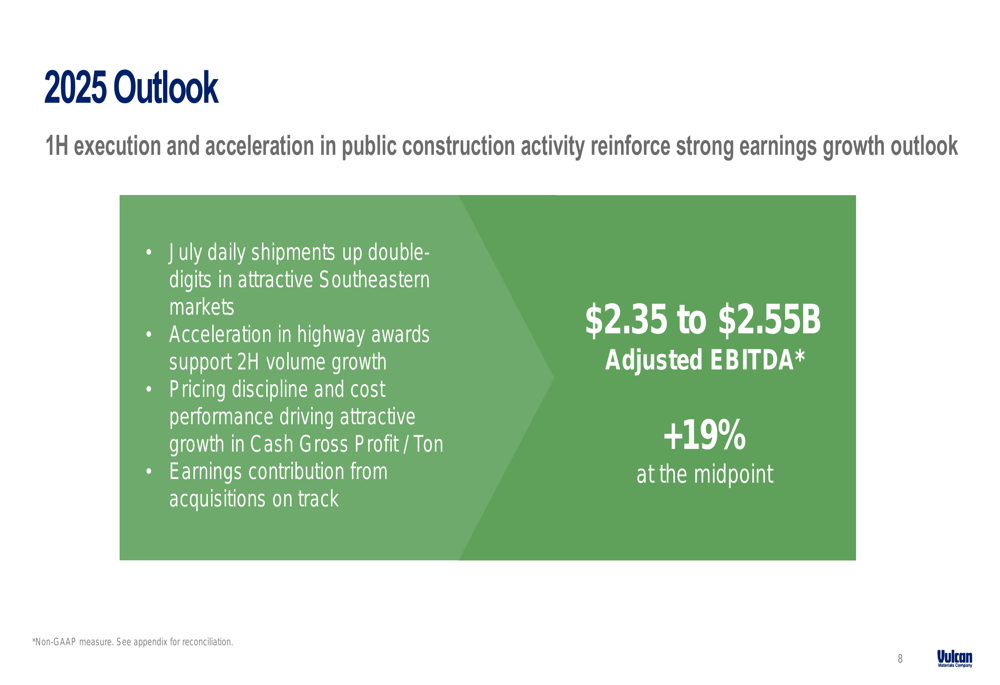
The company reported that July daily shipments were up by double digits in its attractive Southeastern markets, and the acceleration in highway awards is expected to support volume growth in the second half of 2025. Management emphasized that pricing discipline and cost performance will continue to drive attractive growth in cash gross profit per ton, while earnings contributions from acquisitions remain on track.
This guidance is consistent with what was communicated during the Q1 2025 earnings call, where CEO Tom Hill stated, "We continue to expect to deliver between $2,350,000,000 and $2,550,000,000 of adjusted EBITDA in 2025."
Competitive Industry Position
Vulcan continues to outperform industry peers across key financial metrics. The company’s strategic focus on aggregates, which comprise 76% of total revenues, has enabled it to achieve superior growth rates compared to competitors.
The following competitive analysis highlights Vulcan’s industry-leading performance:
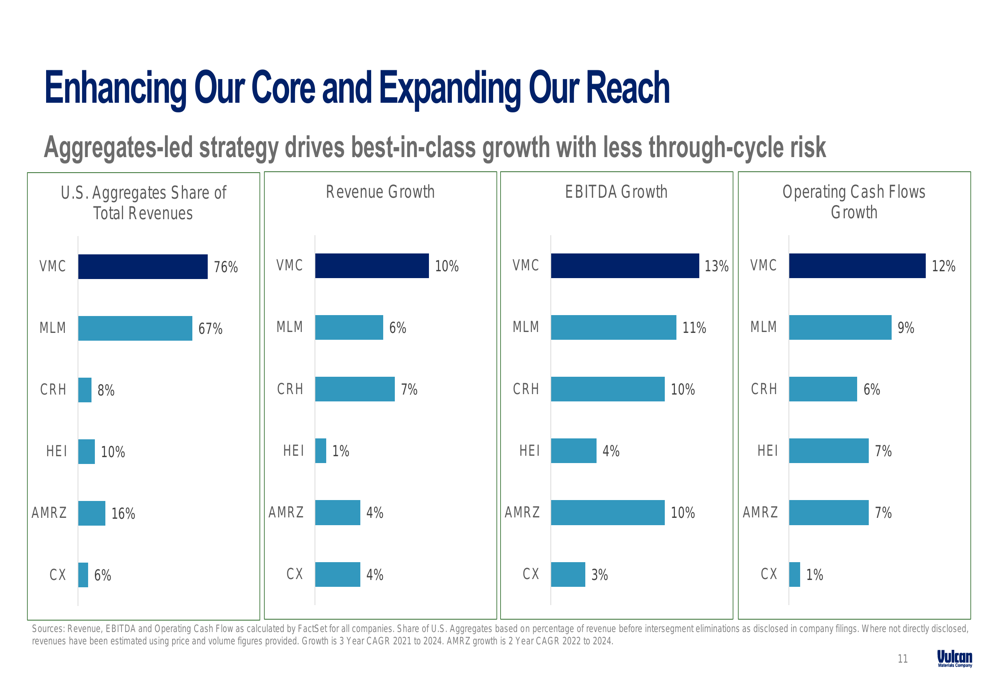
With 10% revenue growth, 13% EBITDA growth, and 12% operating cash flow growth (based on 3-year CAGR from 2021 to 2024), Vulcan has established a clear lead over competitors like Martin Marietta (MLM), CRH (NYSE:CRH), Heidelberg (ETR:HDDG) Materials (HEI), Adbri (AMRZ), and CEMEX (CX).
This outperformance is driven by Vulcan’s strategic approach, which the company refers to as "The Vulcan Way," encompassing commercial excellence, logistics innovation, operational excellence, and strategic sourcing:
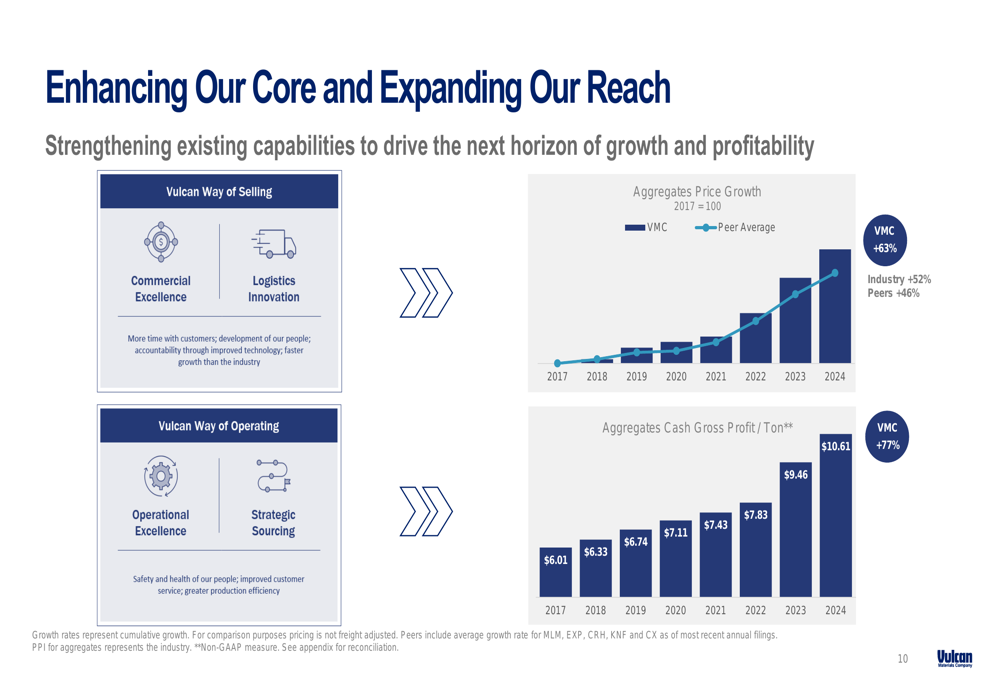
The company’s aggregates price growth has outpaced both the industry average and peer group since 2017, with a cumulative increase of 63% compared to 52% for the industry and 46% for peers. This pricing power has translated into a 77% increase in aggregates cash gross profit per ton since 2017, reaching $10.61 in 2024.
Conclusion
Vulcan Materials’ Q2 2025 presentation demonstrates the company’s ability to drive margin expansion and profitability growth despite modest volume challenges. By leveraging its market-leading positions, pricing power, and operational efficiency initiatives, Vulcan continues to outperform industry peers across key financial metrics.
The company’s strategic positioning in high-growth markets, particularly those benefiting from increased infrastructure spending, provides a solid foundation for continued growth. With a disciplined approach to capital allocation and a strong balance sheet, Vulcan appears well-positioned to execute its growth strategy while delivering value to shareholders.
As the company moves into the second half of 2025, investors will be watching closely to see if the anticipated acceleration in highway spending and continued pricing discipline will enable Vulcan to meet or exceed its full-year guidance.
Full presentation:
This article was generated with the support of AI and reviewed by an editor. For more information see our T&C.