Micron to exit server chips business in China after 2023 ban- Reuters

Introduction & Market Context
Warby Parker (NYSE:WRBY) released its second quarter 2025 earnings presentation on August 7, 2025, revealing strong financial performance and continued expansion of its retail footprint. The eyewear retailer, which pioneered the direct-to-consumer model in the optical industry, reported significant revenue growth and improved profitability metrics.
The market responded positively to the results, with Warby Parker’s stock rising 11.4% to $27.07 during the trading session. The company continues to capture market share in the $68 billion U.S. eyewear market, where it currently represents approximately 1% of the total market.
Quarterly Performance Highlights
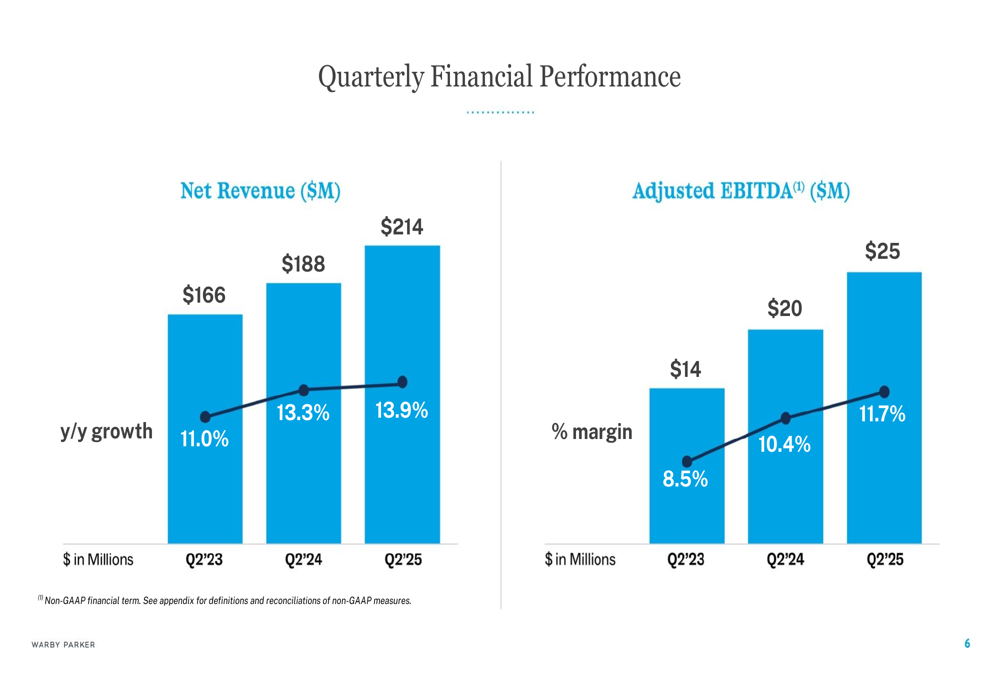
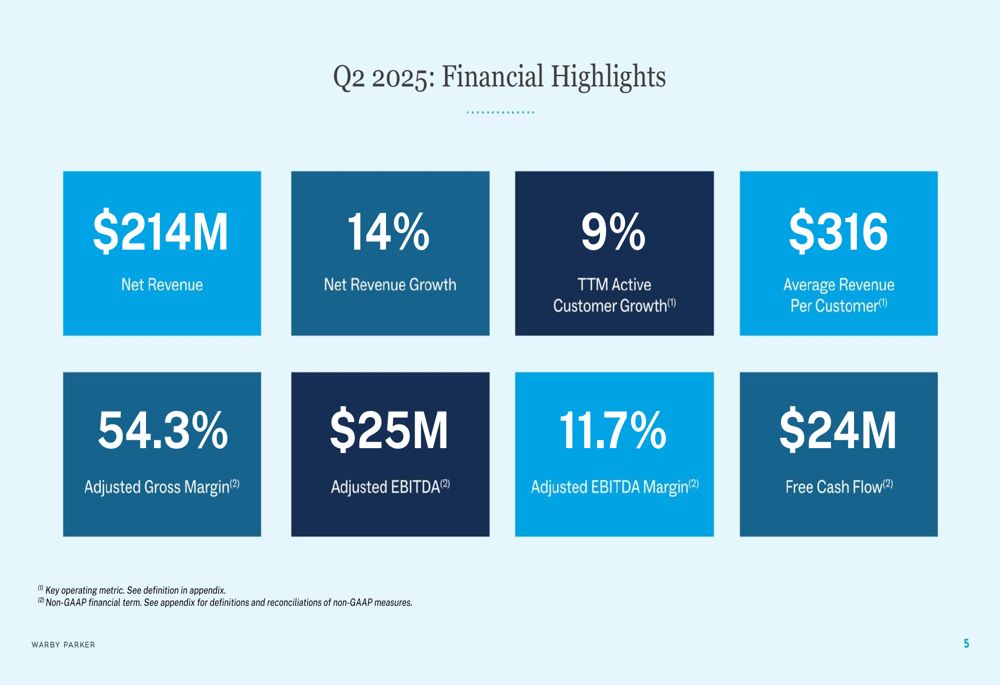
Warby Parker delivered solid financial results for Q2 2025, with net revenue reaching $214 million, representing 14% year-over-year growth. The company also reported improved profitability metrics, with adjusted EBITDA of $25 million and an adjusted EBITDA margin of 11.7%, up from 10.4% in the same quarter last year.
As shown in the following chart of quarterly financial performance, Warby Parker has demonstrated consistent growth in both revenue and adjusted EBITDA over the past three years:
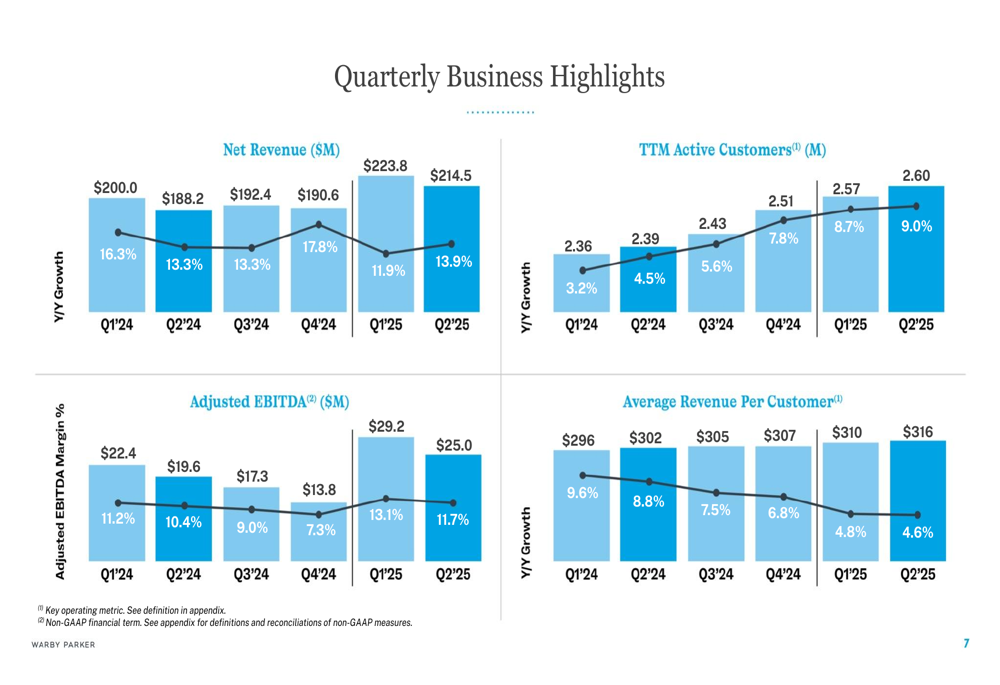
The company’s active customer base grew to 2.60 million, a 9% increase year-over-year, while average revenue per customer reached $316. Free cash flow for the quarter was $24 million, demonstrating the company’s ability to generate cash while continuing to invest in growth initiatives.
Additional quarterly business metrics show positive trends across key performance indicators:
Retail Expansion Strategy
A key component of Warby Parker’s growth strategy is its retail expansion. The company opened 11 new retail stores in Q2 2025, bringing its total to 298 locations (293 in the U.S. and 5 in Canada). Warby Parker now has a presence in 101 markets across 44 states or provinces and 229 cities, including 47 of the 50 most populous markets in the U.S.
The company’s retail footprint expansion strategy is illustrated in this regional breakdown:
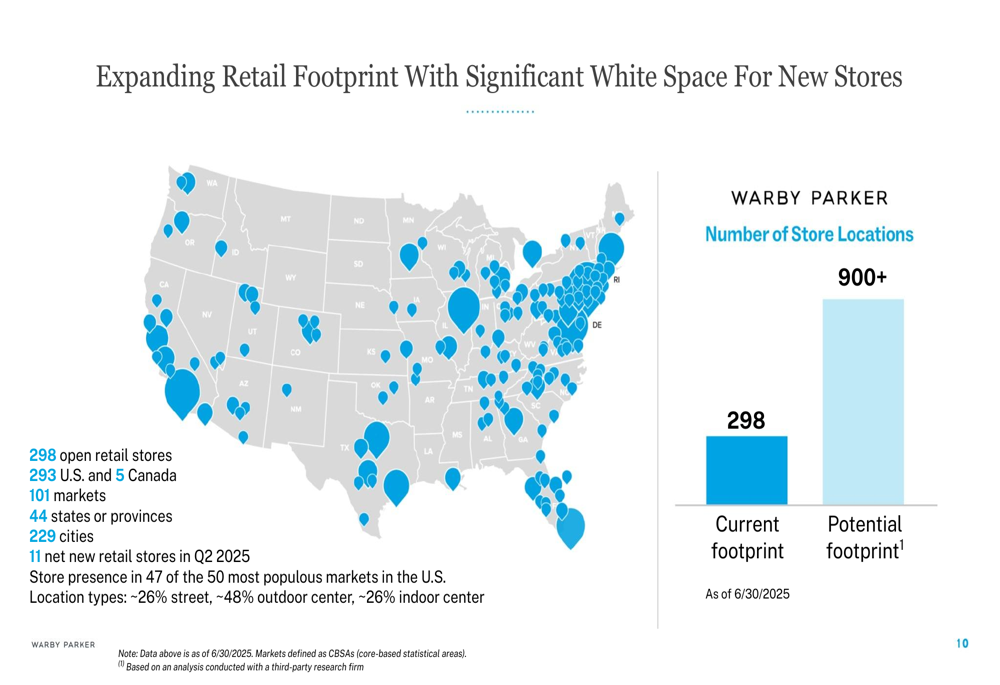
Management believes there is potential for more than 900 stores in the long term, suggesting significant room for continued physical retail growth. The current store mix includes approximately 26% street locations, 48% outdoor centers, and 26% indoor centers, providing diversification across retail environments.
Customer Retention & Growth
Warby Parker’s presentation highlighted impressive customer retention metrics, demonstrating the company’s ability to build lasting relationships with its customer base. Sales retention rates improve significantly over time, with cohorts reaching over 100% retention at the 48-month mark, indicating that long-term customers spend more with the company over time.
The following chart illustrates this retention pattern across different customer cohorts:
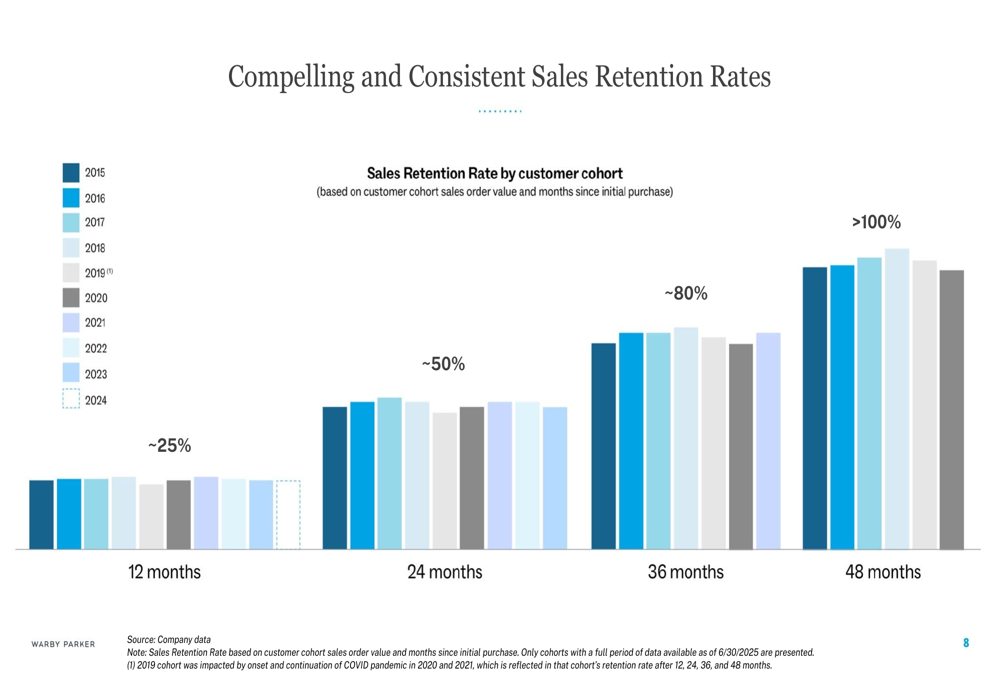
This retention data underscores the company’s success in creating customer loyalty and increasing lifetime value, which supports sustainable growth and profitability over time.
Forward Guidance
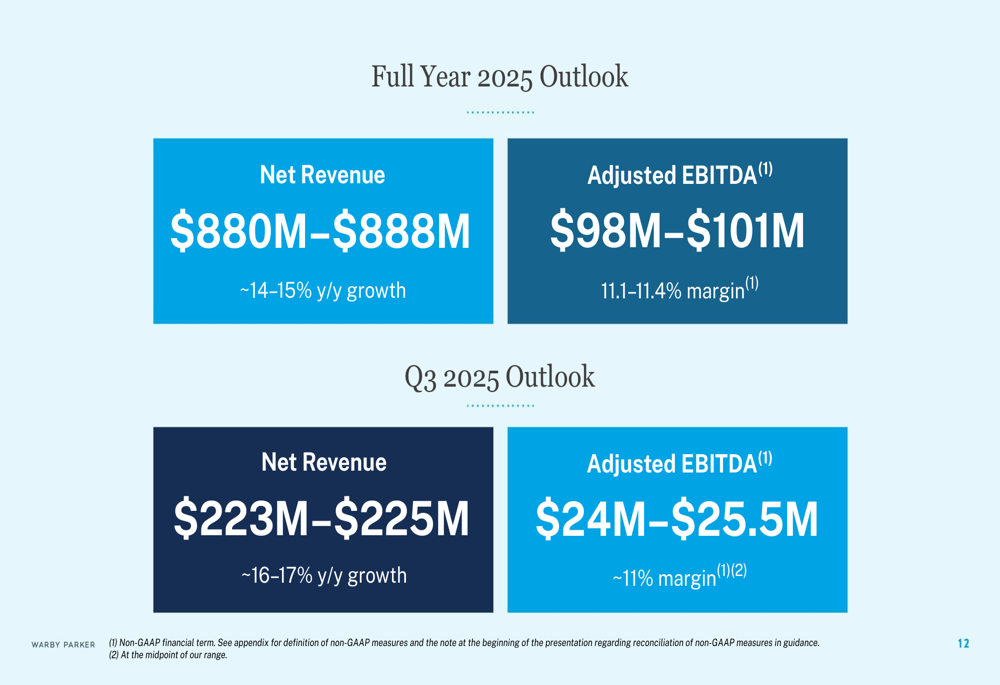
Based on its strong performance, Warby Parker raised its full-year 2025 outlook. The company now expects annual revenue between $880 million and $888 million, representing year-over-year growth of 14-15%. Adjusted EBITDA is projected to be between $98 million and $101 million, with margins between 11.1% and 11.4%.
For the third quarter of 2025, Warby Parker anticipates revenue of $223 million to $225 million (16-17% year-over-year growth) and adjusted EBITDA of $24 million to $25.5 million, maintaining an approximately 11% margin.
The company’s detailed outlook is presented in the following slide:
Financial Analysis
Warby Parker’s financial performance shows continued improvement in profitability metrics. For the six months ended June 30, 2025, the company reported net income of $1.72 million, compared to a net loss of $9.44 million in the same period of 2024. This transition to profitability marks an important milestone in the company’s financial evolution.
The company maintains a strong balance sheet with a healthy cash position, allowing it to fund its ongoing expansion while generating positive free cash flow. The adjusted gross margin of 54.3% in Q2 2025 demonstrates the company’s ability to maintain pricing power while scaling operations.
The Q2 2025 financial highlights are summarized in this comprehensive overview:
Market Reaction
Investors responded positively to Warby Parker’s Q2 2025 results and raised guidance, with the stock price increasing 11.4% on the day of the announcement. The strong performance and optimistic outlook appear to have reassured investors about the company’s growth trajectory and path to sustained profitability.
The stock’s movement represents a significant recovery from its 52-week low of $12.46, though it remains below its 52-week high of $29.73. With continued execution of its expansion strategy and improving financial metrics, Warby Parker aims to deliver long-term value to shareholders while disrupting the traditional eyewear market.
Full presentation:
This article was generated with the support of AI and reviewed by an editor. For more information see our T&C.