Palantir launches Chain Reaction AI infrastructure platform with CenterPoint and NVIDIA

Whitestone REIT (NYSE:WSR) presented its Q1 2025 earnings results on May 1, showcasing continued growth driven by its focus on high-value shop spaces in Sun Belt markets. The real estate investment trust reported modest revenue growth and improved leasing spreads while maintaining high occupancy rates.
Quarterly Performance Highlights
Whitestone reported Q1 2025 revenue of $38.0 million, up from $37.2 million in Q1 2024, while Core FFO per share increased to $0.25 from $0.24 year-over-year. Same-store NOI growth reached 4.8% in Q1 2025, improving from 3.1% in the same period last year.
The company maintained a strong occupancy rate of 94.1%, representing a 280 basis point improvement since 2021. Leasing spreads continued to impress at 20.3% in Q1 2025, up from 17.0% in Q1 2024, demonstrating Whitestone’s ability to command higher rents upon lease renewals.
As shown in the following comprehensive summary of Whitestone’s Q1 2025 performance:
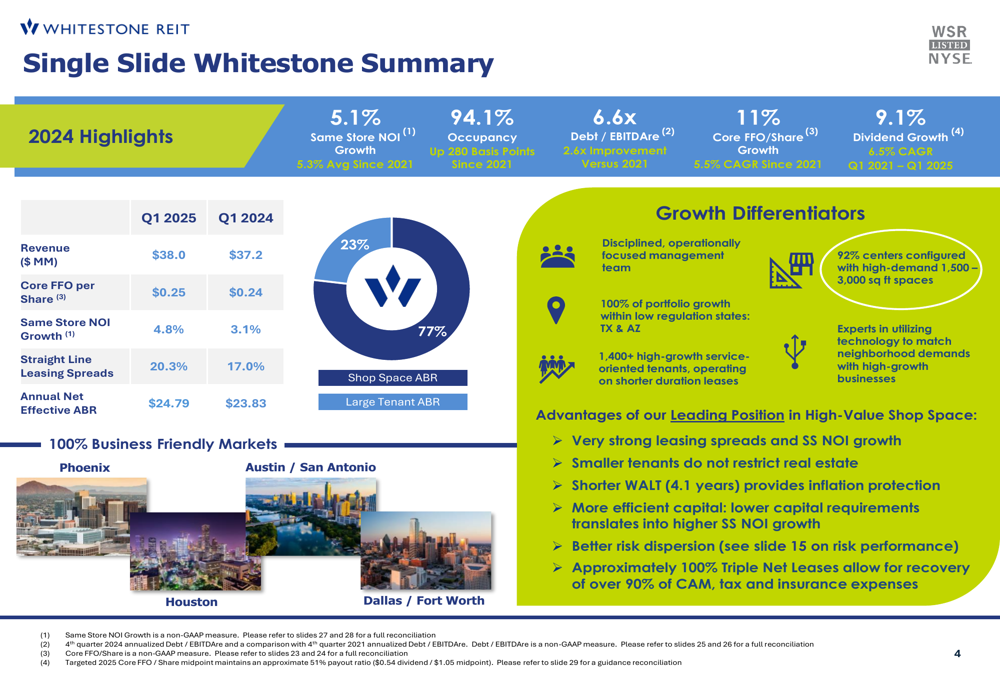
The company has also made significant progress in strengthening its balance sheet, reducing its Debt/EBITDAre ratio to 6.6x, a 2.6x improvement since 2021. This deleveraging has positioned Whitestone to pursue strategic acquisitions while maintaining financial discipline.
Strategic Focus on Shop Spaces
A key differentiator for Whitestone is its focus on smaller shop spaces, typically ranging from 1,500 to 3,000 square feet, which cater to regional or local service-based tenants. According to the presentation, these spaces command higher rents, have higher contractual escalators, and allow for more frequent lease renewals.
The company’s leasing spreads have consistently improved over the past four years, as illustrated in the following chart:
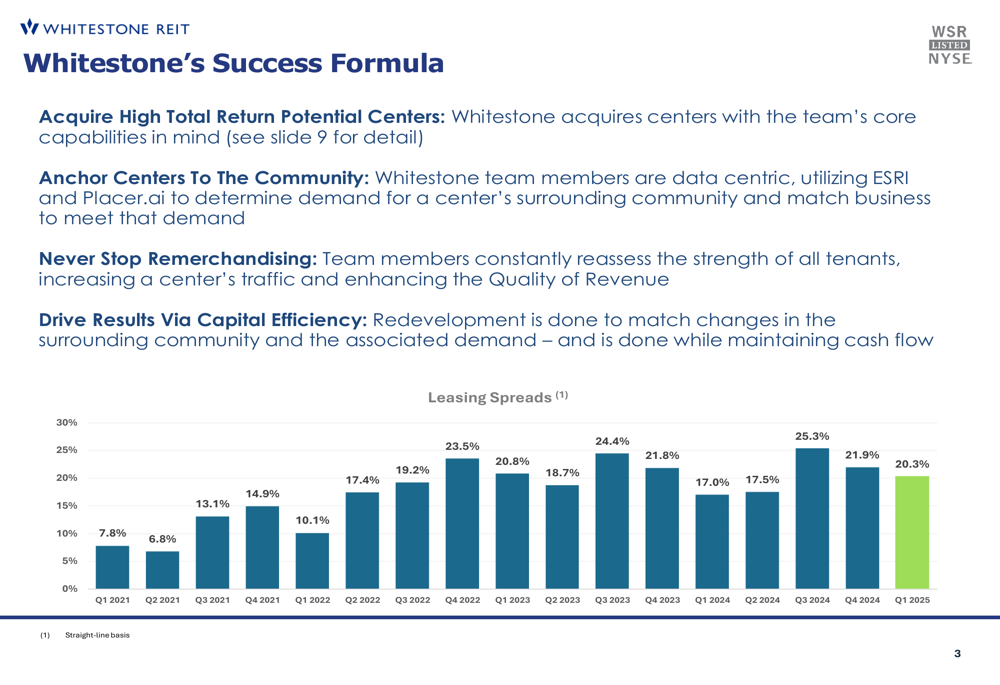
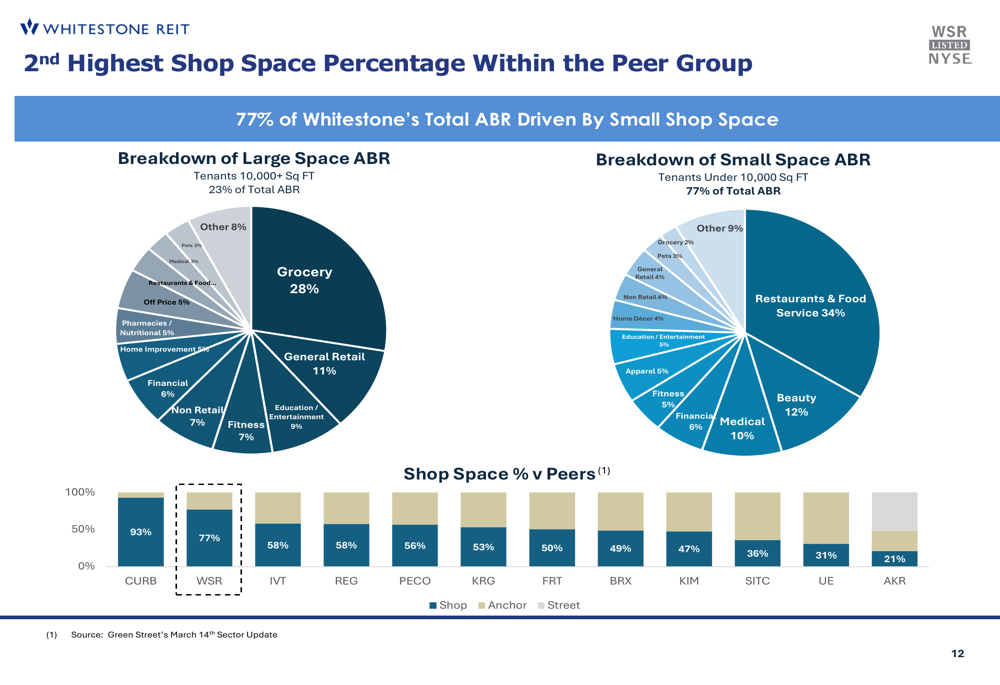
Whitestone’s portfolio consists of 77% small shop space (under 10,000 sq ft) by ABR, significantly higher than most peers in the shopping center REIT sector. This strategic positioning has enabled the company to achieve stronger leasing spreads and NOI growth while requiring less capital expenditure.
As shown in the peer comparison below, Whitestone’s shop space percentage is second only to CURB among comparable REITs:
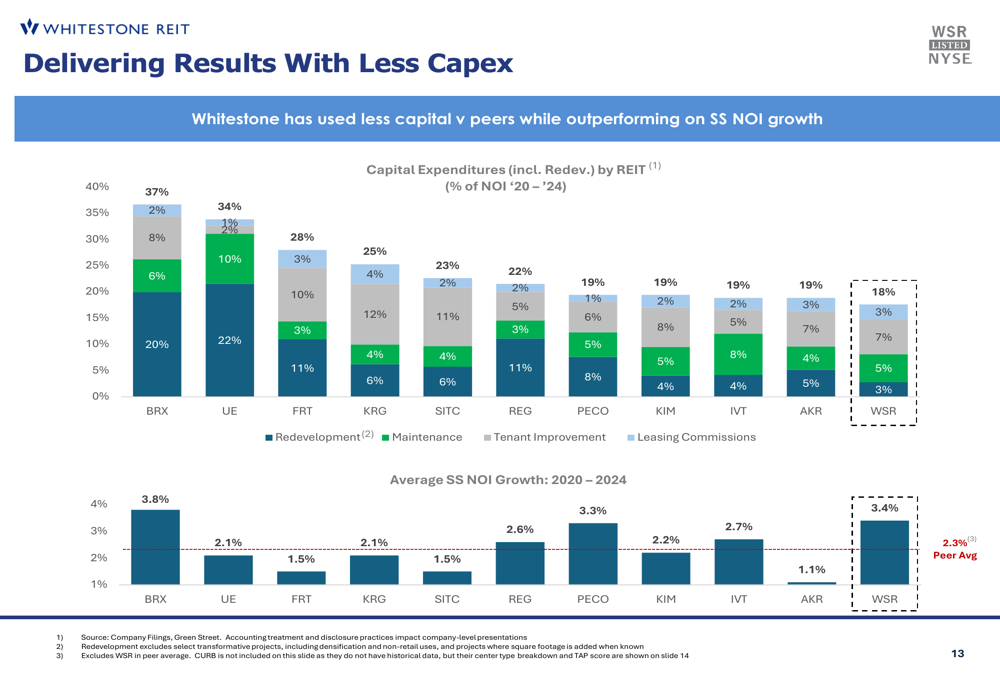
This focus on shop spaces has also allowed Whitestone to deliver superior same-store NOI growth with lower capital expenditures compared to peers:
Acquisition and Redevelopment Strategy
Whitestone has been active in portfolio optimization, acquiring properties in high-income neighborhoods while divesting non-core assets. Recent acquisitions include Scottsdale Commons (April 2024), Garden Oaks (February 2024), and Arcadia (June 2023), all of which align with the company’s strategy of targeting high-income areas with strong traffic drivers.
The following slide details these recent transactions:
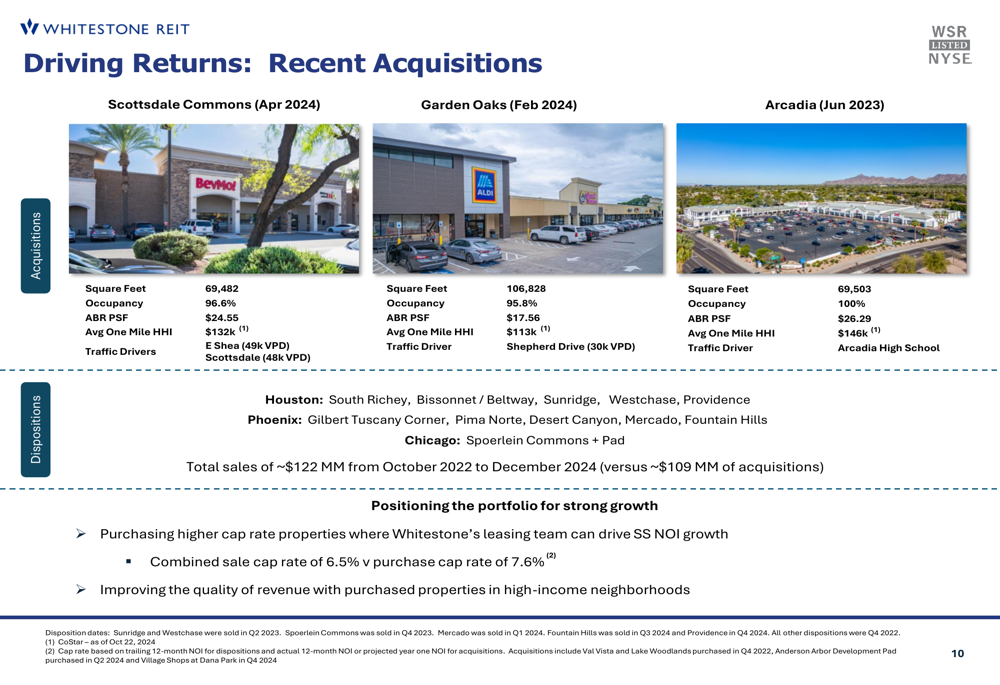
The company is also pursuing redevelopment opportunities to drive future NOI growth. Whitestone expects to boost same-store NOI growth by up to 1% through $20-30 million in redevelopment spending. Potential 2025/2026 pad site developments include Lion’s Square and Williams Trace Plaza in Houston, as well as Scottsdale Commons, Arcadia, and Terravita in Arizona.
Competitive Positioning
Whitestone’s portfolio is exclusively focused on business-friendly Sun Belt markets in Texas and Arizona, areas with projected job growth exceeding the national average. The company’s properties score highly on Green Street’s Trade Area Power Scores, indicating strong demographic and economic fundamentals in their locations.
The company’s risk management approach has proven effective, as demonstrated by its performance during and after the pandemic. Occupancy has steadily improved from 88.2% in 2020 to 94.1% in 2024, while bad debt as a percentage of revenue has normalized to pre-pandemic levels.
Forward Guidance
Whitestone has reiterated its 2025 guidance, targeting Core FFO per share of $1.03-$1.07, which represents continued growth from the $1.01 achieved in 2024. This guidance is supported by expected same-store NOI growth of 3-5%, driven by contractual escalators (2.3%), leasing activity (0.8-1.8%), and redevelopment contributions (up to 1.0%).
The following waterfall chart illustrates the company’s path to achieving its 2025 Core FFO target:
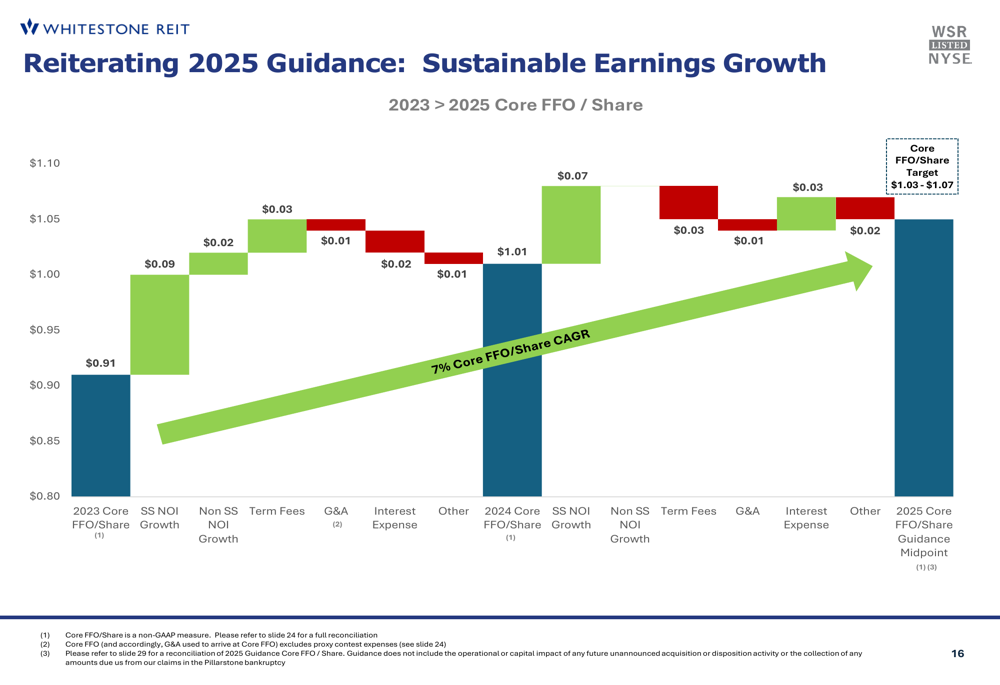
Management expects to maintain 4-6% organic Core FFO growth, with an additional 100 basis points of growth potential through accretive acquisitions. The company’s disciplined approach to growth focuses on high-return shop space in business-friendly markets with strong demographics.
Despite the positive operational performance, Whitestone’s stock has faced pressure in recent trading. After reporting strong Q4 2024 results in late April (EPS of $0.28 versus expected $0.20), the stock declined 4.49% in premarket trading. Current trading shows the stock at $13.04, down 0.38% on April 30, 2025, with after-market trading indicating a further decline of 1.53% to $12.84.
This disconnect between operational performance and stock price movement suggests investors may be concerned about broader economic factors affecting retail real estate or potential headwinds in Whitestone’s target markets, despite the company’s continued execution of its strategic plan.
Full presentation:
This article was generated with the support of AI and reviewed by an editor. For more information see our T&C.