Asia tech stocks slide tracking Wall St losses amid AI doubts, govt. uncertainty

Executive Summary
WM Technology, Inc. (NASDAQ:MAPS) reported its first quarter 2025 financial results on May 8, showing modest revenue growth but significantly improved profitability. The cannabis technology platform posted revenues of $44.6 million, a slight 0.5% increase year-over-year, while net income jumped 25% to $2.5 million compared to $2.0 million in Q1 2024.
The company’s adjusted EBITDA reached $10.1 million, representing a 5.2% improvement from the prior year and maintaining a healthy 23% margin. WM Technology continued to strengthen its balance sheet, ending the quarter with $53.3 million in cash and cash equivalents, up from $52.0 million at the end of 2024.
Quarterly Performance Highlights
WM Technology’s Q1 2025 performance demonstrated resilience in a challenging cannabis market environment. While revenue growth was modest at just 0.5% year-over-year, the company achieved notable improvements in profitability metrics.
As shown in the following summary of key financial results:
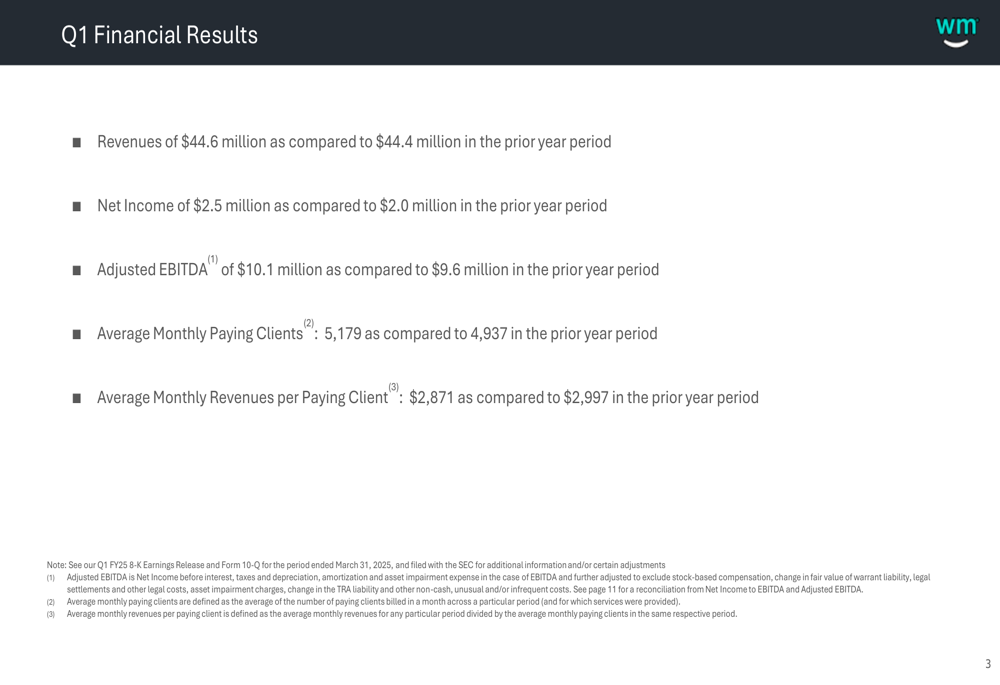
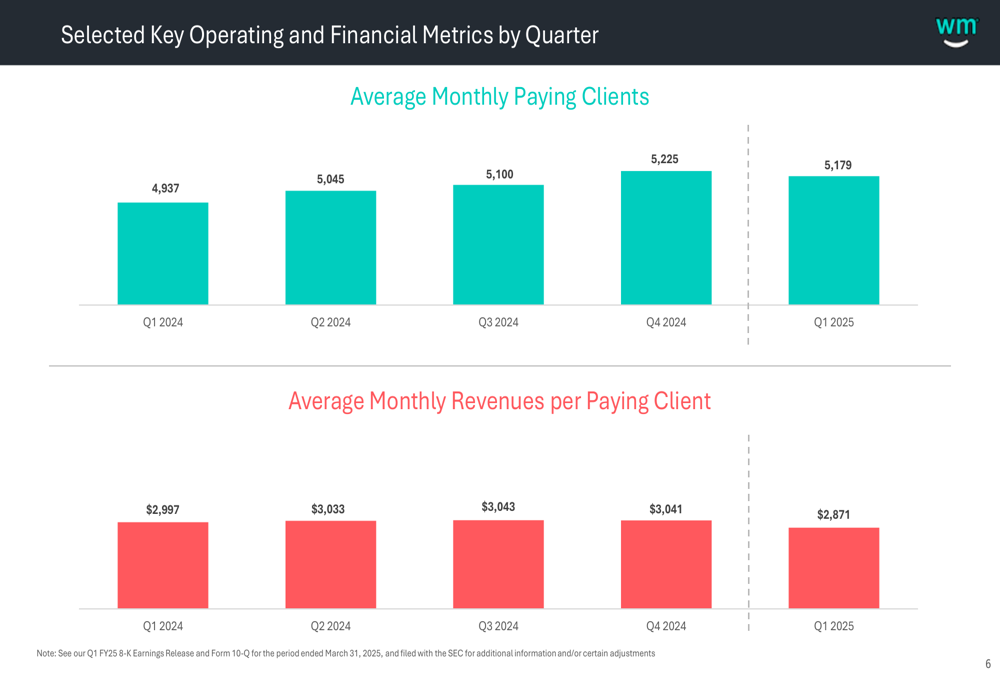
The company’s client base expanded to 5,179 average monthly paying clients, a 4.9% increase from Q1 2024. However, average monthly revenue per paying client declined by 4.2% to $2,871, suggesting pricing pressures or changes in client spending patterns.
Detailed Financial Analysis
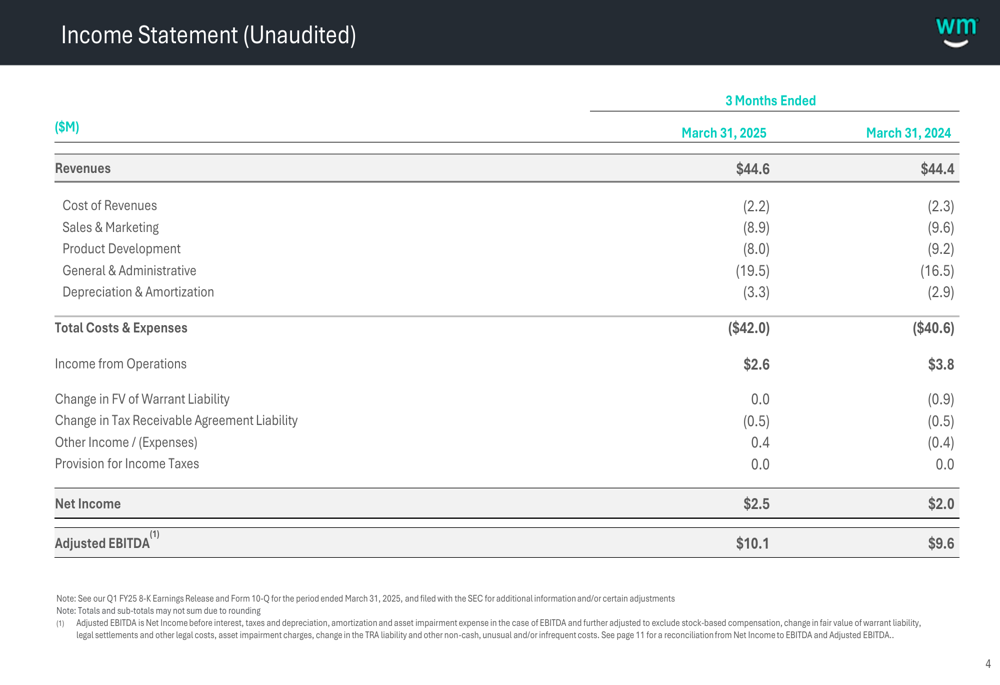
The income statement reveals that WM Technology effectively managed its operating expenses, particularly in sales and marketing (down 7.3% YoY) and product development (down 13.0% YoY), which helped drive the improved profitability despite flat revenue.
The comprehensive income statement details are shown below:
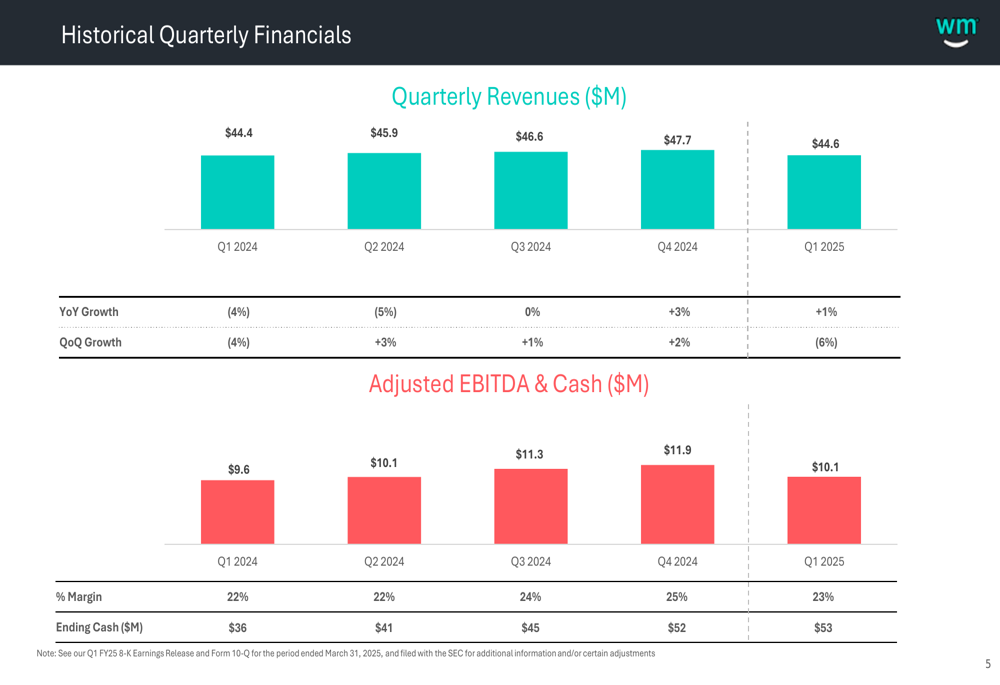
Looking at quarterly trends, WM Technology has maintained relatively stable revenue over the past five quarters, with a sequential decline of 6% from Q4 2024 ($47.7 million) to Q1 2025 ($44.6 million). However, the company has consistently improved its cash position, growing from $36 million in Q1 2024 to $53 million in Q1 2025.
The following chart illustrates these quarterly financial trends:
Revenue Composition and Client Metrics
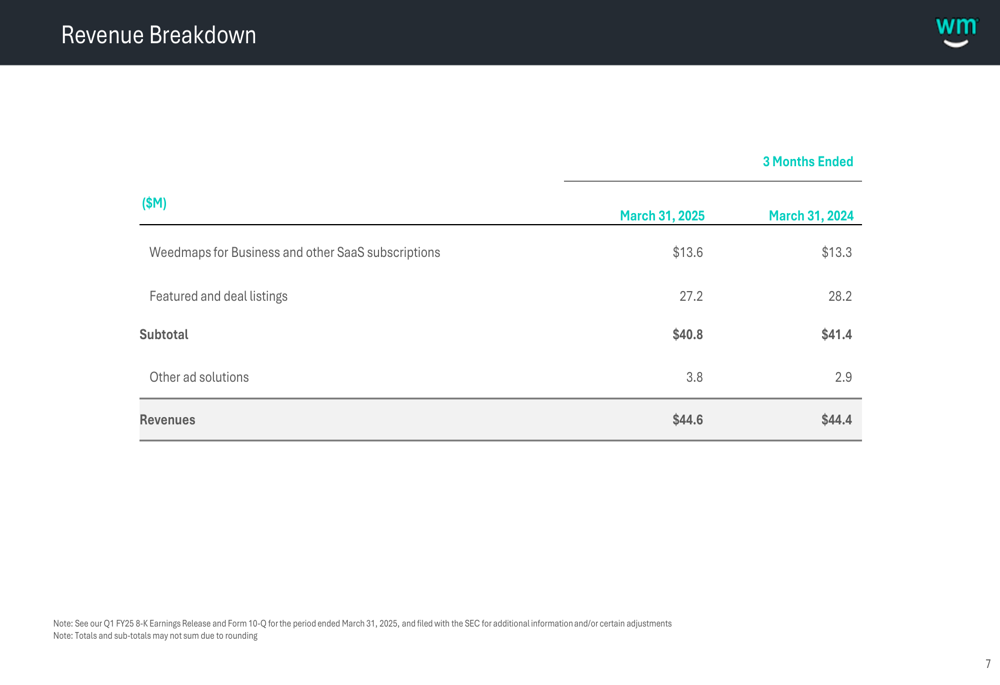
WM Technology’s revenue mix showed interesting shifts, with growth in SaaS subscriptions and advertising solutions offsetting declines in featured listings. The company’s "Weedmaps for Business and other SaaS subscriptions" revenue grew to $13.6 million from $13.3 million in the prior year, while "Other ad solutions" increased to $3.8 million from $2.9 million.
The detailed revenue breakdown is presented here:
The company’s operating metrics reveal a growing client base but declining revenue per client. This dynamic suggests WM Technology is successfully attracting new clients but may be facing challenges in monetizing them at historical levels.
The following chart shows the trends in client metrics over the past five quarters:
Balance Sheet and Cash Position
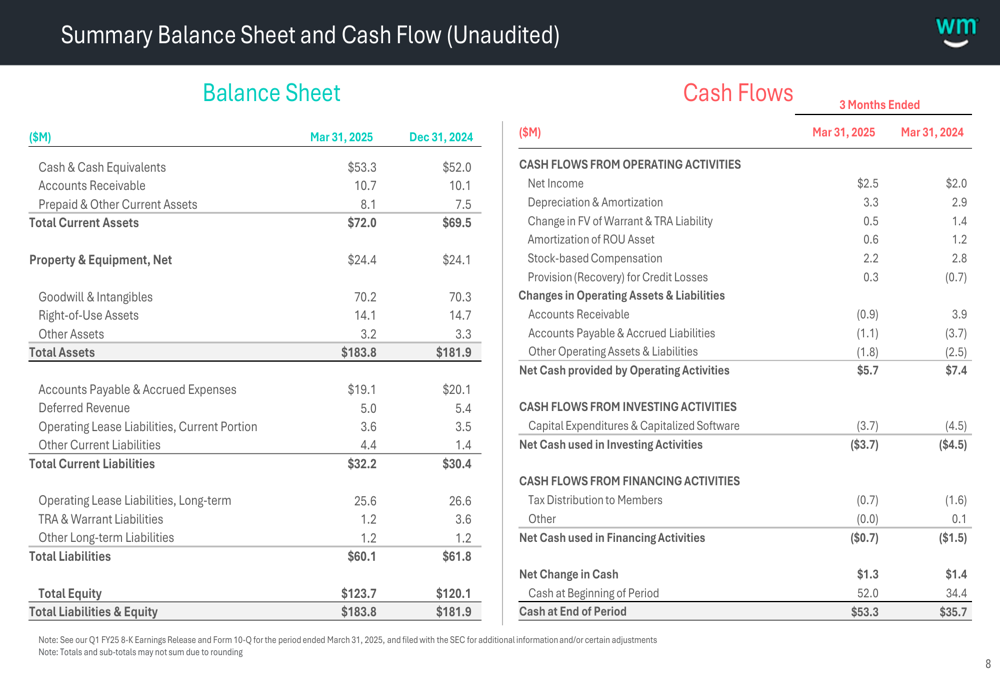
WM Technology maintained a strong financial position, with $53.3 million in cash and cash equivalents as of March 31, 2025, compared to $52.0 million at the end of 2024. The company generated $5.7 million in operating cash flow during Q1 2025, demonstrating solid cash conversion.
The condensed balance sheet and cash flow information is presented below:
Non-GAAP Reconciliations
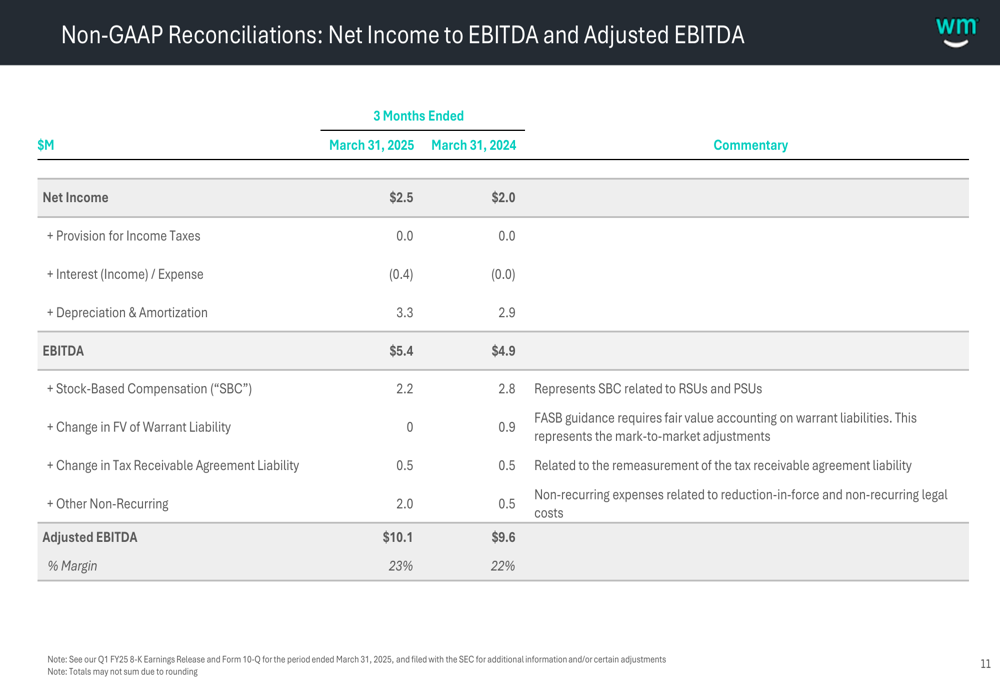
WM Technology’s adjusted EBITDA, a key metric for evaluating the company’s operational performance, reached $10.1 million in Q1 2025, representing a 5.2% increase from $9.6 million in Q1 2024. The adjusted EBITDA margin improved to 23% from 22% in the prior year period.
The reconciliation between GAAP and non-GAAP metrics is detailed in the following table:
Market Context and Outlook
WM Technology’s Q1 2025 results should be viewed in the context of the broader cannabis industry, which continues to face regulatory uncertainties and market challenges. The company’s ability to maintain revenue stability while improving profitability demonstrates operational discipline in a difficult environment.
Based on previous earnings commentary, WM Technology has been focusing on efficiency and marketplace operations while navigating regulatory uncertainties in the cannabis sector. The company’s strong cash position and debt-free status provide flexibility to weather industry headwinds and potentially capitalize on growth opportunities.
The modest revenue growth but improved profitability in Q1 2025 aligns with the company’s recent strategic focus on operational efficiency. While the sequential revenue decline from Q4 2024 to Q1 2025 warrants monitoring, the year-over-year improvements in key metrics suggest the company is executing effectively on its core strategy.
WM Technology’s stock closed at $1.13 on May 8, 2025, and moved up 2.56% to $1.20 in after-hours trading following the earnings release, indicating a positive initial market reaction to the results.
Full presentation:
This article was generated with the support of AI and reviewed by an editor. For more information see our T&C.