Blazing Star Merger Sub completes Walgreens debt tender offer

W.P. Carey Inc. (NYSE:WPC) released its Q2 2025 investor presentation on July 30, 2025, highlighting the company’s continued focus on portfolio diversification and stable performance metrics. The real estate investment trust, which specializes in single-tenant net lease commercial real estate, reported maintaining a high occupancy rate of 98.2% while experiencing a gradual slowdown in same-store annual base rent (ABR) growth.
Portfolio Performance Highlights
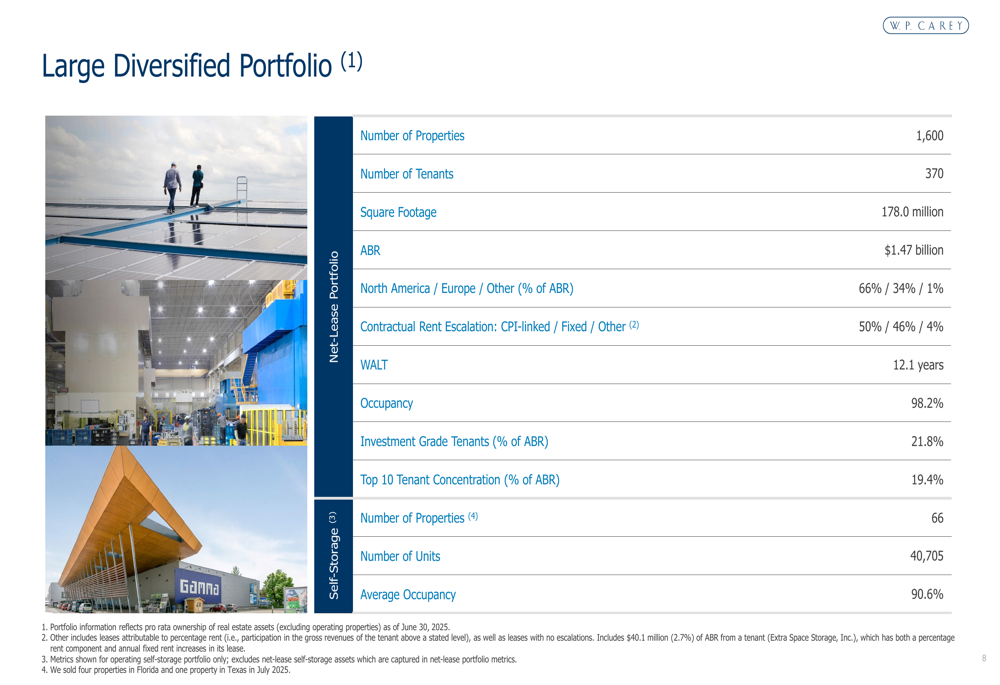
As of June 30, 2025, W.P. Carey’s portfolio consisted of 1,600 properties with 370 tenants, spanning 178 million square feet and generating $1.47 billion in annual base rent. The company maintained its position as one of the largest net lease real estate owners and among the top 20 REITs in the MSCI US REIT Index.
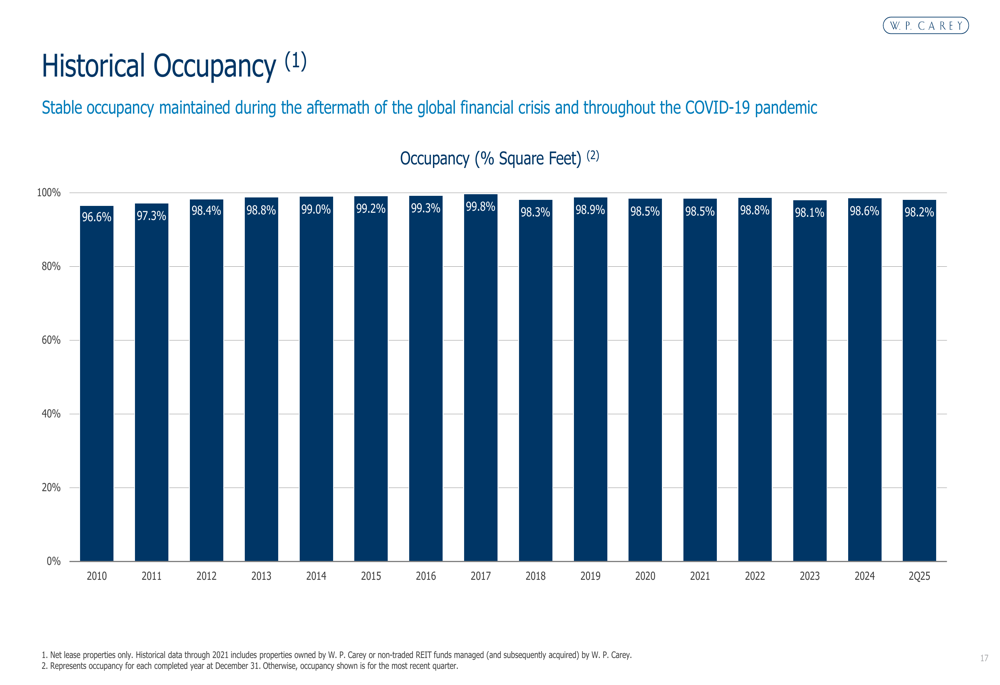
The presentation emphasized the company’s diversified approach across multiple dimensions, including tenant, industry, property type, and geography. This strategy has helped W.P. Carey maintain consistently high occupancy rates, which have ranged between 96.6% and 99.8% since 2010.
As shown in the following chart of historical occupancy rates, the company has maintained strong performance even through various economic cycles:
The portfolio remains well-diversified geographically, with 66% of ABR coming from North America (60% US, 4% Canada, 2% Mexico), 34% from Europe, and 1% from other regions. Property types are distributed across industrial (38%), warehouse (26%), retail (22%), and other (14%) categories.
The following slide provides a comprehensive overview of the company’s large diversified portfolio:
Growth and Rent Escalations
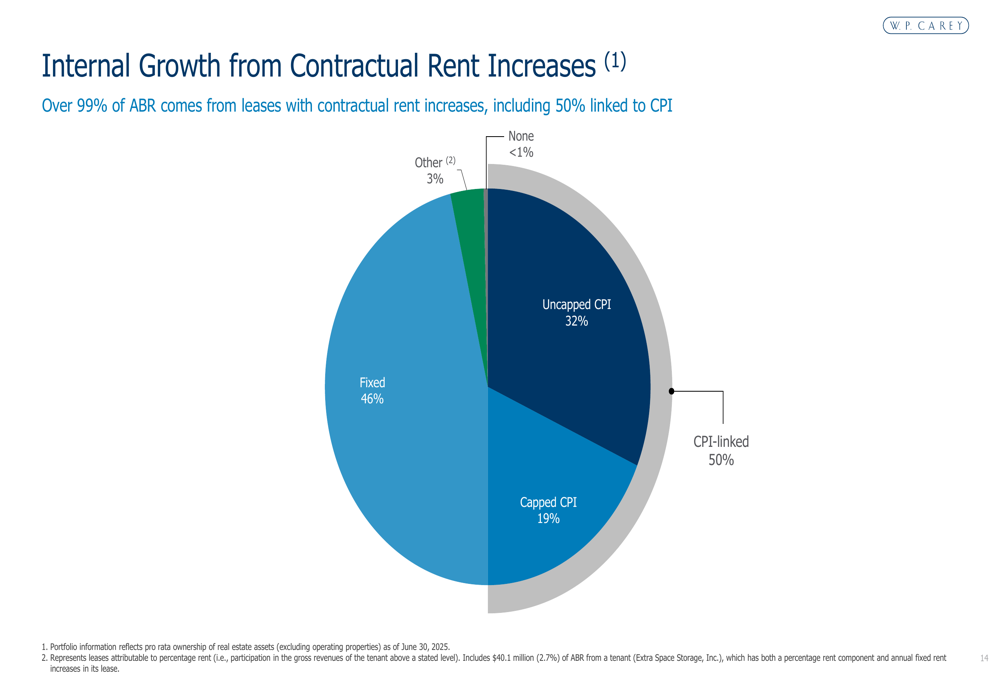
One of W.P. Carey’s key strengths is its contractual rent increases, with over 99% of ABR coming from leases with built-in escalations. The company reported that 50% of these increases are linked to CPI, while 46% are fixed, providing a reliable source of internal growth.
The following chart illustrates the breakdown of contractual rent increases:
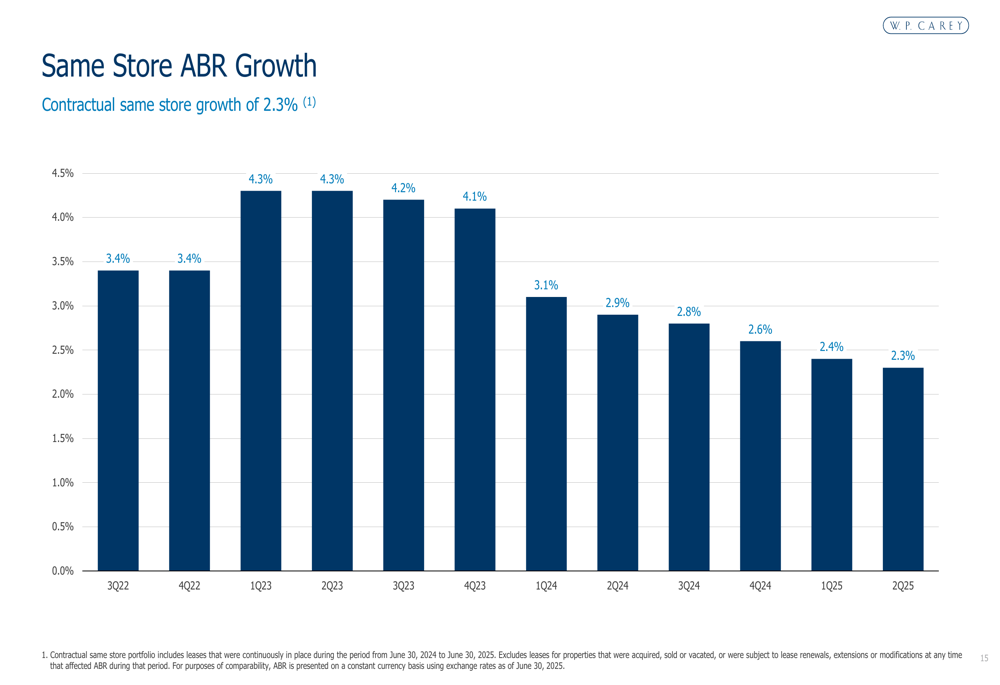
However, the presentation revealed a continuing trend of slowing same-store ABR growth, which has declined from a peak of 4.3% in Q1-Q2 2023 to 2.3% in Q2 2025. This trend aligns with the company’s Q1 2025 earnings report, where W.P. Carey posted mixed results with revenue exceeding expectations at $409.9 million while EPS fell short at $0.57 compared to the forecasted $0.61.
The following chart shows the same-store ABR growth trend over the past three years:
Investment Strategy and Recent Acquisitions
W.P. Carey’s investment strategy focuses on generating attractive risk-adjusted returns by investing in mission-critical assets with strong tenant relationships. The company evaluates transactions based on four key factors: creditworthiness of tenants, criticality of assets, fundamental value of underlying real estate, and transaction structure and pricing.
Recent acquisitions highlighted in the presentation include:
- DBK: 11 industrial properties in Poland for $56 million with a 30-year lease
- Reddy Ice: 59 industrial and warehouse facilities in the US for $136 million with a 20-year lease
- Soteria: An industrial facility in Chattanooga, TN for $20 million with a 15-year lease
The company also showcased several capital investment projects, including:
- Terran Orbital: $14 million redevelopment of an industrial facility in Irvine, CA
- ZF: $45 million redevelopment of a research & development facility in Washington, MI
- Berry Global: $8 million renovation of an industrial facility in Evansville, IN
Balance Sheet and Financial Position
W.P. Carey maintains an investment grade balance sheet with ratings of Baa1 (stable) from Moody’s and BBB+ (stable) from S&P. As of June 30, 2025, the company reported total equity of $13.66 billion and pro rata net debt of $8.80 billion, resulting in a pro rata net debt to adjusted EBITDA ratio of 5.8x.
The following slide provides a comprehensive overview of the company’s balance sheet:
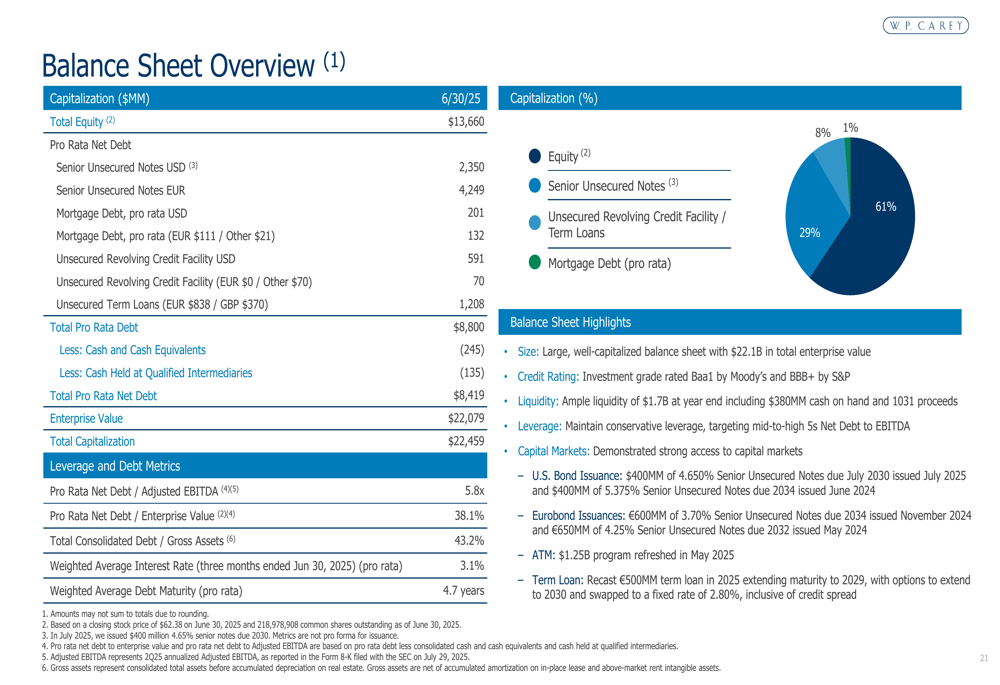
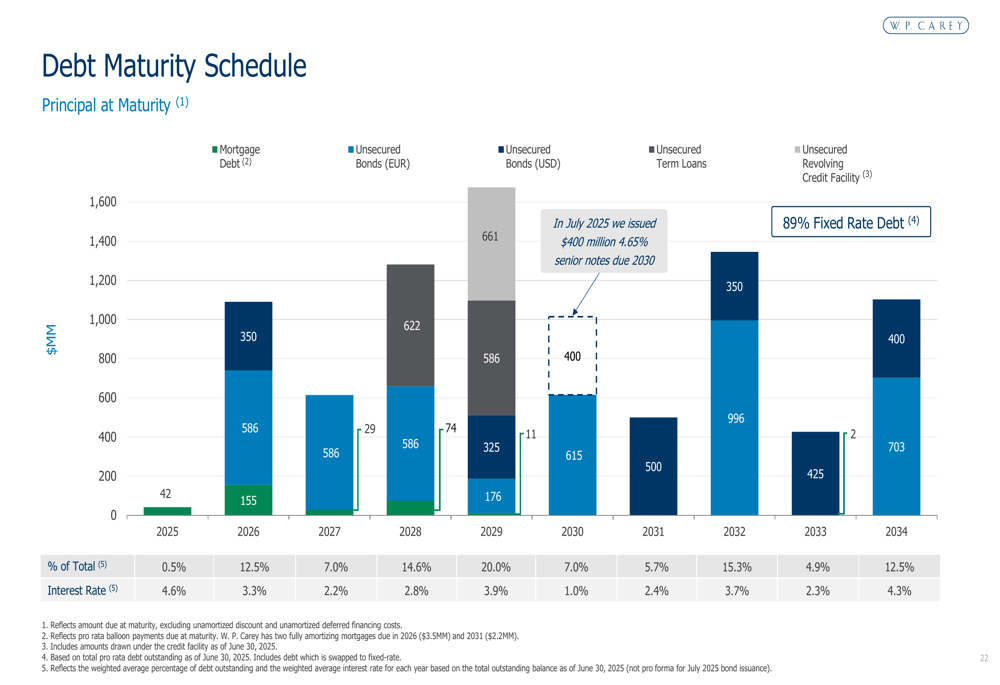
The company’s debt structure is well-managed with a weighted average interest rate of 3.1% and an average debt maturity of 4.7 years. Notably, 89% of the company’s debt is fixed rate, providing stability in the current interest rate environment.
The debt maturity schedule shows a balanced approach with no significant concentration in any single year, as illustrated in the following chart:
W.P. Carey maintains strong compliance with its unsecured bond covenants, with significant headroom across all metrics. Total (EPA:TTEF) leverage stands at 42.1% (versus a 60% requirement), secured debt leverage at 1.2% (versus 40% requirement), and fixed charge coverage at 4.9x (versus 1.5x requirement).
Forward-Looking Statements
The company’s presentation highlighted its ongoing commitment to corporate responsibility, noting an increase in the percentage of leases with green provisions and tenant engagement on sustainability opportunities. W.P. Carey reported 6.1 million square feet of green-certified buildings, with 35% of the portfolio under green lease and 63% of tenants enrolled in electricity usage data reporting.
This aligns with statements from the Q1 2025 earnings call, where CEO Jason Fox emphasized the company’s resilience amid economic uncertainty, stating, "Our portfolio is built to withstand downturns and periods of economic weakness." The company maintained its AFFO guidance range of $4.82 to $4.92 per share for the year and plans to invest $1 billion to $1.5 billion in 2025.
W.P. Carey’s stock closed at $64.03 on July 29, 2025, with a 0.98% increase, reflecting investor confidence in the company’s stable performance despite the gradual slowdown in same-store ABR growth. The stock has shown strong momentum with a 13.84% year-to-date return, trading closer to its 52-week high of $66.10 than its low of $52.91.
Full presentation:
This article was generated with the support of AI and reviewed by an editor. For more information see our T&C.