German construction sector still in recession, civil engineering only bright spot

Introduction & Market Context
Wyndham Hotels & Resorts (NYSE:WH) presented its second quarter 2025 investor presentation on July 23, highlighting the company’s performance and strategic initiatives. The world’s largest hotel franchisor demonstrated resilience in its asset-light business model despite facing RevPAR headwinds, with shares trading at $87.93 after a 2.05% decline on the presentation day.
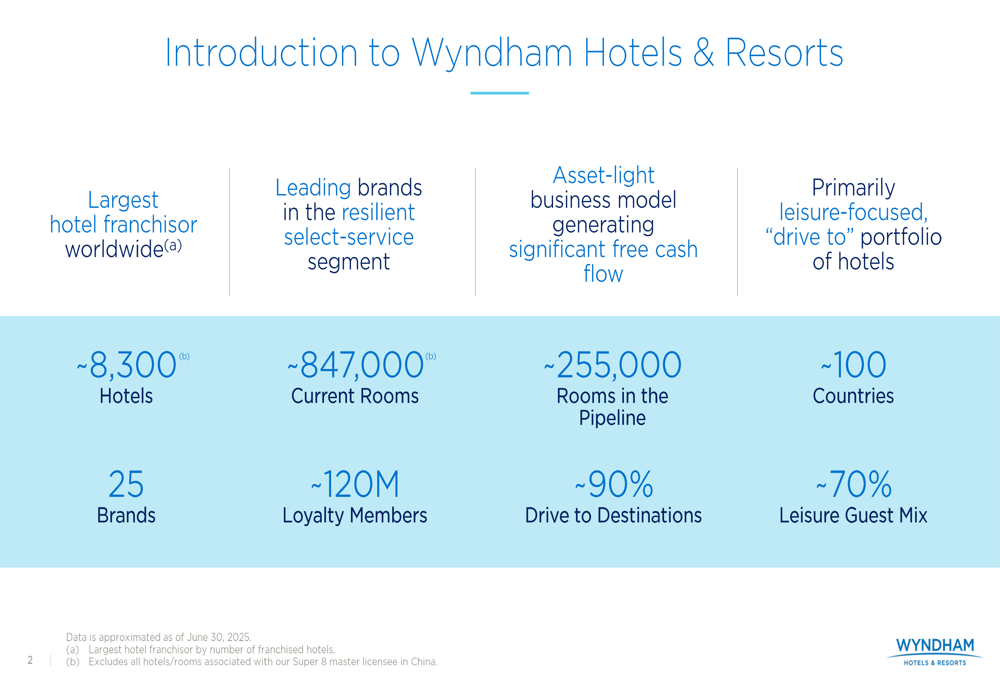
As the leader in the select-service segment with approximately 8,300 hotels across 25 brands, Wyndham continues to leverage its primarily leisure-focused portfolio (70% leisure guest mix) and "drive-to" destinations (90% of properties) to navigate through economic uncertainty.
As shown in the following company overview slide, Wyndham maintains a substantial global footprint with approximately 847,000 rooms and 120 million loyalty members:
Q2 2025 Performance Highlights
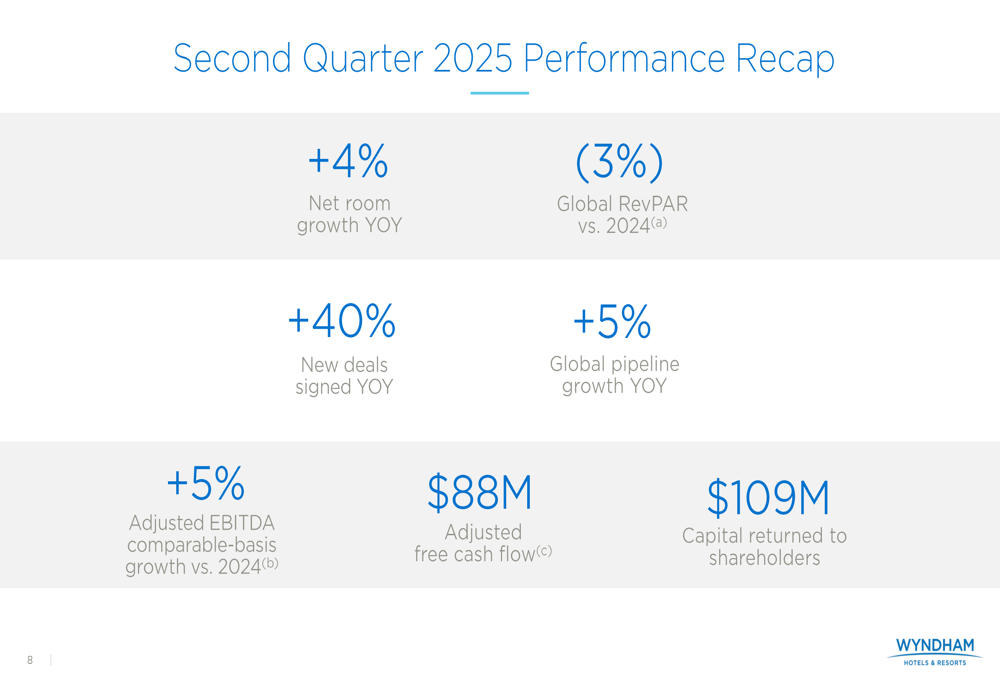
Wyndham’s second quarter results revealed mixed performance with room growth offsetting RevPAR challenges. The company reported a 4% year-over-year net room growth, while global RevPAR declined by 3% compared to 2024. Despite this headwind, Wyndham achieved 5% adjusted EBITDA growth on a comparable basis and generated $88 million in adjusted free cash flow.
The company returned $109 million to shareholders during the quarter, continuing its commitment to shareholder value creation. New development momentum remained strong with a 40% year-over-year increase in new deals signed and 5% growth in the global development pipeline.
The following slide summarizes Wyndham’s second quarter 2025 performance metrics:
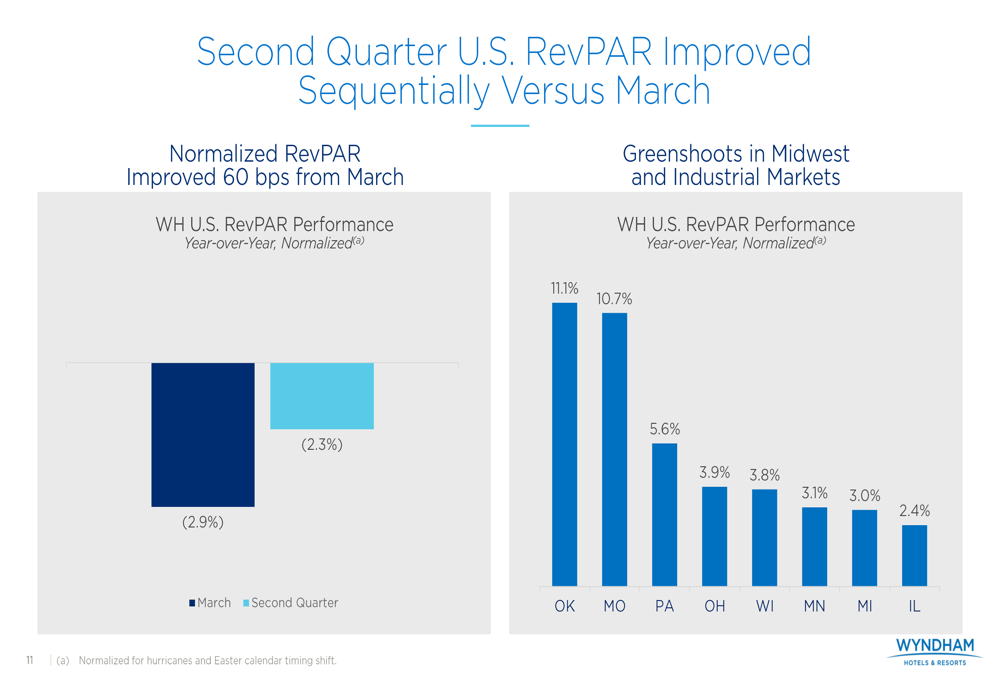
The company’s U.S. RevPAR showed sequential improvement from March, with normalized RevPAR improving by 60 basis points from a 2.9% decline in March to a 2.3% decline in the second quarter. Several Midwest and industrial markets demonstrated particular strength, with Oklahoma, Missouri, and Pennsylvania showing positive year-over-year normalized RevPAR growth of 11.1%, 10.7%, and 5.6%, respectively.
Growth Strategy & Pipeline
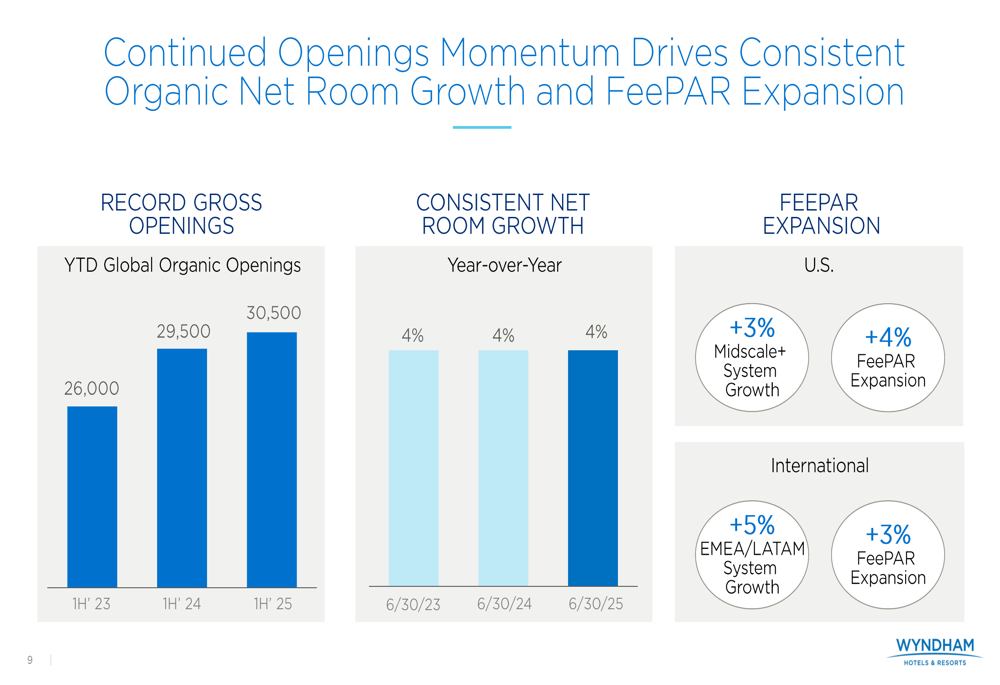
Wyndham’s growth strategy continues to focus on consistent organic net room growth and fee revenue per available room (FeePAR) expansion. The company achieved record gross openings in the first half of 2025 with 30,500 rooms, up from 29,500 in the first half of 2024 and 26,000 in the same period of 2023.
The following chart illustrates this openings momentum and consistent net room growth:
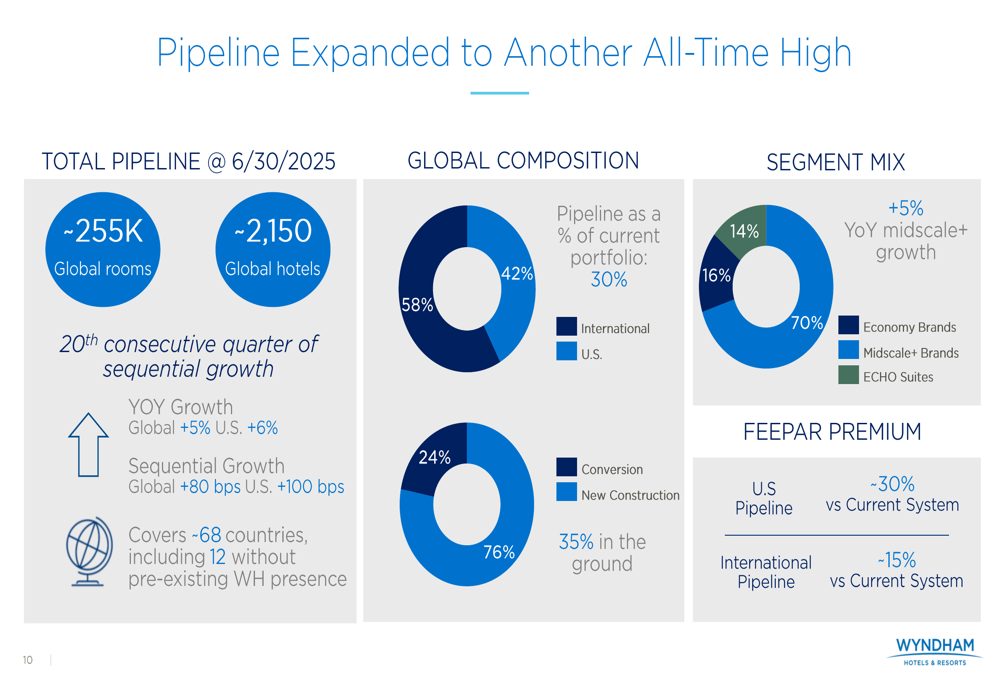
The company’s development pipeline reached approximately 255,000 rooms across about 2,150 hotels in 68 countries, marking the 20th consecutive quarter of sequential growth. The pipeline expanded by 5% globally and 6% in the U.S. year-over-year. International markets represent 58% of the pipeline, with U.S. properties accounting for the remaining 42%. Notably, 35% of the pipeline projects are already under construction.
The pipeline’s composition reflects Wyndham’s strategic focus, with 70% in economy brands, 16% in midscale and above segments, and 14% in the company’s ECHO Suites extended stay brand. The pipeline is expected to deliver significant FeePAR premiums of approximately 30% versus the current U.S. system and 15% versus the current international system.
For 2025, Wyndham projects system-wide room growth of 4.0% to 4.6%, with global additions expected to increase by approximately 8% and a retention rate exceeding 96%.
Technology & Innovation Initiatives
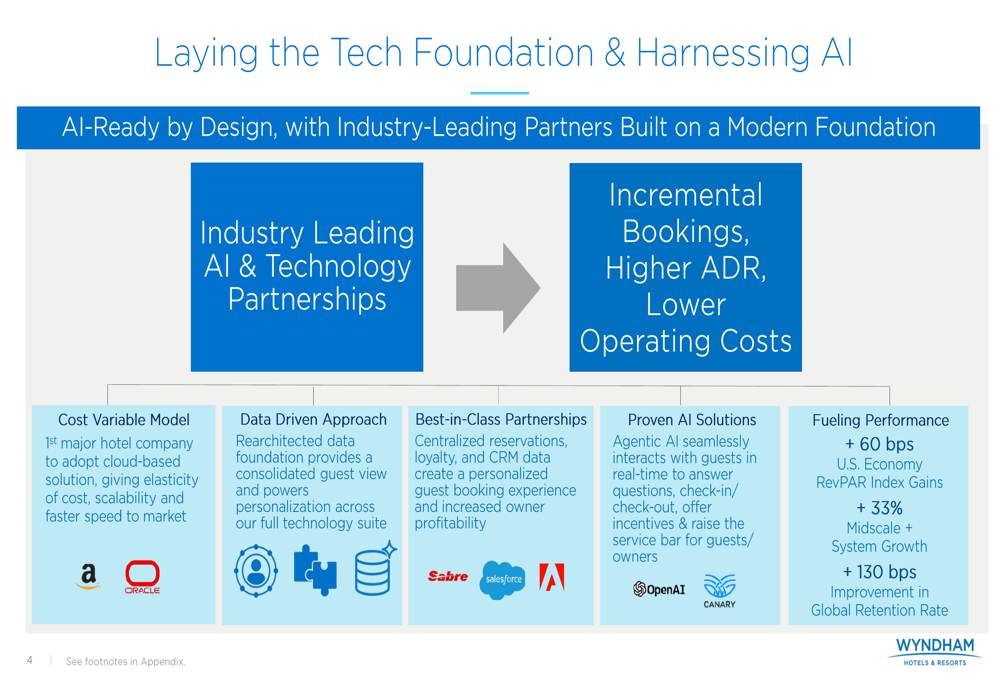
A key focus of Wyndham’s strategy is leveraging technology and artificial intelligence to enhance owner operations and guest experiences. The company has established partnerships with industry leaders including Amazon (NASDAQ:AMZN), Oracle (NYSE:ORCL), Sabre (NASDAQ:SABR), Salesforce (NYSE:CRM), Adobe (NASDAQ:ADBE), OpenAI, and Canary to build an AI-ready foundation.
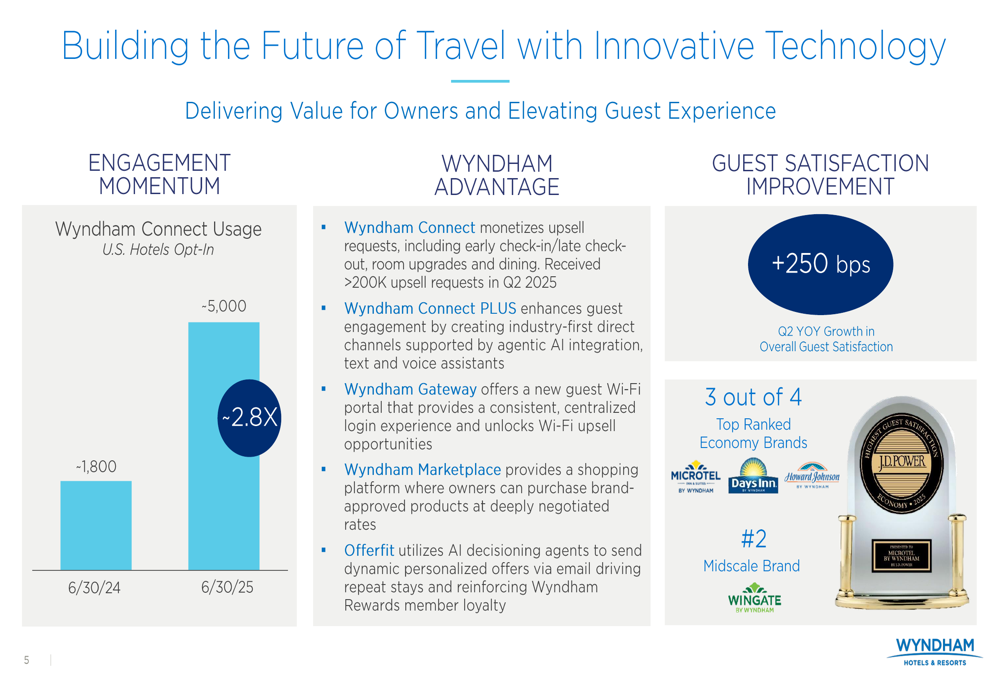
The following slide illustrates how these technology investments are driving performance metrics:
Wyndham’s digital engagement has shown significant momentum, with Wyndham Connect usage in U.S. hotels growing from approximately 1,800 in June 2024 to about 5,000 in June 2025, representing a 2.8x increase. These technological initiatives have contributed to a 250 basis point year-over-year improvement in overall guest satisfaction in Q2 2025.
Financial Outlook & Capital Allocation
For the full year 2025, Wyndham reaffirmed its adjusted EBITDA outlook of $730-745 million, representing 5-7% growth on a comparable basis. The company expects to maintain its strong adjusted free cash flow conversion of approximately 57%.
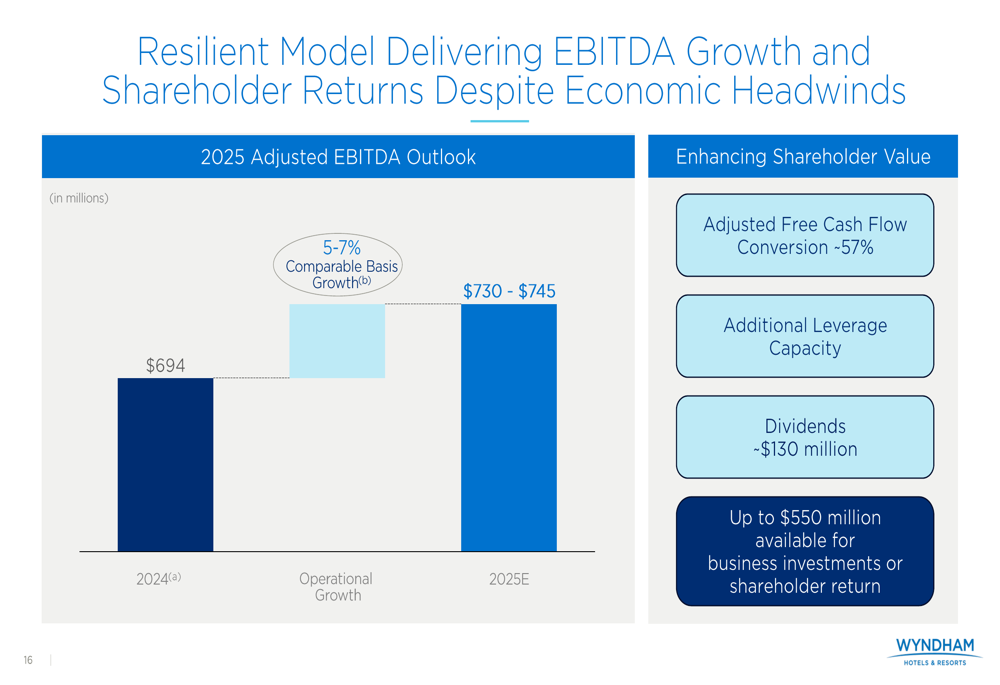
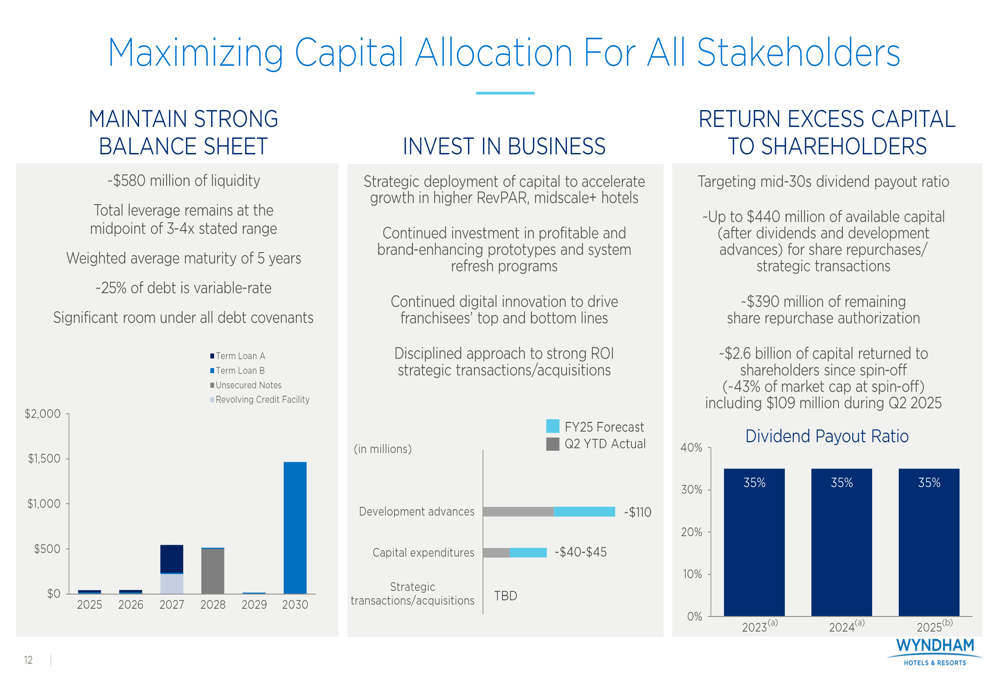
Wyndham’s capital allocation strategy focuses on maintaining a strong balance sheet while investing in growth and returning excess capital to shareholders. The company reported approximately $580 million in liquidity, with total leverage at the midpoint of its 3-4x stated range. Wyndham is targeting a mid-30s dividend payout ratio and has approximately $440 million available for share repurchases or strategic transactions, with about $390 million remaining under its current share repurchase authorization.
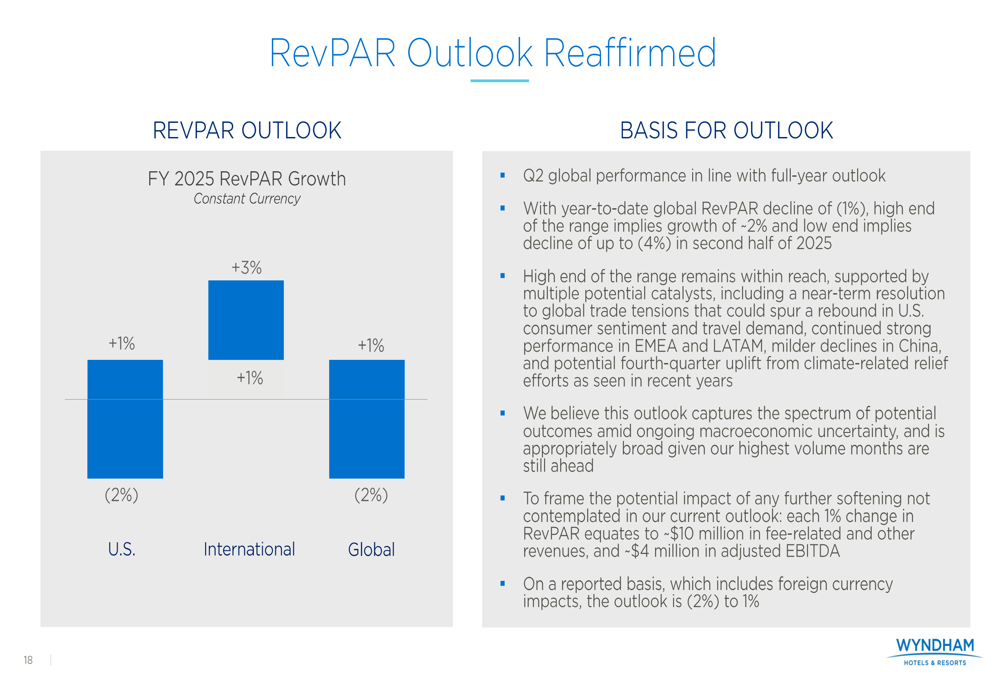
The company’s RevPAR outlook for 2025 remains unchanged, with expectations of a 2% decline in the U.S., international performance ranging from a 1% decline to 1% growth, and global RevPAR between a 2% decline and 1% growth. With year-to-date global RevPAR decline of 1%, the high end of the range implies growth of approximately 2% in the second half of 2025, while the low end suggests a decline of up to 4%.
Business Model Resilience
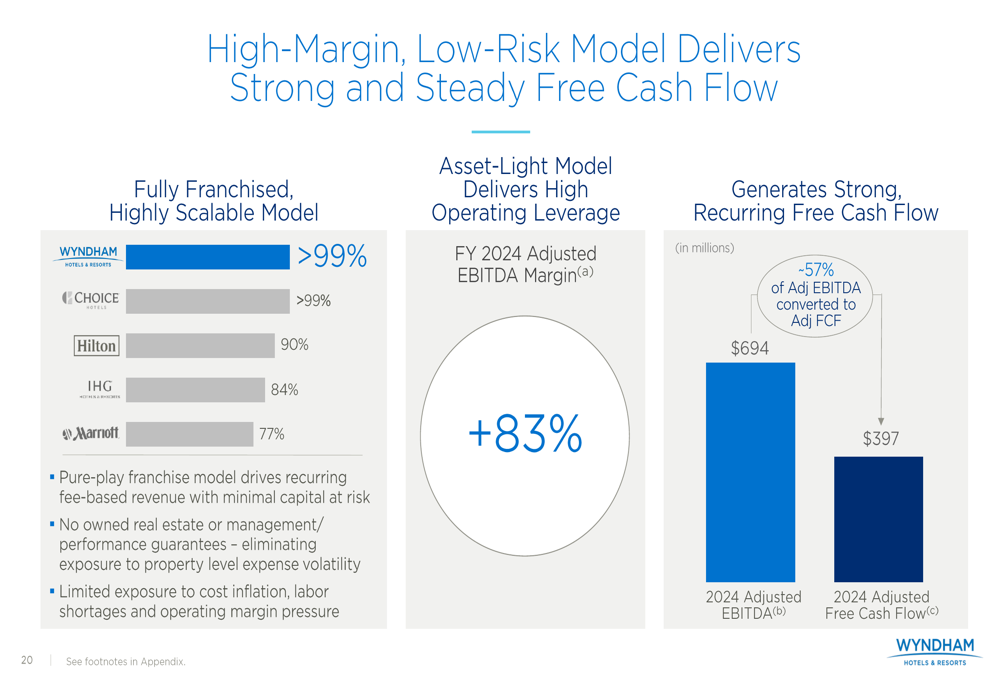
Wyndham emphasized the resilience of its business model in the face of economic uncertainty. The company’s fully franchised, asset-light approach delivers high operating leverage, with an adjusted EBITDA margin of 83% for fiscal year 2024. This model generates strong recurring free cash flow with minimal capital at risk.
The company highlighted several factors that contribute to its performance during softer economic cycles, including its asset-light and cash-generative structure, proven ability to leverage conversions to drive growth, ancillary fee growth that is largely independent of RevPAR performance, and RevPAR outperformance driven by durable demand, drive-to footprint, and trade-down benefits.
Wyndham’s 2025 key priorities include growing system-wide rooms by 4.0% to 4.6%, continued investment in brands targeting high FeePAR additions, capitalizing on opportunities created through U.S. government investment, establishing a market-leading position in the extended stay segment, capturing ancillary revenue growth opportunities, improving franchisees’ top-line performance, and maintaining a disciplined approach to capital allocation.
As Wyndham navigates through 2025, its asset-light franchise model and strategic focus on technology and development appear well-positioned to deliver continued growth despite the challenging RevPAR environment. The company’s ability to generate strong free cash flow while expanding its global footprint remains a cornerstone of its investment thesis.
Full presentation:
This article was generated with the support of AI and reviewed by an editor. For more information see our T&C.