Intel stock spikes after report of possible US government stake

Introduction & Market Context
XPO Inc (NYSE:XPO) released its Q1 2025 investor presentation on April 30, 2025, highlighting a 9% year-over-year increase in operating income to $151 million. The transportation and logistics provider’s stock rose 2.69% in premarket trading to $100.05, building on momentum from its strong Q4 2024 performance when shares surged 9.54% following earnings that exceeded expectations.
The Q1 results demonstrate XPO’s continued execution of its long-term strategy focused on service excellence, network investment, yield growth, and cost efficiencies in its core North American less-than-truckload (LTL) business, which operates in what the company describes as a "$53 billion bedrock industry for the US economy."
Quarterly Performance Highlights
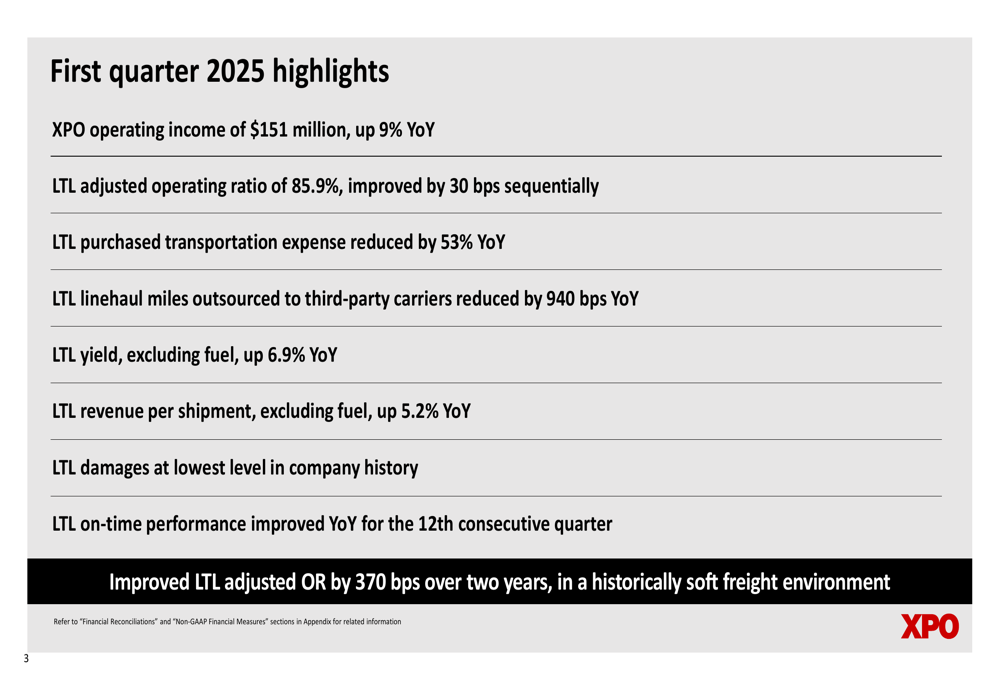
XPO reported Q1 2025 revenue of $1.95 billion, with operating income of $151 million and adjusted EBITDA of $278 million. The company posted adjusted diluted earnings per share of $0.73 and generated $142 million in cash flow from operating activities.
The North American LTL segment, XPO’s largest business unit, contributed $1.17 billion in revenue and $250 million in adjusted EBITDA, while maintaining an adjusted operating ratio of 85.9%, an improvement of 30 basis points sequentially. The European Transportation segment generated $782 million in revenue and $32 million in adjusted EBITDA.
As shown in the following summary of first quarter highlights:
Strategic Initiatives
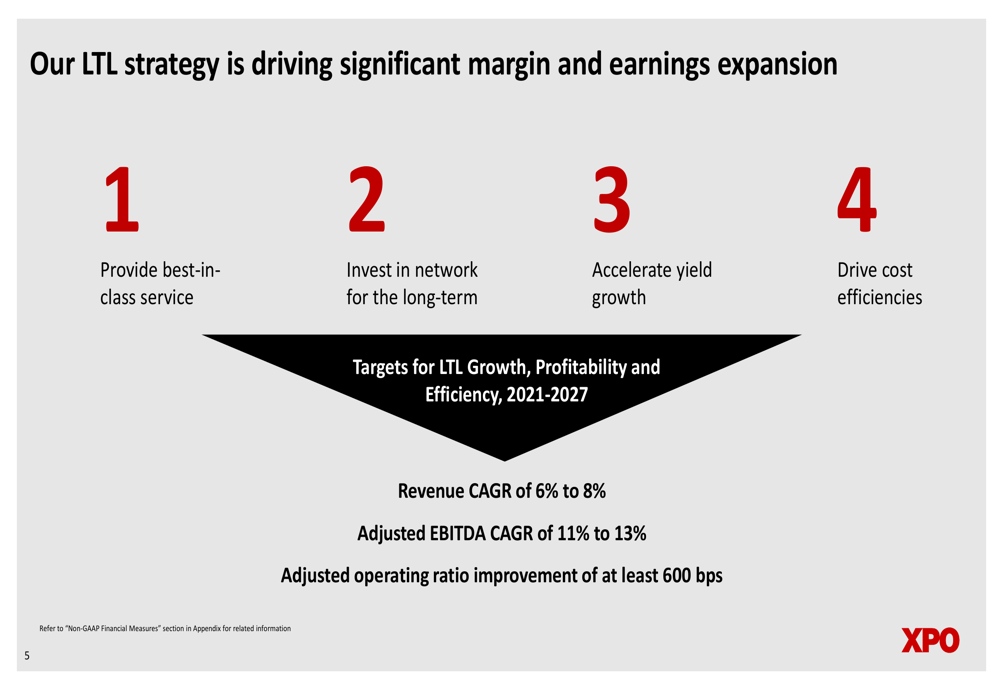
XPO’s presentation reaffirmed its LTL strategy built around four key pillars designed to drive significant margin and earnings expansion through 2027. The company is targeting revenue CAGR of 6-8%, adjusted EBITDA CAGR of 11-13%, and an improvement in adjusted operating ratio of at least 600 basis points from 2021 to 2027.
The strategy visualization shows the interconnected nature of XPO’s four strategic levers:
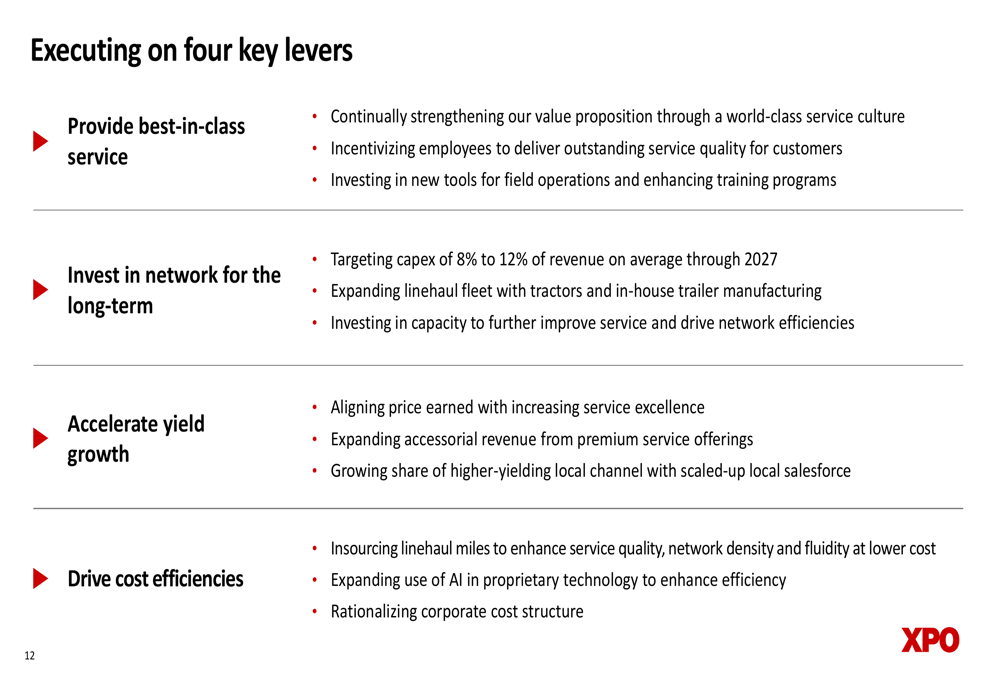
The company provided detailed initiatives under each strategic pillar, highlighting specific actions to improve service quality, expand network capacity, accelerate yield growth, and drive cost efficiencies:
Operational Improvements
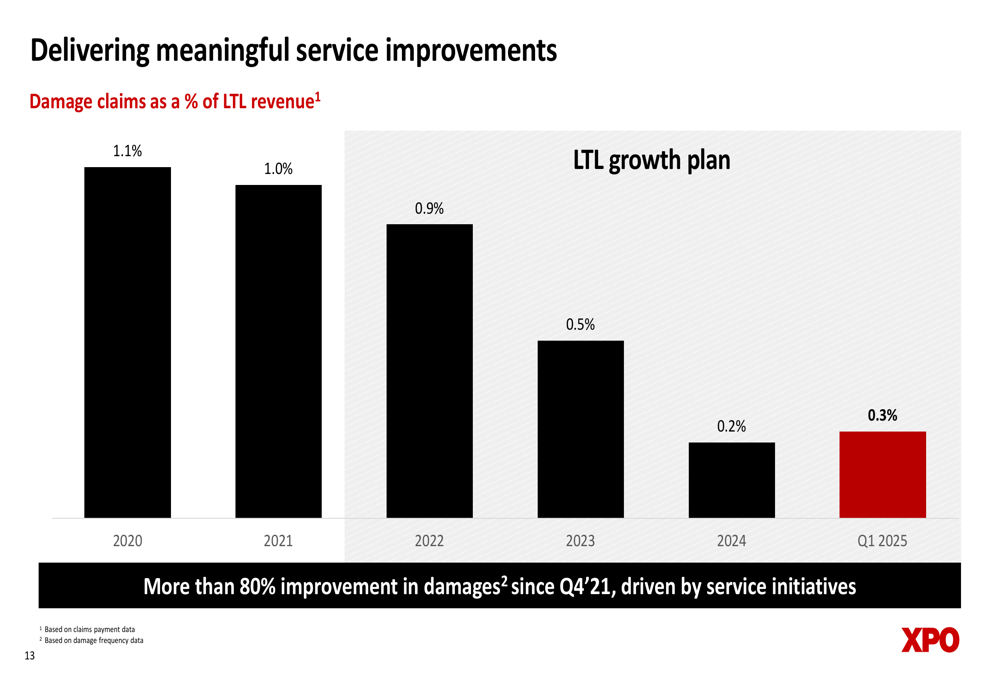
XPO has made substantial progress in improving service quality, as evidenced by the dramatic reduction in damage claims as a percentage of LTL revenue. The company reported that damage claims reached their lowest level in company history during Q1 2025, with more than 80% improvement since Q4 2021.
The following chart illustrates this trend:
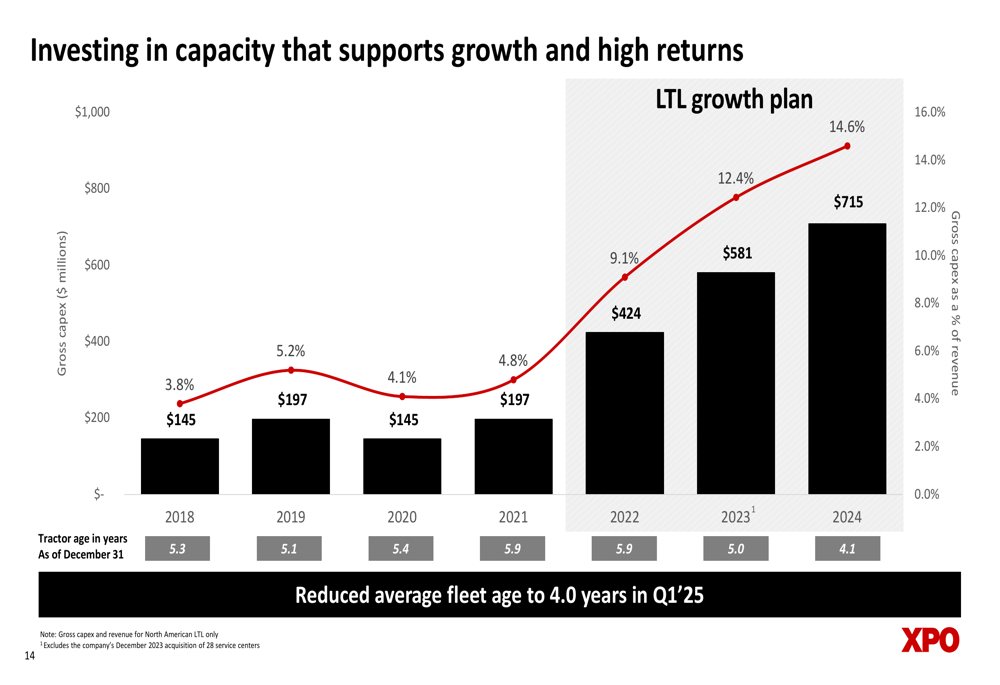
Simultaneously, XPO has been aggressively investing in its network capacity, with gross capital expenditures rising from 3.8% of revenue in 2018 to 14.6% in 2024. The company plans to maintain capex at 8-12% of revenue through 2027 to support long-term growth and efficiency improvements.
The capital investment strategy has enabled XPO to reduce its average fleet age to 4.0 years in Q1 2025, as shown in this chart:
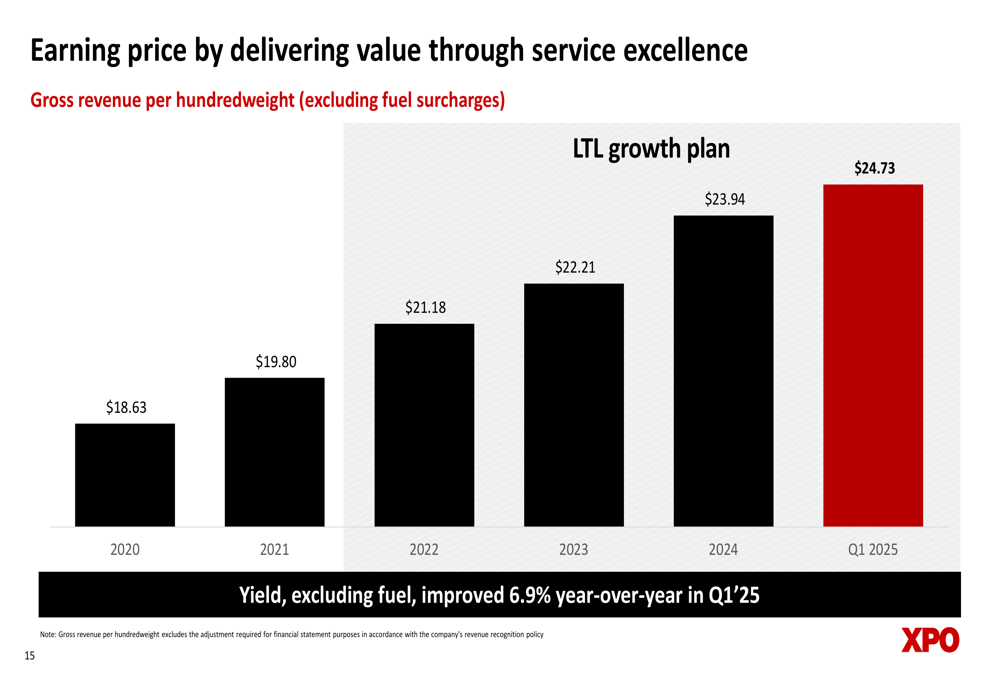
A key component of XPO’s strategy is "earning price by delivering value through service excellence." The company reported that yield (gross revenue per hundredweight excluding fuel surcharges) improved 6.9% year-over-year in Q1 2025, continuing a multi-year upward trend:
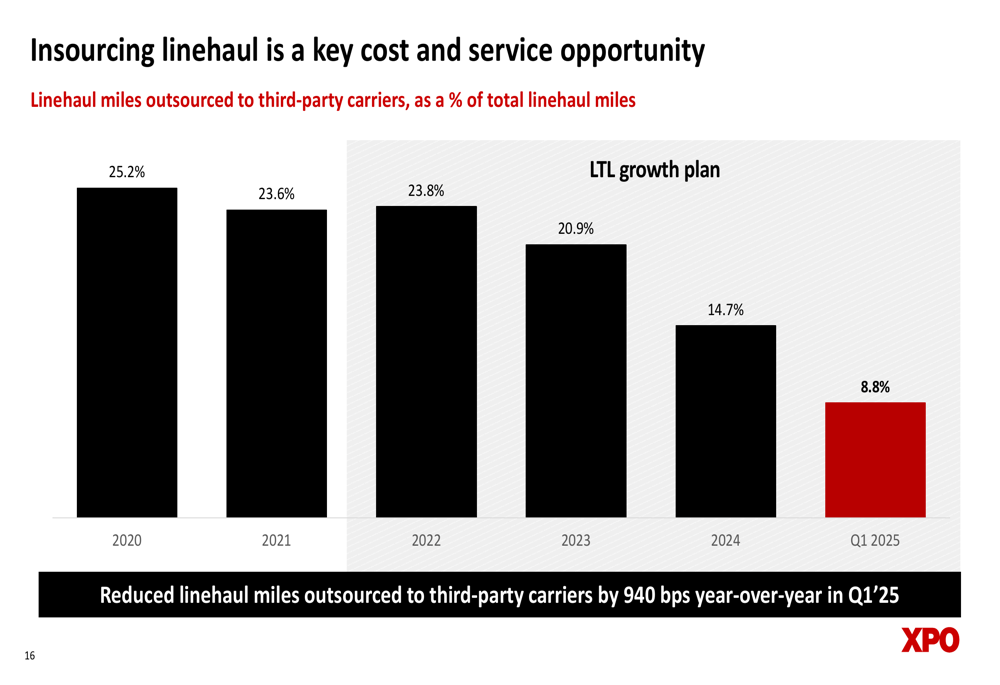
Perhaps most notably, XPO has made significant progress in reducing its reliance on third-party carriers for linehaul transportation. The percentage of linehaul miles outsourced has decreased from 25.2% in 2020 to just 8.8% in Q1 2025, representing a 940 basis point reduction year-over-year:
Competitive Industry Position
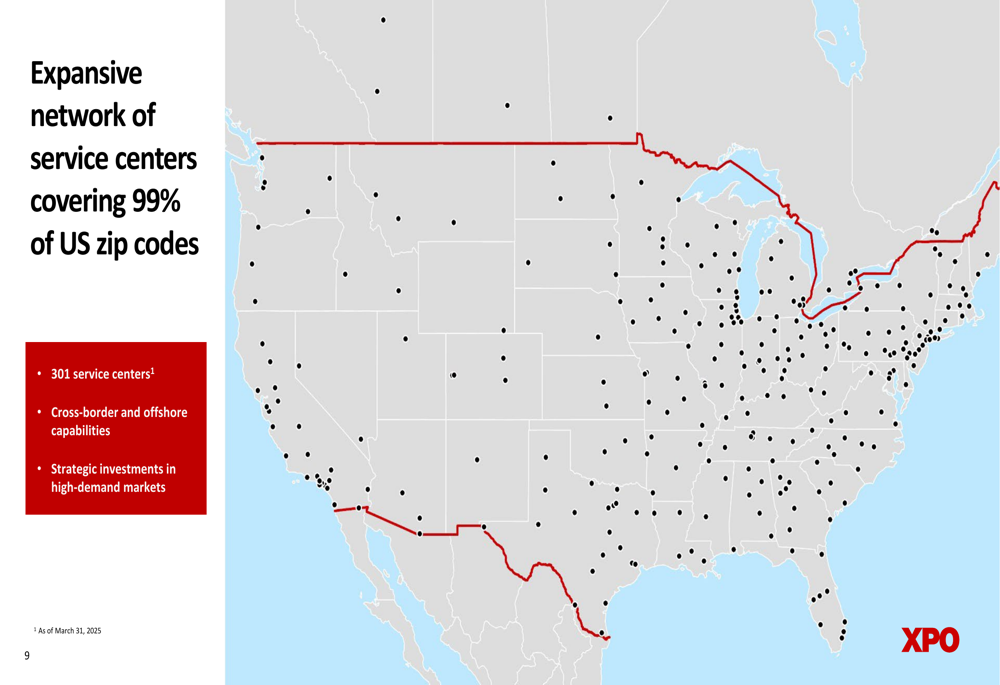
XPO maintains a strong position in the North American LTL market as the fourth largest carrier by 2024 revenue, with a 9% industry share. The company operates 301 service centers covering 99% of U.S. zip codes, as illustrated in this network map:
The company serves approximately 36,000 customers, including many blue-chip corporations with long-standing relationships. The average tenure of XPO’s top 10 customers is 18 years, demonstrating the stability of its customer base:
Forward-Looking Statements
Looking ahead, XPO expects to generate 11-13% adjusted EBITDA CAGR in its North American LTL business from 2021 to 2027, driven by three main components:
1. Volume gains and pricing over inflation: 6-7%
2. Operating costs optimized through technology: 3-4%
3. Linehaul insourced from third parties: 2%
For the full year 2025, XPO’s planning assumptions include:
- Total (EPA:TTEF) company gross capex of $600-700 million
- Interest expense of $220-230 million
- Adjusted effective tax rate of 24-25%
- Diluted share count of 120 million
These targets align with CEO Mario Harrick’s statement from the Q4 2024 earnings call that "We expect to deliver significant margin expansion and earnings growth this year," though investors should note that the Q1 2025 adjusted EPS of $0.73 represents a sequential decline from the $0.89 reported in Q4 2024, potentially reflecting seasonal patterns in the transportation industry.
As XPO continues executing its strategic initiatives in what it describes as a "historically soft freight environment," the company’s focus on service quality improvements, yield growth, and cost efficiency appears to be yielding results that position it for long-term growth in the competitive LTL market.
Full presentation:
This article was generated with the support of AI and reviewed by an editor. For more information see our T&C.