Praxis Precision Medicines general counsel sells $4.8m in shares
- Stocks have rallied since June, aided by significant capital inflows
- But some stocks have lagged behind
- Let's take a look at three such stocks trading below their target prices with strong fundamentals and technicals
- InvestingPro Summer Sale is back on: Check out our massive discounts on subscription plans!
State Street Global Advisors recently reported a staggering inflow of approximately $53 billion into equity ETFs during June. This influx represents the highest amount of money flowing into these funds since October of the previous year.
As expected, several stocks have exhibited robust growth since the beginning of June, based on the latest data as of July 10. Let's take a look at some notable performers:
- Carnival (NYSE:CCL) +71%
- Norwegian Cruise Line (NYSE:NCLH) +51%
- Tesla (NASDAQ:TSLA) +32%
- Delta Air Lines (NYSE:DAL) +33%
- United Rentals (NYSE:URI) +33%
- Royal Caribbean Cruises (NYSE:RCL) +27%
- Ford (NYSE:F) +26%
Furthermore, considering the overall performance this year, the following stocks have emerged as top performers:
- Nvidia (NASDAQ:NVDA) +200%
- Meta (NASDAQ:META) +157%
- Carnival +134%.
- Tesla +113%
- Royal Caribbean +110%
But today, we will focus on three U.S. stocks that have lagged behind the S&P 500 and Nasdaq but are believed by Wall Street to have strong potential in the second half of this year.
1. AT&T
AT&T Inc (NYSE:T), based in Dallas, Texas, is the world's largest telecommunications company, providing 4G and 5G services. It began as Southwestern Bell Telephone Company, a subsidiary of Bell Telephone Company, founded by Alexander Graham Bell in 1880.
Unfortunately, AT&T faced some challenges at the beginning of the year, experiencing a slowdown in subscriber growth and sales figures falling short of expectations. However, the Chief Financial Officer (CFO) recently expressed optimism about the company's turnaround.
During the earnings announcement on April 20, AT&T delivered better-than-expected results, surpassing earnings per share projections by 2.1%. The subsequent earnings are scheduled to be reported on July 26.
AT&T pays a quarterly dividend of $0.2775 per share, resulting in a yearly payout of $1.11 per share. This translates to a dividend yield of 7.29%.
Analysts have provided 14 ratings for AT&T, with only 2 being sell ratings. The majority of experts view the company favorably.
According to InvestingPro models, AT&T demonstrates potential with a target price of $19.76. Moreover, the market consensus is even more bullish, projecting a target price of $20.
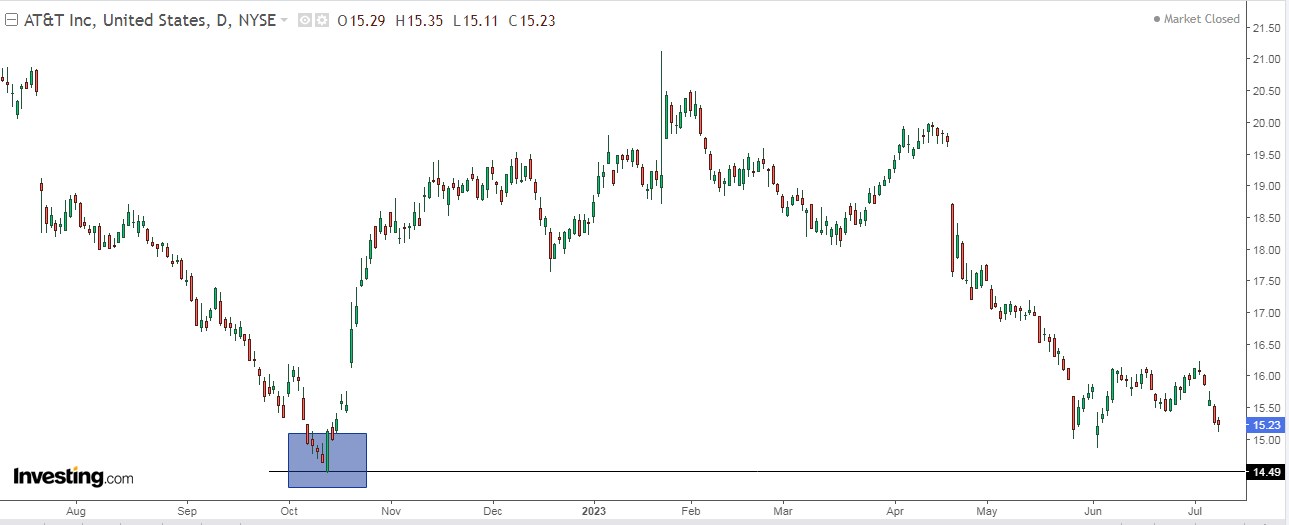
From a technical analysis perspective, there is strong support for AT&T at $14.49, with a smaller support level previously observed at $15.08.

2. Occidental Petroleum
Occidental Petroleum Corporation (NYSE:OXY), based in Houston, actively explores and exploits oil resources as its primary focus. It is a multinational firm interested in other energy forms like coal and mineral production. Due to the weak oil demand, the stock has not performed well this year.
Warren Buffett, a prominent supporter, has shown confidence in the oil company by acquiring a significant number of shares. He purchased during the decline and now holds a quarter of the outstanding shares.
This is not a recent development, as Buffett has bought Occidental Petroleum shares over the past few months. In late June, he invested $122.1 million to acquire over 2.1 million shares at an average price of $57.
Buffett's company now possesses 224.1 million shares of Occidental Petroleum, equivalent to 25.1% of its outstanding shares. This investment ranks as the sixth-largest stake in Buffett's portfolio, accounting for 3.5% of his holdings.
On May 9, the company reported earnings, slightly below expectations. The upcoming results will be presented on August 2.
It pays a quarterly dividend of $0.18, resulting in a $0.72 per share payout for the year, yielding 1.19%. And there are 36 ratings for the company, with 10 being buy ratings, 15 as hold, and only 1 as sell.
According to market consensus, it has a potential value of $67.83.
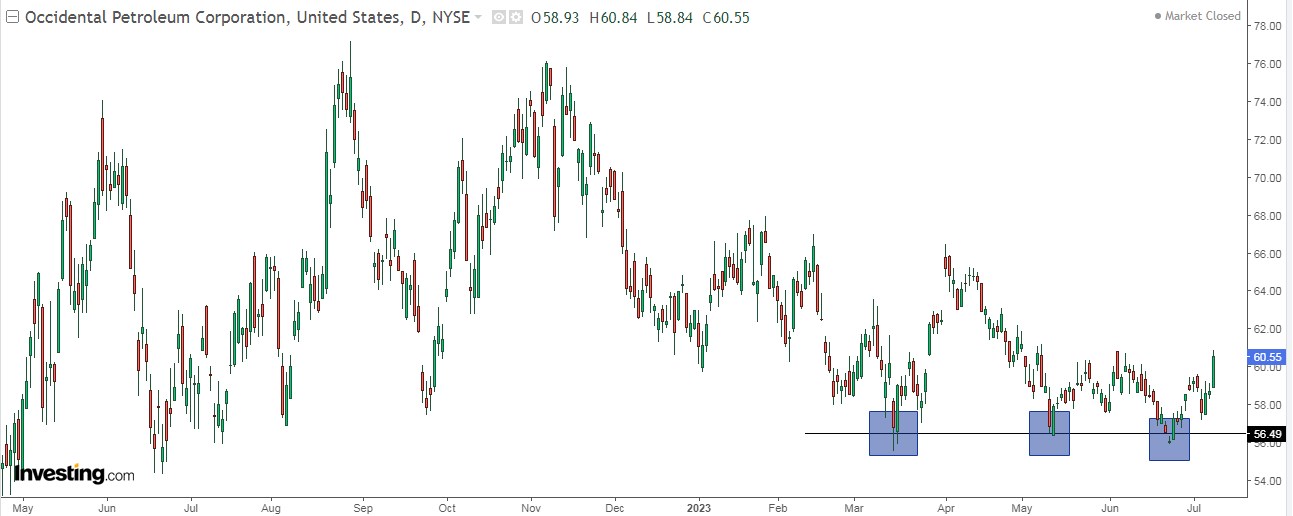
Meanwhile, the stock has a compelling double support level, with two close support levels at $54.53-56.02.

3. Cisco
Cisco (NASDAQ:CSCO), headquartered in San Jose, California, was established in 1984 by two computer scientists from Stanford University. The company specializes in interconnecting computer and communications networks, establishing its dominance in the field and essentially creating its own standard for telecommunications networks.
Cisco has revealed its plans to open a new chip design center in Spain, expanding its operations.
In terms of financial performance, the company delivered impressive earnings on May 17, surpassing earnings per share and revenue expectations by 3.2% and 1.5%, respectively. The upcoming results, scheduled for August 16, are anticipated to be even better.
The company provides a quarterly dividend of $0.39 per share, resulting in a full-year payout of $1.56 per share, with a yield of 3%. According to InvestingPro models, Cisco exhibits potential with a $60-62 target range.
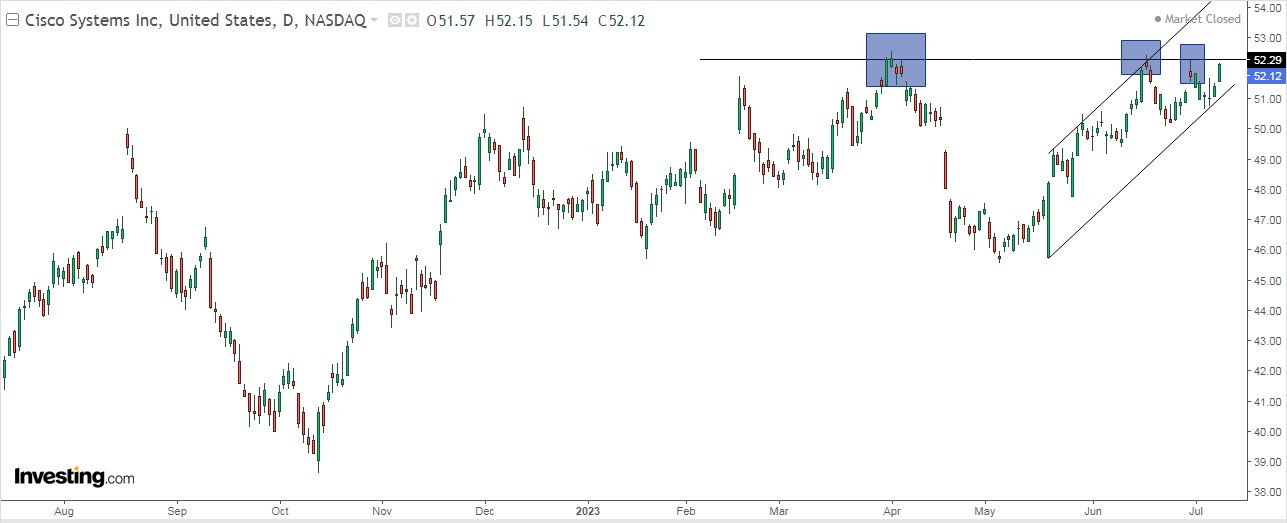
Currently, the stock is facing resistance at $52.31, which it has not yet been able to overcome. However, once it surpasses this level, it will generate a new signal of strength, indicating a positive trend.

***
Access first-hand market data, factors affecting stocks, and comprehensive analysis. Take advantage of this opportunity by subscribing and unlocking the potential of InvestingPro to enhance your investment decisions.
And now, you can purchase the subscription at a fraction of the regular price. Our exclusive summer discount sale has been extended!
InvestingPro is back on sale!
Enjoy incredible discounts on our subscription plans:
- Monthly: Save 20% and get the flexibility of a month-to-month subscription.
- Annual: Save an amazing 50% and secure your financial future with a full year of InvestingPro at an unbeatable price.
- Bi-Annual (Web Special): Save an amazing 52% and maximize your profits with our exclusive web offer.
Don't miss this limited-time opportunity to access cutting-edge tools, real-time market analysis, and expert opinions.
Join InvestingPro today and unleash your investment potential. Hurry, the Summer Sale won't last forever!
Disclaimer: This article is written for informational purposes only; it is not intended to encourage the purchase of assets in any way, nor does it constitute a solicitation, offer, recommendation, advice, counseling, or recommendation to invest. We remind you that all assets are considered from different perspectives and are extremely risky, so the investment decision and the associated risk are the investor's own.

