SoFi stock falls after announcing $1.5B public offering of common stock
-
Bitcoin's recent climb to new highs this week, following its breakout past November 2021's peak, has sparked optimism across the cryptocurrency market.
-
Altcoins are experiencing significant surges within short timeframes, signaling a potential bullish phase in the market, as investor interest in the crypto sector intensifies.
-
Ethereum's journey toward $5,000 faces a critical juncture, while (Ripple) may be poised for a major breakout, and Immutable (IMX) emerges as a key player in the NFT and Web3 gaming sectors.
-
Invest like the big funds for less than $9 a month with our AI-powered ProPicks stock selection tool. Learn more here>>
Bitcoin has been making new highs since it surpassed its November 2021 peak last week. This bullish trend in the leading cryptocurrency continues to positively influence the entire market.
Examining the current surges in altcoins, the substantial surges within short timeframes for some altcoins are crucial indicators of the market entering a bullish phase.
As observed in previous bullish periods, investors showed heightened interest in the crypto sector during these times.
Positive developments for crypto projects are now being valued much more highly compared to normal market conditions.
Additionally, the developments that sparked the bullish trend for Bitcoin and Ethereum continue to drive demand for sub-sectors within the crypto industry.
The cryptocurrency market capitalization has reached $2.69 trillion today, standing about 11% below its peak of $3 trillion in November 2021.
If the current trend in the global economy persists and inflows into Bitcoin-focused funds extend to other altcoins, we may witness the total value surpassing $3 trillion, potentially reaching a new peak in the $4 trillion range.
However, when examining the crypto market excluding Bitcoin and Ethereum, it appears to have a more volatile nature.
Ethereum, with a market capitalization of $770 billion, is approximately 50% below its recent peak. This suggests that there is still significant upside potential in the market.
In today's analysis, we will delve into Ethereum, Ripple, which has shown recent movement, and IMX/USD, which is striving to reach new highs.
Ethereum at the last hurdle before $5,000
Ethereum has averaged weekly gains over 10% since the first week of February.
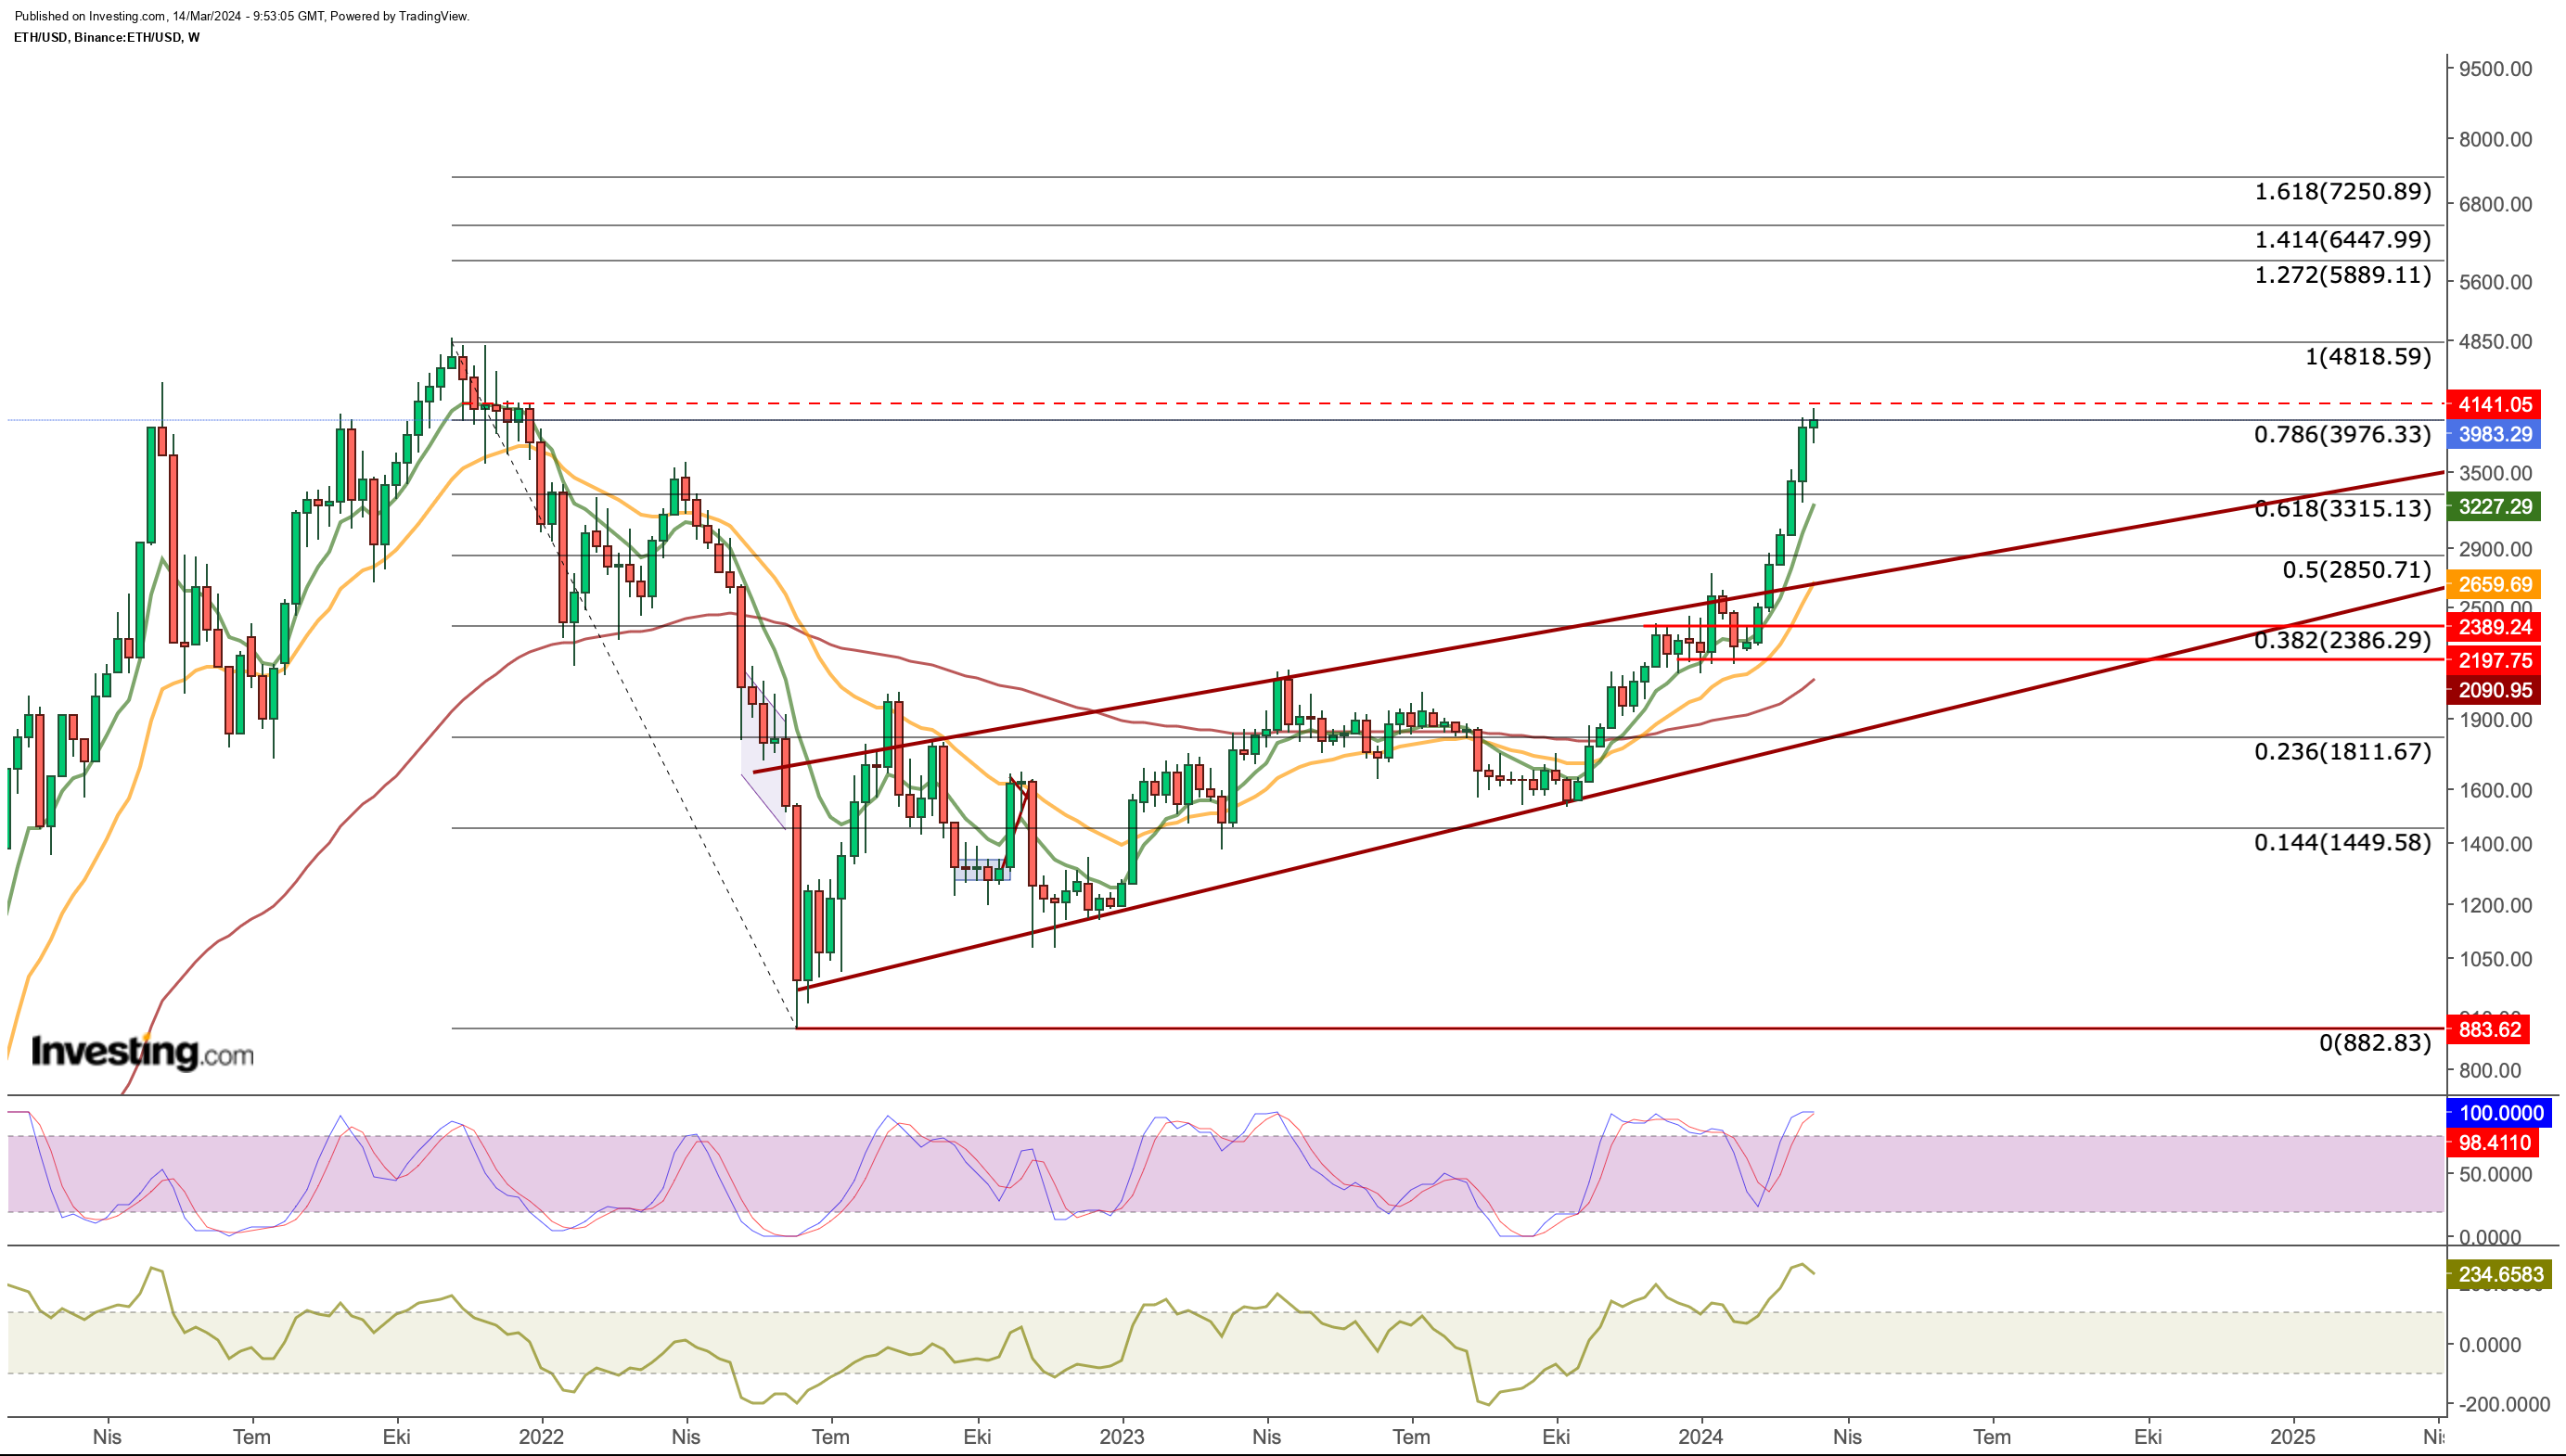
The price of Ethereum, which we track on the weekly chart, showed signs of a slowdown at $3,975, which corresponds to Fib 0.786 relative to its recent long-term bearish momentum. This region caused some reduction in Ethereum's bullish momentum as the end of the week approached.
In the current situation, the range of $ 3,975 - $ 4,150 will be followed as a critical resistance point. In case of daily closes above this area, we can see that Ethereum can quickly surpass its last peak at $ 4,880 and head towards the Fibonacci expansion level starting at $ 5,900.
If the weekly close comes below $ 3,975, it may create short-term pressure on Ethereum. In such a case, $ 3,830 may be the first support in a possible pullback, and then a decline to $ 3,650 may be reasonable.
Below the second support area, we can see that ETH can sag up to $ 3,300. However, the current technical outlook shows that the upward trend is maintained. In this case, the resistance area towards $ 4,150 will be closely monitored.
Ripple may be on the verge of an important breakout
XRP can often chart differently among high-market-cap cryptocurrencies due to its more centralized nature and Ripple legal troubles.

XRP's long-term chart also shows that the cryptocurrency may have made a significant breakthrough with this week's jump.
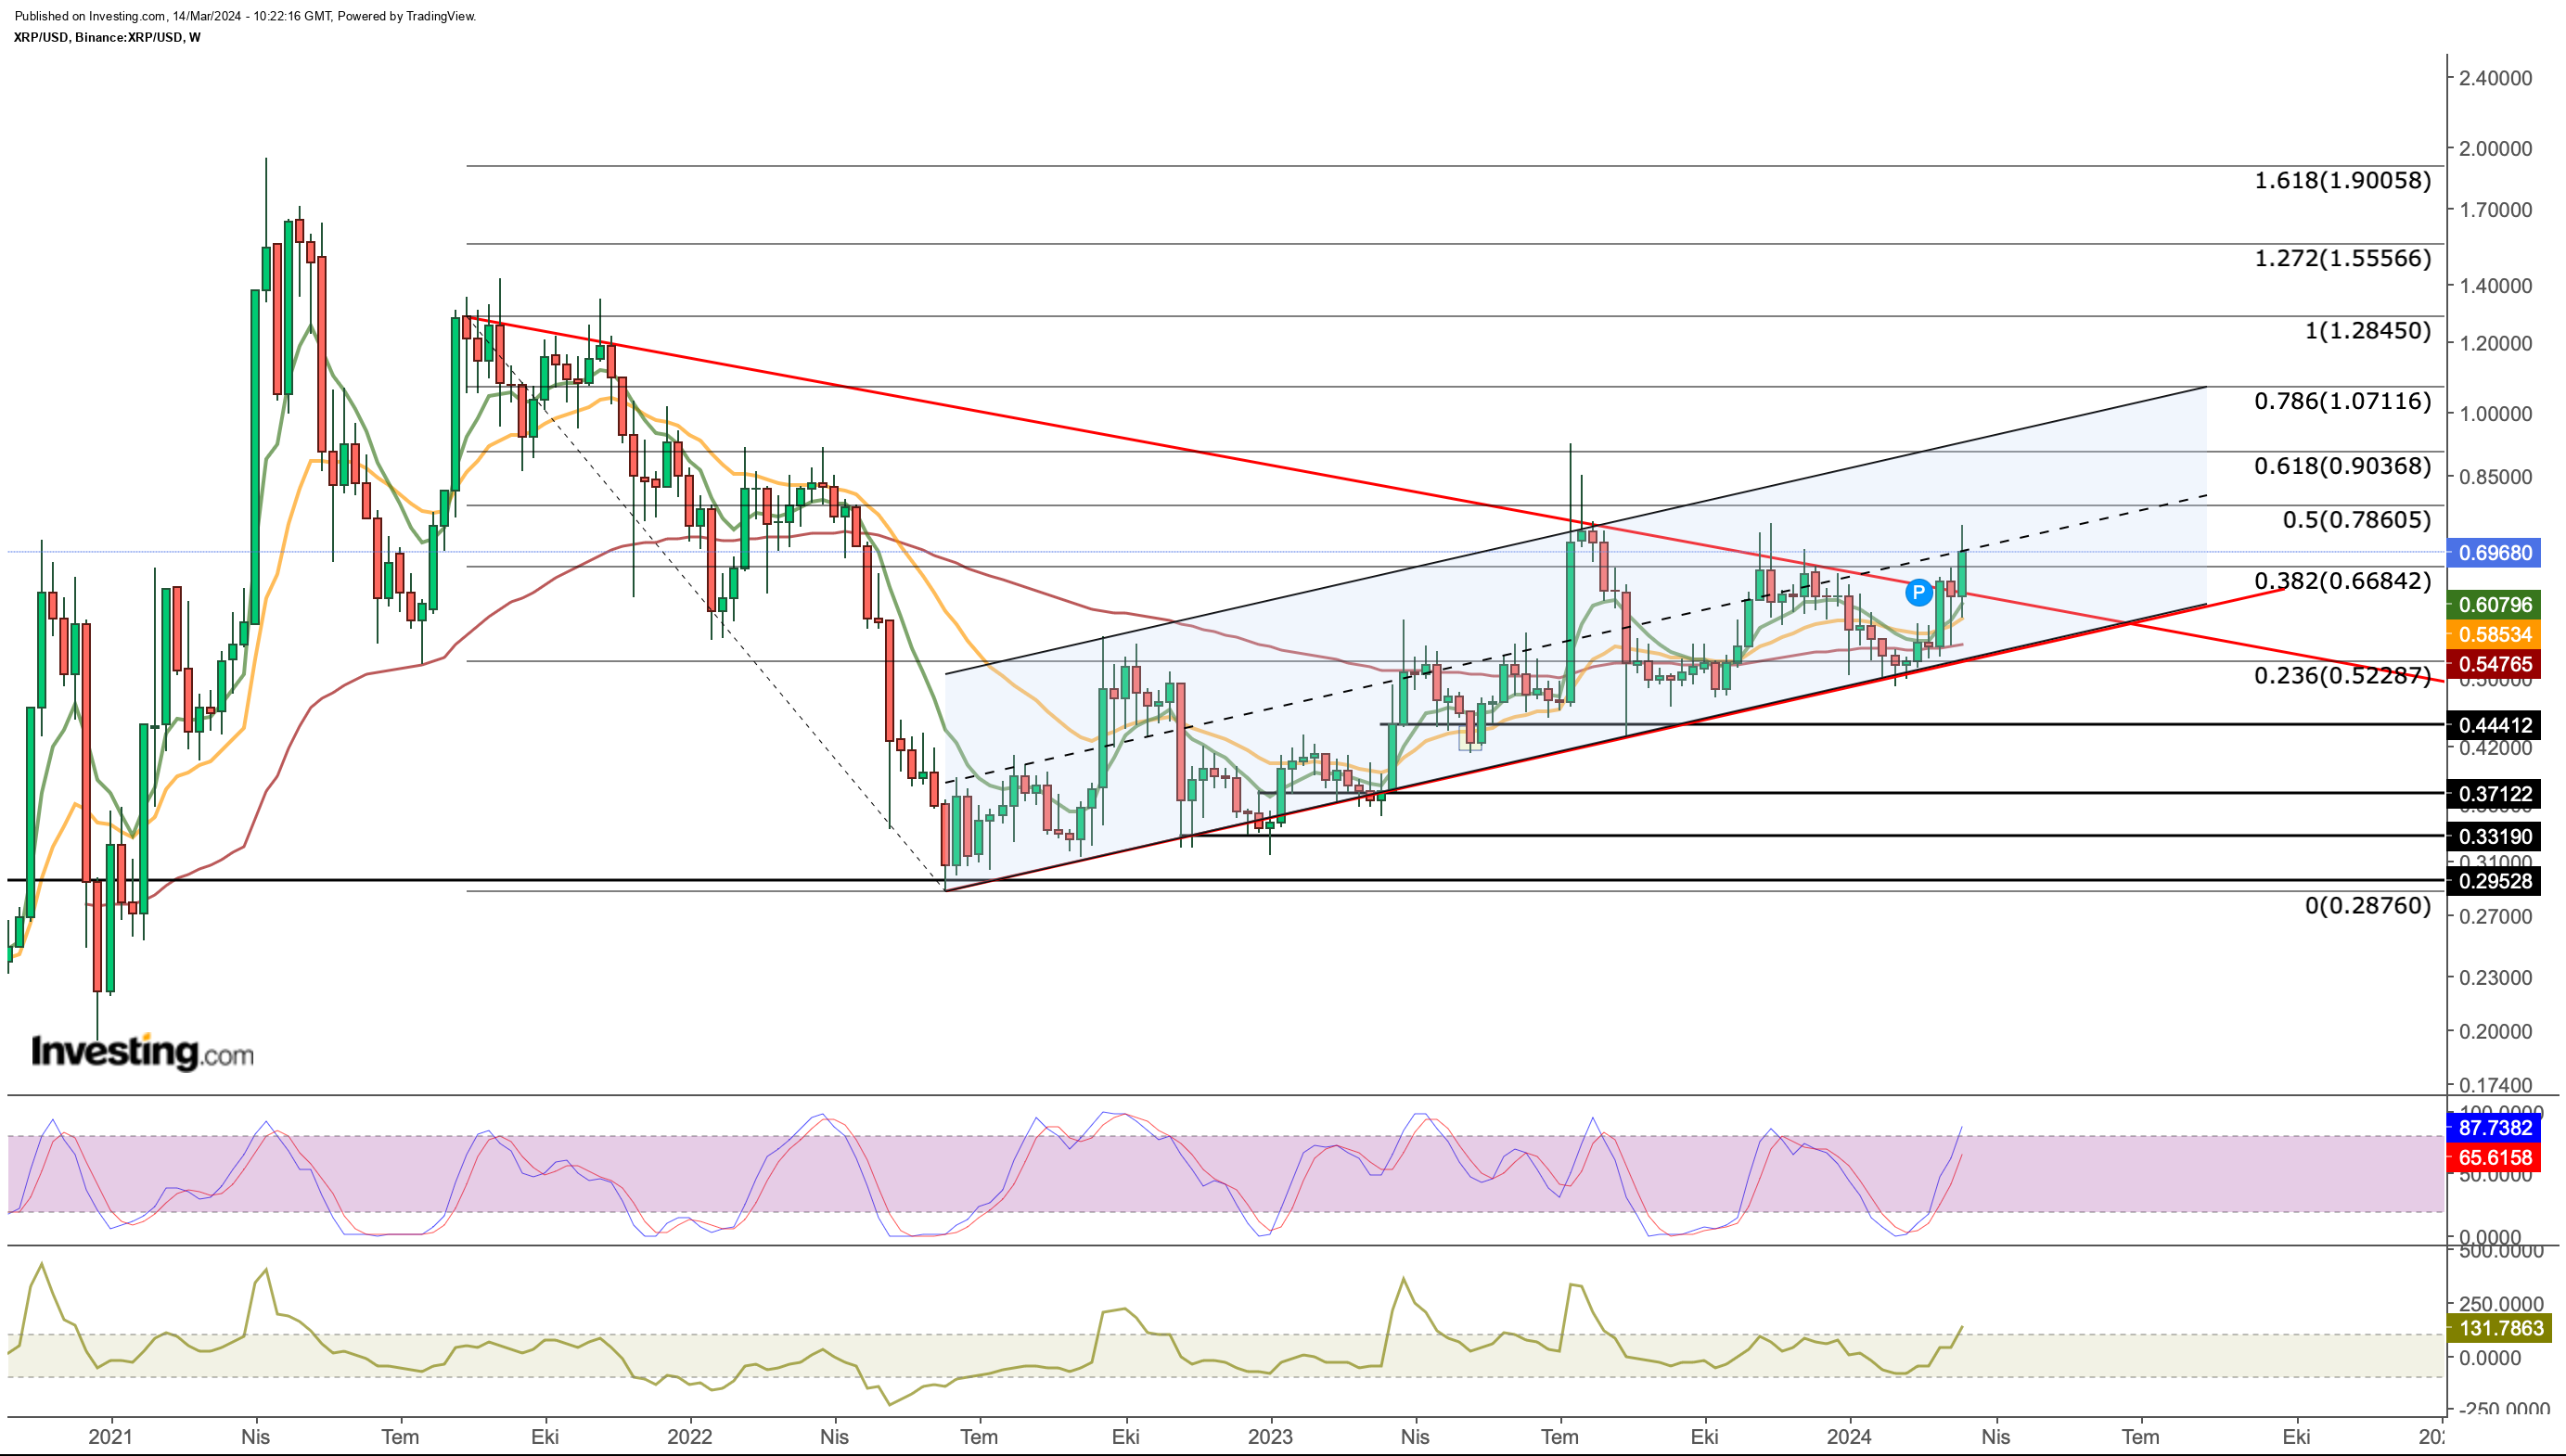
When we look at the last 3-year outlook of the Ripple token, we can see that after the bottom in June 2022, the cryptocurrency continued by creating higher lows. XRP is also moving along an ascending channel during the recovery process.
This week, the cryptocurrency once again tested the mid-band of the channel, which it has been testing frequently since 2022, and this time it managed to break the long-term falling trendline. In July and November 2023, XRP failed to break this trend and fell to the bottom of the channel. However, breaking this trend this week can be seen as a sign of a significant rise.
Accordingly, the biggest obstacle in front of XRP stands as the middle line of the channel, which corresponds to $ 0.7. If the close of the week comes above $ 0.7, we can see that the rise may accelerate towards $ 0.9 - $ 1.
Then, similar to Bitcoin and Ethereum's chart, XRP, which is likely to draw a chart that may violate the rising channel, may move towards the $ 1.5 - $ 2 range in the medium term. However, it should not be forgotten that Ripple's legal process with the SEC in the case in April also had an impact on the XRP price.
In the lower region, if a possible $0.7 breakout does not come, selling pressure may push XRP to test the falling trend line at $0.62. If this retest is successful, the above target prices will remain valid. However, a possible breakout could trigger a decline towards $0.55, which coincides with the lower band of the channel.
Immutable reaches decision point
Immutable, developed as a layer-2 solution for the NFT market, also stands out with its initiatives for the Web3 gaming sector.
IMX, which has the potential to benefit from the demand for the Gamefi sector, may also become a more efficient network with the Dencun update as one of the layer-2 solutions of the Ethereum network, and we may see IMX demand increase even more.
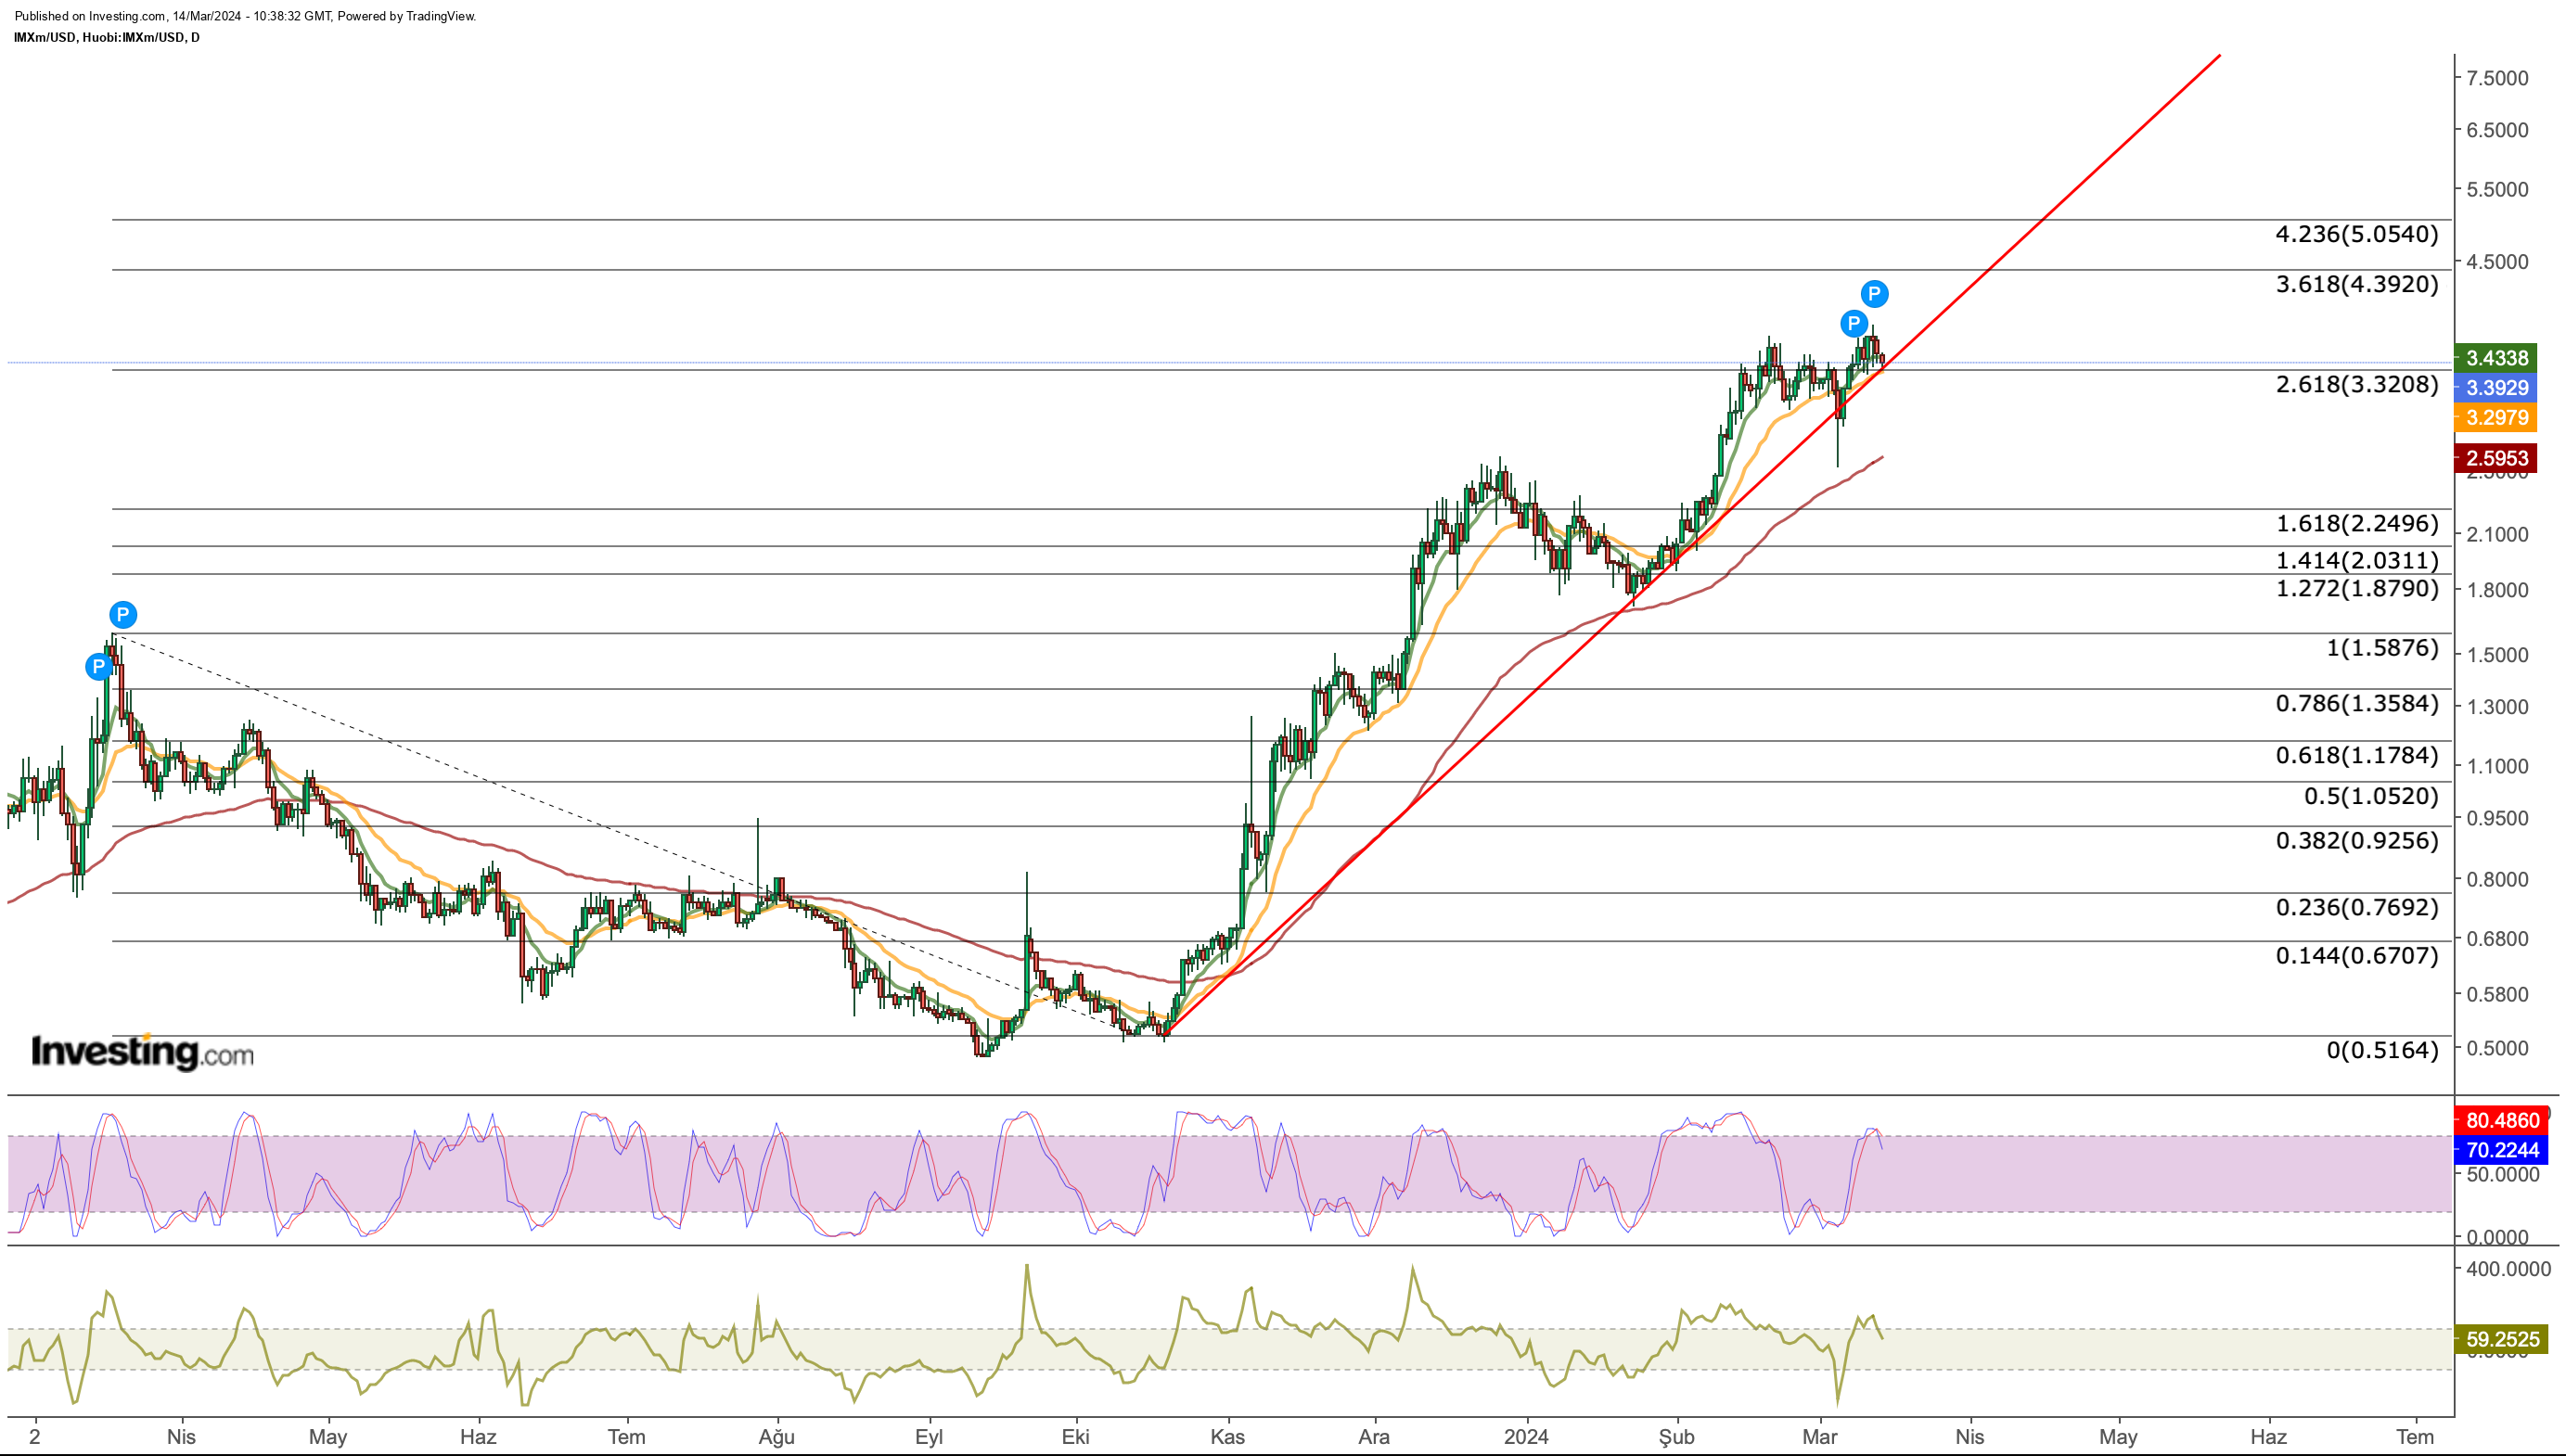
IMX, which retreated from the second quarter of last year until October, has been steadily continuing the uptrend that started afterward.
We can mention that IMX, which has entered a consolidation in the uptrend since the second half of last month, has used the average level of $ 3.3 as a pivot. This pivot level, which corresponds to Fib 2,618, may also coincide with the steeply accelerating rising trend line this week, creating a decision stage.
If IMX sees a weekly close below $3.3, it could risk a correction towards $2.5. If $3.3 is maintained and the recent peak of $3.6 can be decisively surpassed, the next short-term target could be in the range of $4.4 to $5. More distant targets can be followed as 6.9 - 8.7 - 11 dollars according to the long-term outlook.
***
Check out InvestingPro to stay in sync with the market trend and what it means for your trading. As with any investment, it's crucial to research extensively before making any decisions.
InvestingPro empowers investors to make informed decisions by providing a comprehensive analysis of undervalued stocks with the potential for significant upside in the market.
Subscribe here for under $9/month and never miss a bull market again!
Disclaimer: This article is written for informational purposes only; it does not constitute a solicitation, offer, advice, or recommendation to invest as such it is not intended to incentivize the purchase of assets in any way. I would like to remind you that any type of asset, is evaluated from multiple points of view and is highly risky and therefore, any investment decision and the associated risk remains with the investor.


