EchoStar stock soars after SpaceX valuation set to double
- US inflation data pressures assets, but Bitcoin stays steady amid market tensions.
- Bitcoin holding support above $92,300 could invalidate a bearish pattern.
- A breakout above $98,400 may propel Bitcoin toward $125,000.
- Looking for actionable trade ideas to navigate the current market volatility? Subscribe here to unlock access to InvestingPro’s AI-selected stock winners.
This week brought key macroeconomic developments; US inflation data exceeded expectations, pressuring risky assets as well as pushing rate cut expectations to December. However, Bitcoin remained resilient.
Meanwhile, Trump's tariffs threats heightened fears of a global trade war, keeping markets on edge. This dampens investor appetite for riskier assets. Additionally, Fed Chair Powell stated that policymakers will not rush interest rate cuts. Despite these negative signals for Bitcoin, it continues to hold steady at around $96,000.
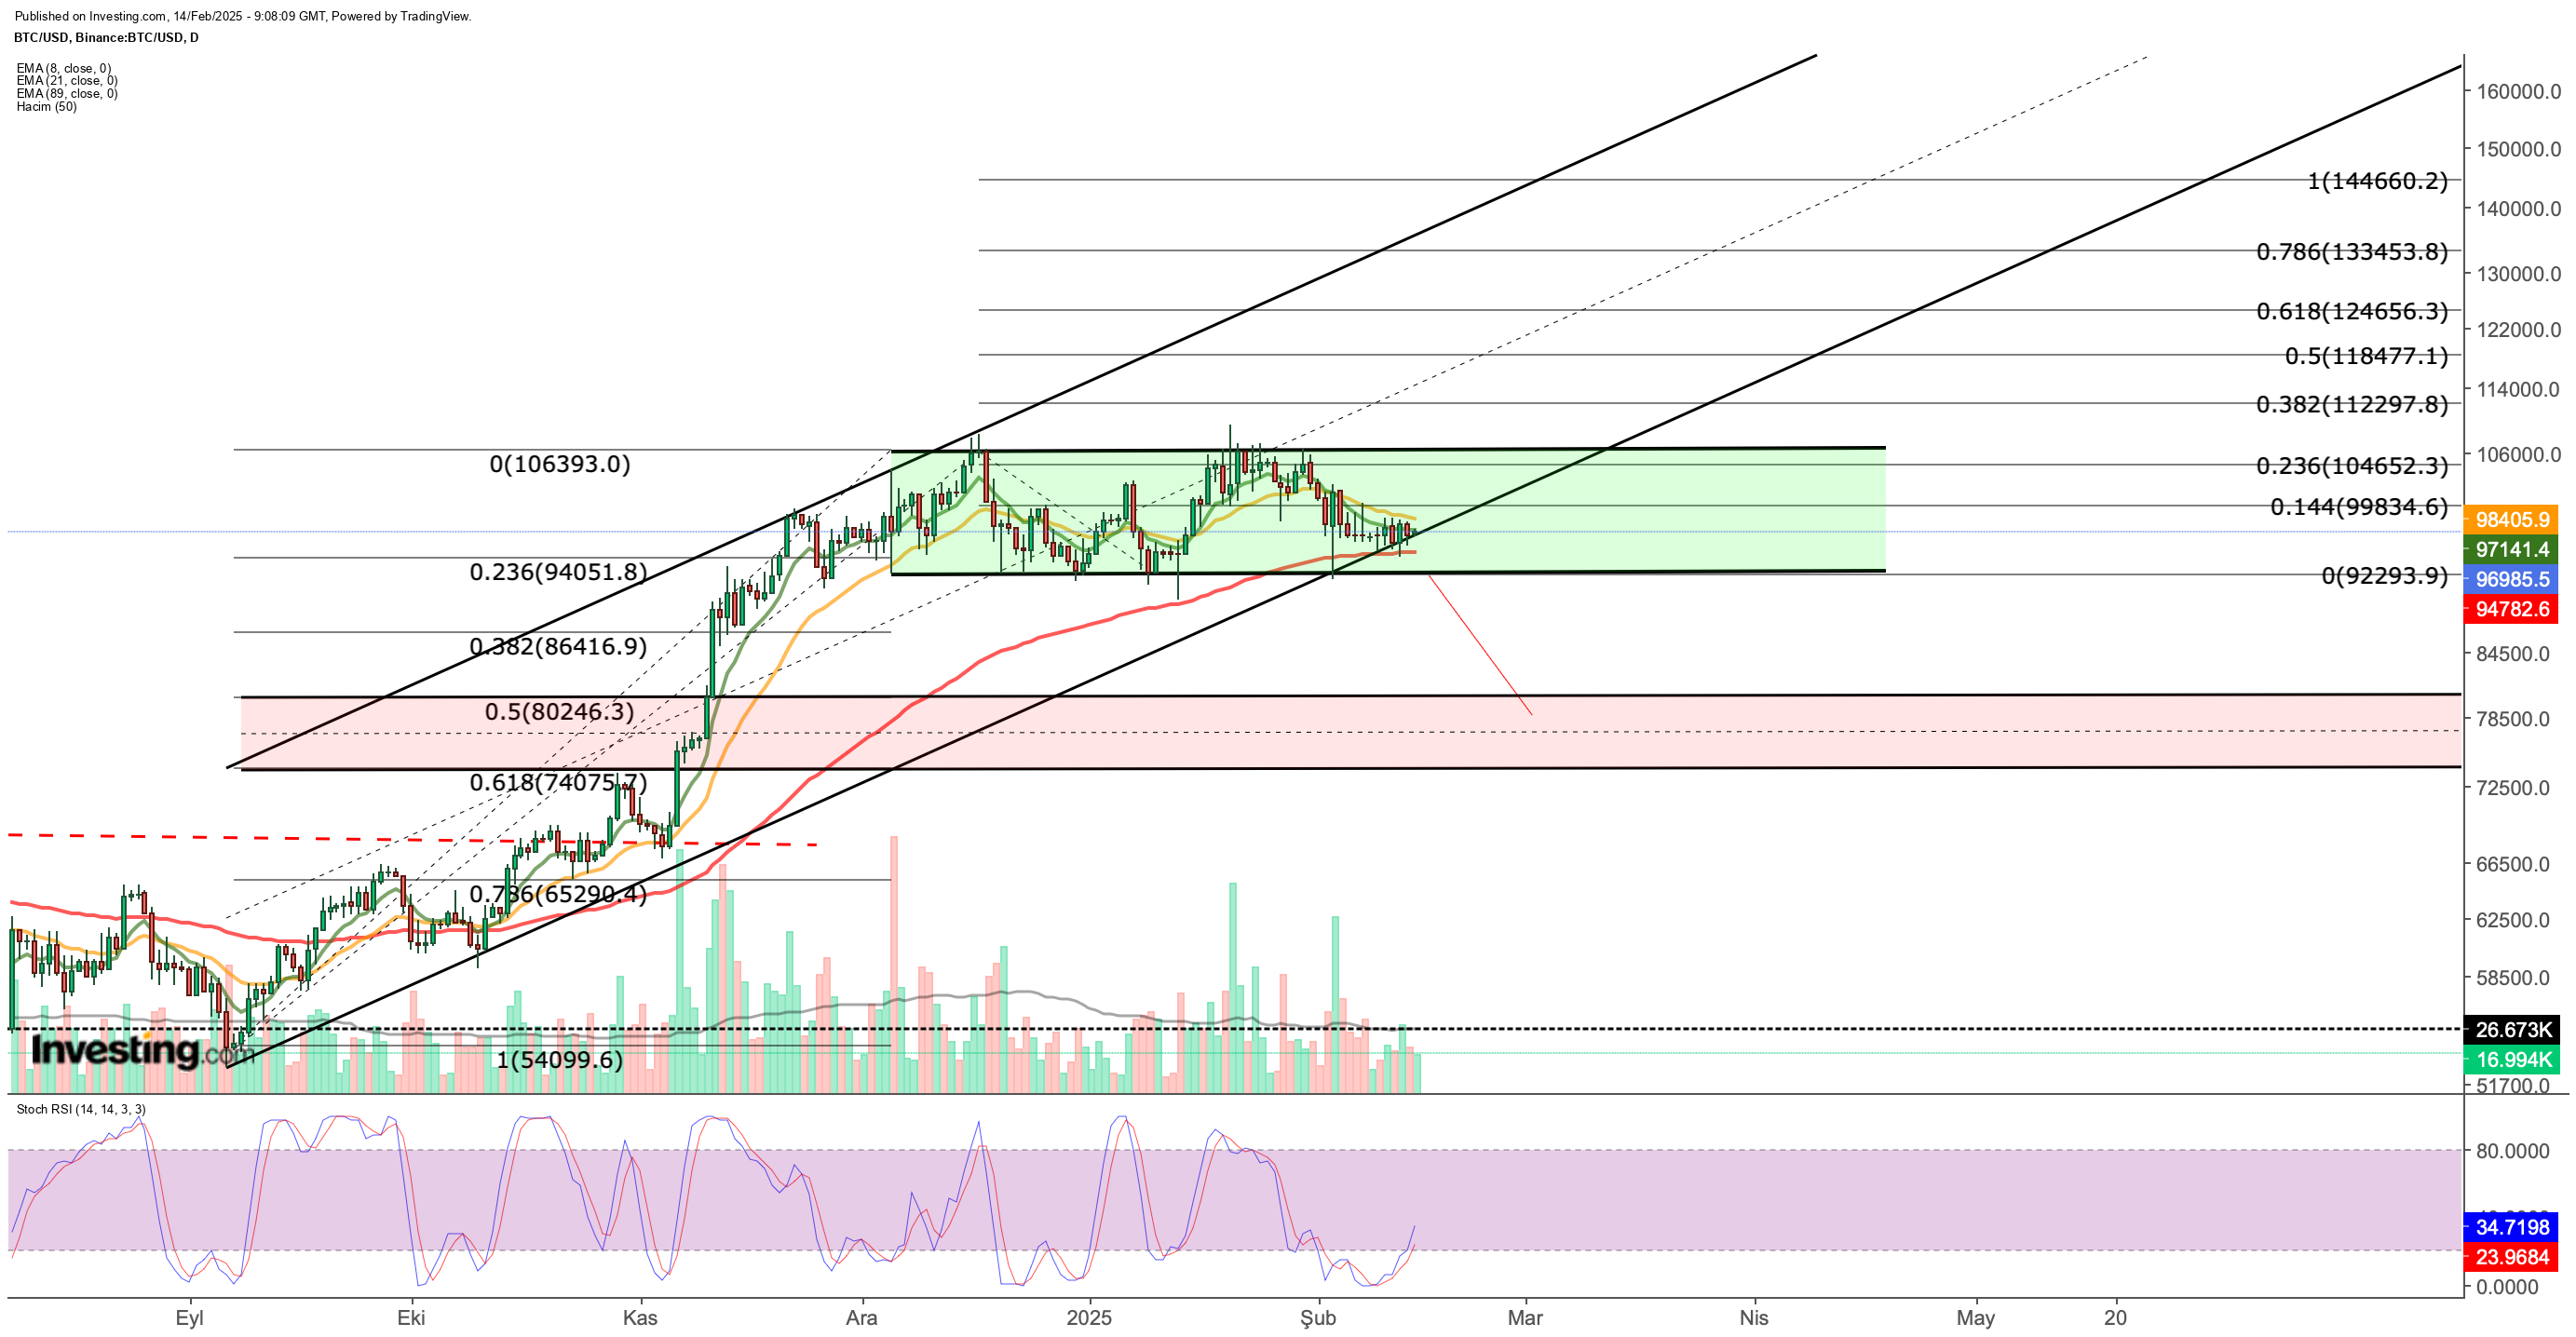
Bitcoin's short-term chart shows two peaks in December and January, at around $106,000. A double-top pattern, which typically signals a bearish trend, has emerged.
On the lower band, the $92,300 level now serves as a key support. If Bitcoin closes below this level on the daily chart, a decline matching the peak-to-neckline distance could unfold. This raises the likelihood of BTC dropping to the $74,000-$80,000 range in a bearish scenario.

Buyers continue to resist in the Bitcoin market. Before the critical $92,300 level, the three-month EMA serves as dynamic support, suggesting an additional support zone of around $94,800. the cryptocurrency also remains on its rising trend line, though with some fragility.
Holding support between $92,300 and $94,800 could invalidate the double-top pattern. To confirm this, the coin needs a daily close above $98,400, followed by a break past $99,800 to escape the danger zone. If this move comes with strong volume, Bitcoin could test the resistance near $106,000.
A breakout from the consolidation phase that has persisted since December could push Bitcoin toward $125,000. For now, Bitcoin remains stuck between $94,800 and $98,400 on the short- and medium-term EMAs, increasing the likelihood of an upward move in line with the breakout direction. On the daily chart, the Stochastic RSI continues to signal bullish momentum from the oversold zone.
Bitcoin Support and Resistance Levels Summary
Bullish Scenario:
- Daily Close Above $98,400: A close above this level could signal initial strength, prompting Bitcoin to challenge the $99,800 mark.
- Exceeding $99,800: If surpassed, the next resistance level stands at $106,000.
- Breaking $106,000: Surpassing this barrier may inject fresh bullish momentum, potentially driving Bitcoin up to $125,000.
Bearish Scenario:
- Breaking Below $94,800: A fall beneath this point may push Bitcoin towards the $92,300 level, aligning with the double top pattern's neckline.
- Dropping Below $92,300: Confirmation of the double top could result in a deeper decline, though a retest of $92,300 is possible.
- Formation Target (NYSE:TGT): The $74,000 to $80,000 range emerges as a key support zone for Bitcoin.
Critical Levels:
- Range Between $94,800 and $98,400: Bitcoin remains constrained within this range. The breakout direction will likely dictate the next significant movement.
Stochastic RSI Rising from Oversold Zone: The ongoing upward shift suggests a potential short-term positive reaction. - If Bitcoin remains within the $92,300 to $94,800 range, it could negate the bearish outlook and enhance the likelihood of an upward breakout.
****
Disclaimer: This article is written for informational purposes only. It is not intended to encourage the purchase of assets in any way, nor does it constitute a solicitation, offer, recommendation or suggestion to invest. I would like to remind you that all assets are evaluated from multiple perspectives and are highly risky, so any investment decision and the associated risk belongs to the investor. We also do not provide any investment advisory services.
