Deere and Tractor Supply shares fall after Trump criticizes farm equipment prices
- Bitcoin has broken below $60,000 this week after a sharp decline.
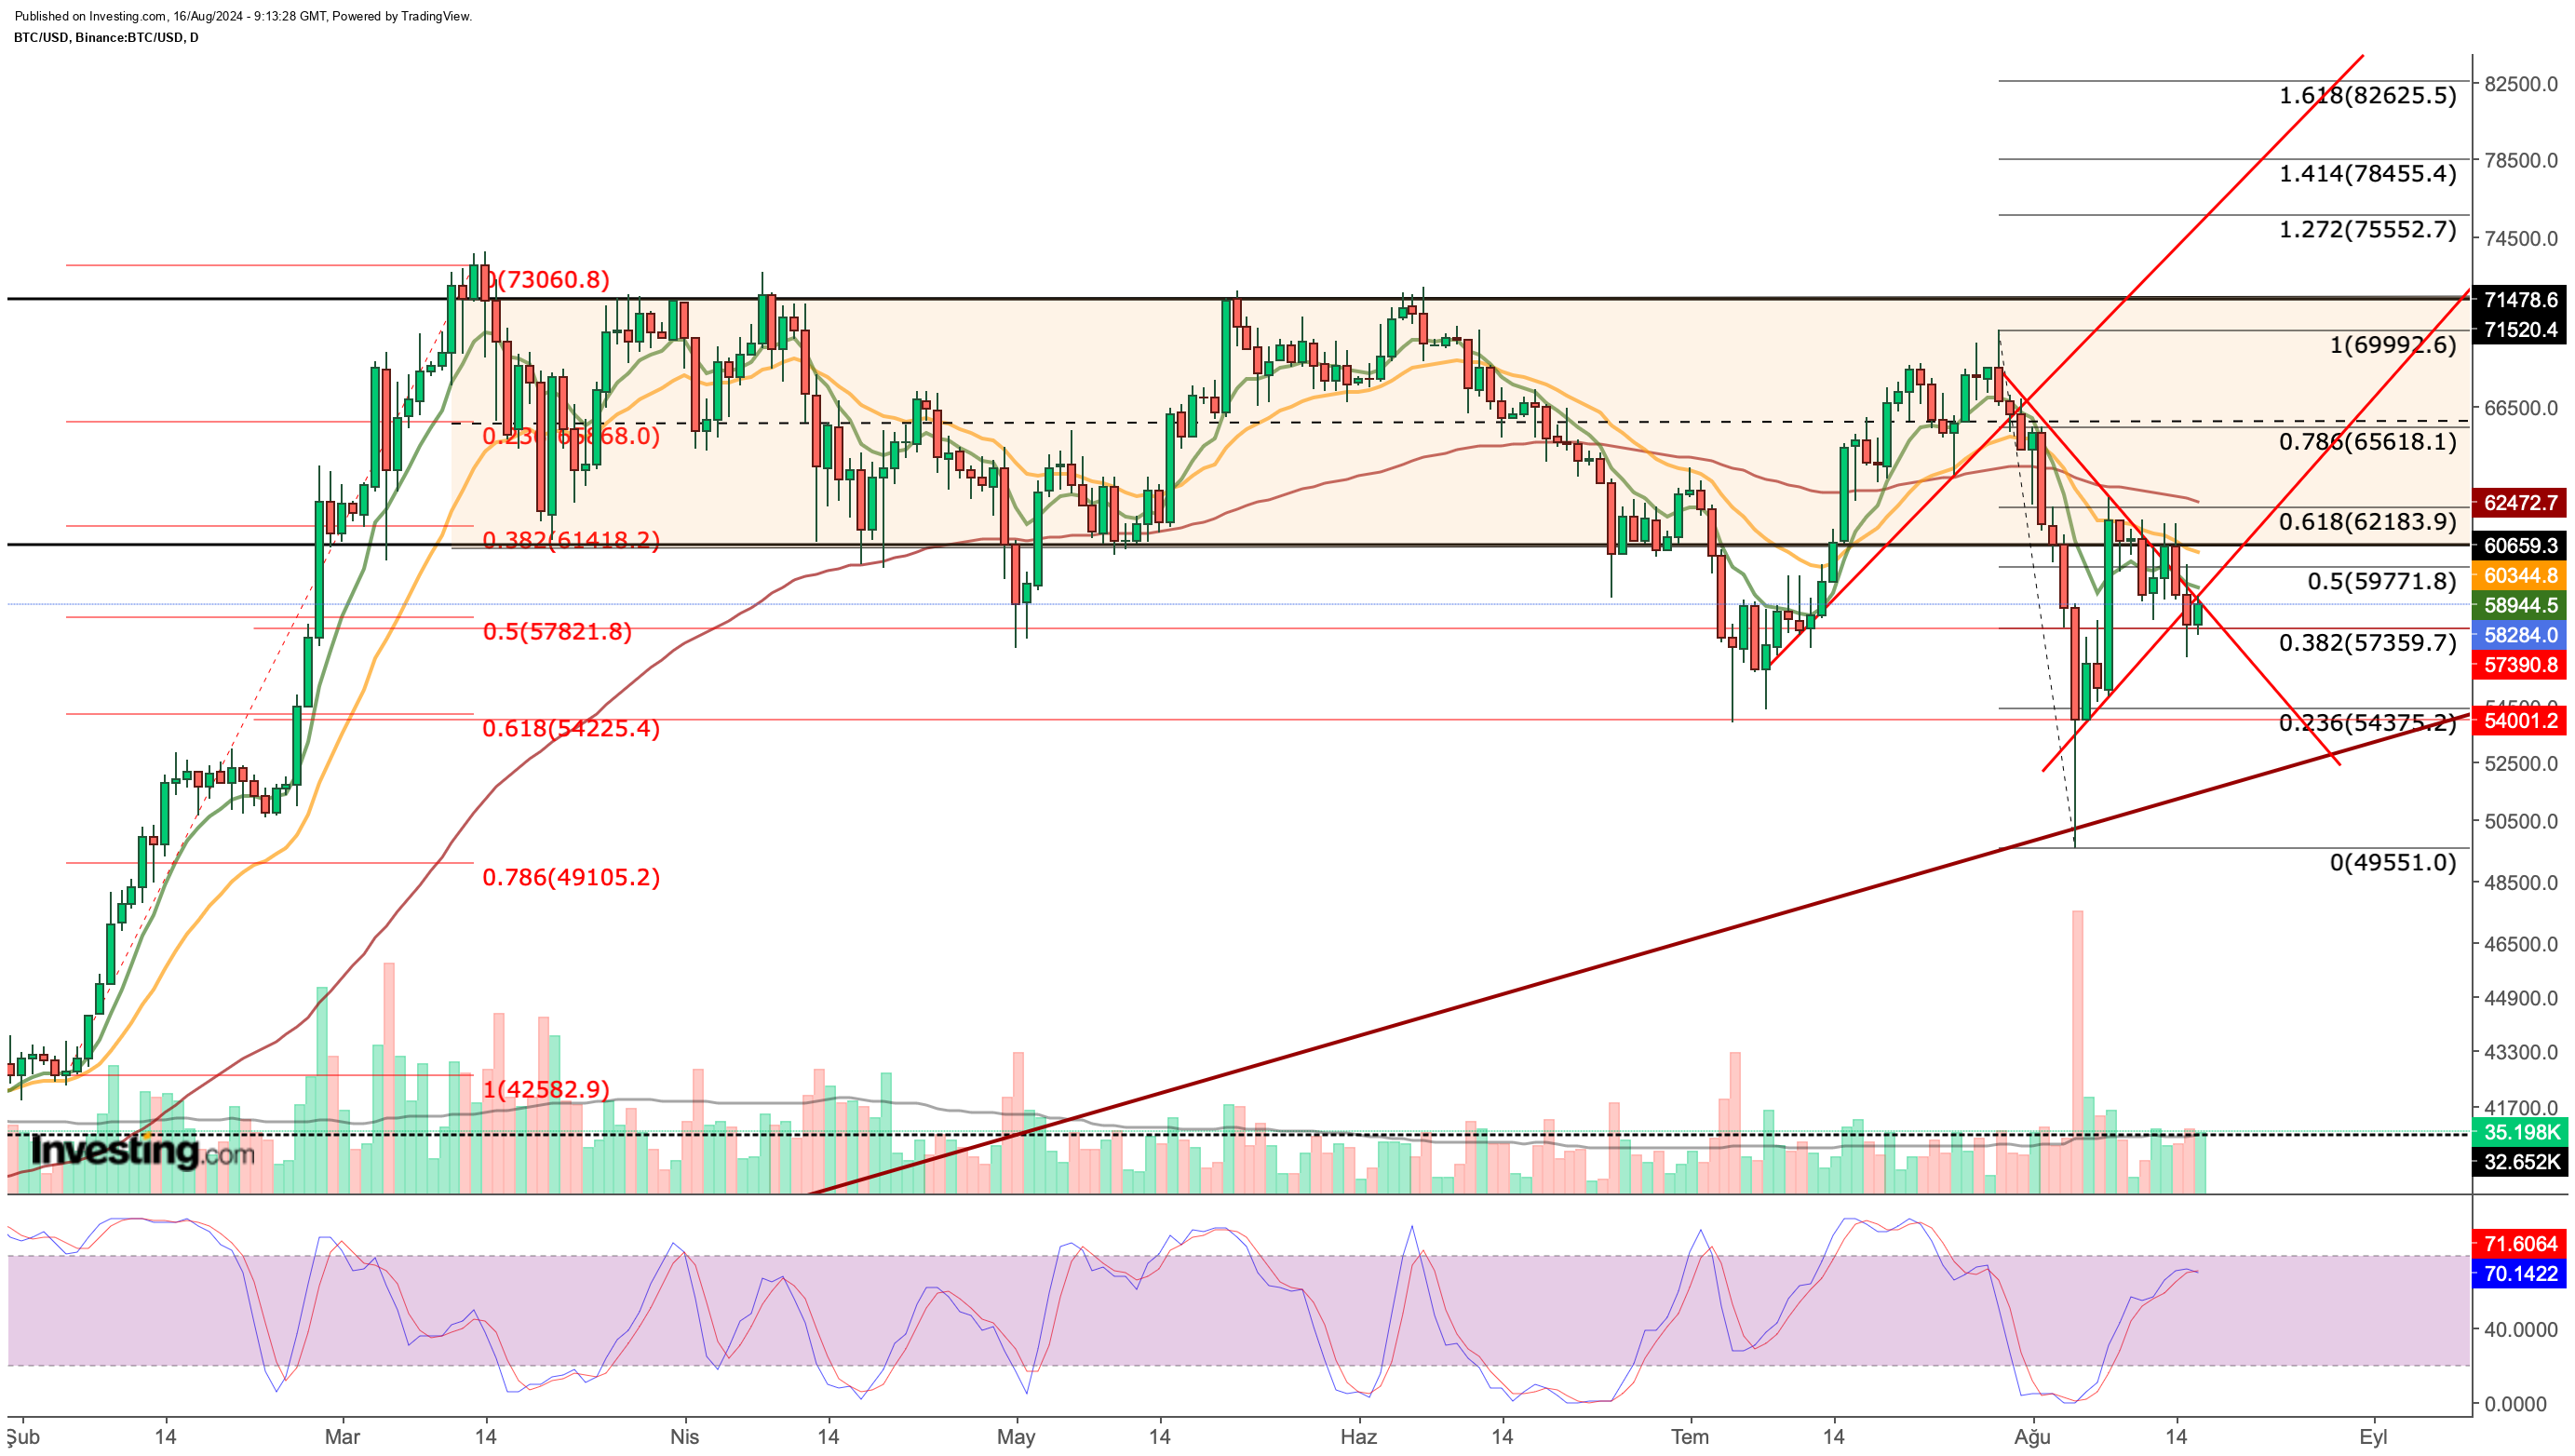
- As the negative outlook in Bitcoin persists, the cryptocurrency is trying to hold onto its short-term support.
- A drop below $57,300 could trigger further declines toward $54,300.
- For less than $8 a month, InvestingPro's Fair Value tool helps you find which stocks to hold and which to dump at the click of a button.
Bitcoin has faced stiff resistance near the $60,000 level, with sellers exerting control over the market. While recent economic data, including strong retail sales and declining unemployment claims, has boosted overall market sentiment, Bitcoin's recovery remains hindered.
The resurgence of carry trade earlier this month, fueled by dovish signals from Japan, contributed to a risk-on environment, but it hasn't been enough to propel Bitcoin to new highs. As of now, the critical support level of $57,300 is currently holding, but a breach could trigger further selling pressure.
As the market digests recent economic data and assesses the potential impact on the Federal Reserve's monetary policy, Bitcoin's price trajectory will likely be influenced by these factors.
Alongside the largest crypto, we'll also try and assess the technical situation in altcoins like Ripple, Solana and Binance Coin.
Bitcoin Remains in a Downtrend
Technically, Bitcoin rebounded to the $62,000 level after bottoming out at $49,500. This recovery corresponds to the Fib 0.618 level from the recent decline, with the key resistance zone at this point limiting further gains.
On a daily basis, Bitcoin remains in a short-term downtrend. After failing to break higher earlier in the week, the cryptocurrency has closed in the red for the past two days and is now trading below its short-term uptrend.

This situation raises the risk of further downside acceleration, making the $57,300 support level crucial during the weekend trading, once again supported by Fibonacci levels. If Bitcoin loses this support, it could signal a breakdown of the short-term symmetrical triangle, potentially pushing the price toward the next support at $54,300.
To reverse the momentum, Bitcoin needs to break into the $59,000 region today. Early in the day, buying interest emerged around $57,300. If this buying continues and the uptrend is reclaimed, the next move in weekend trading could target the resistance area between $60,000 and $62,000. A weekly close above this zone would pave the way for an accelerated recovery next week.
SOL Seeks a New Breakout Point After Holding Major Support
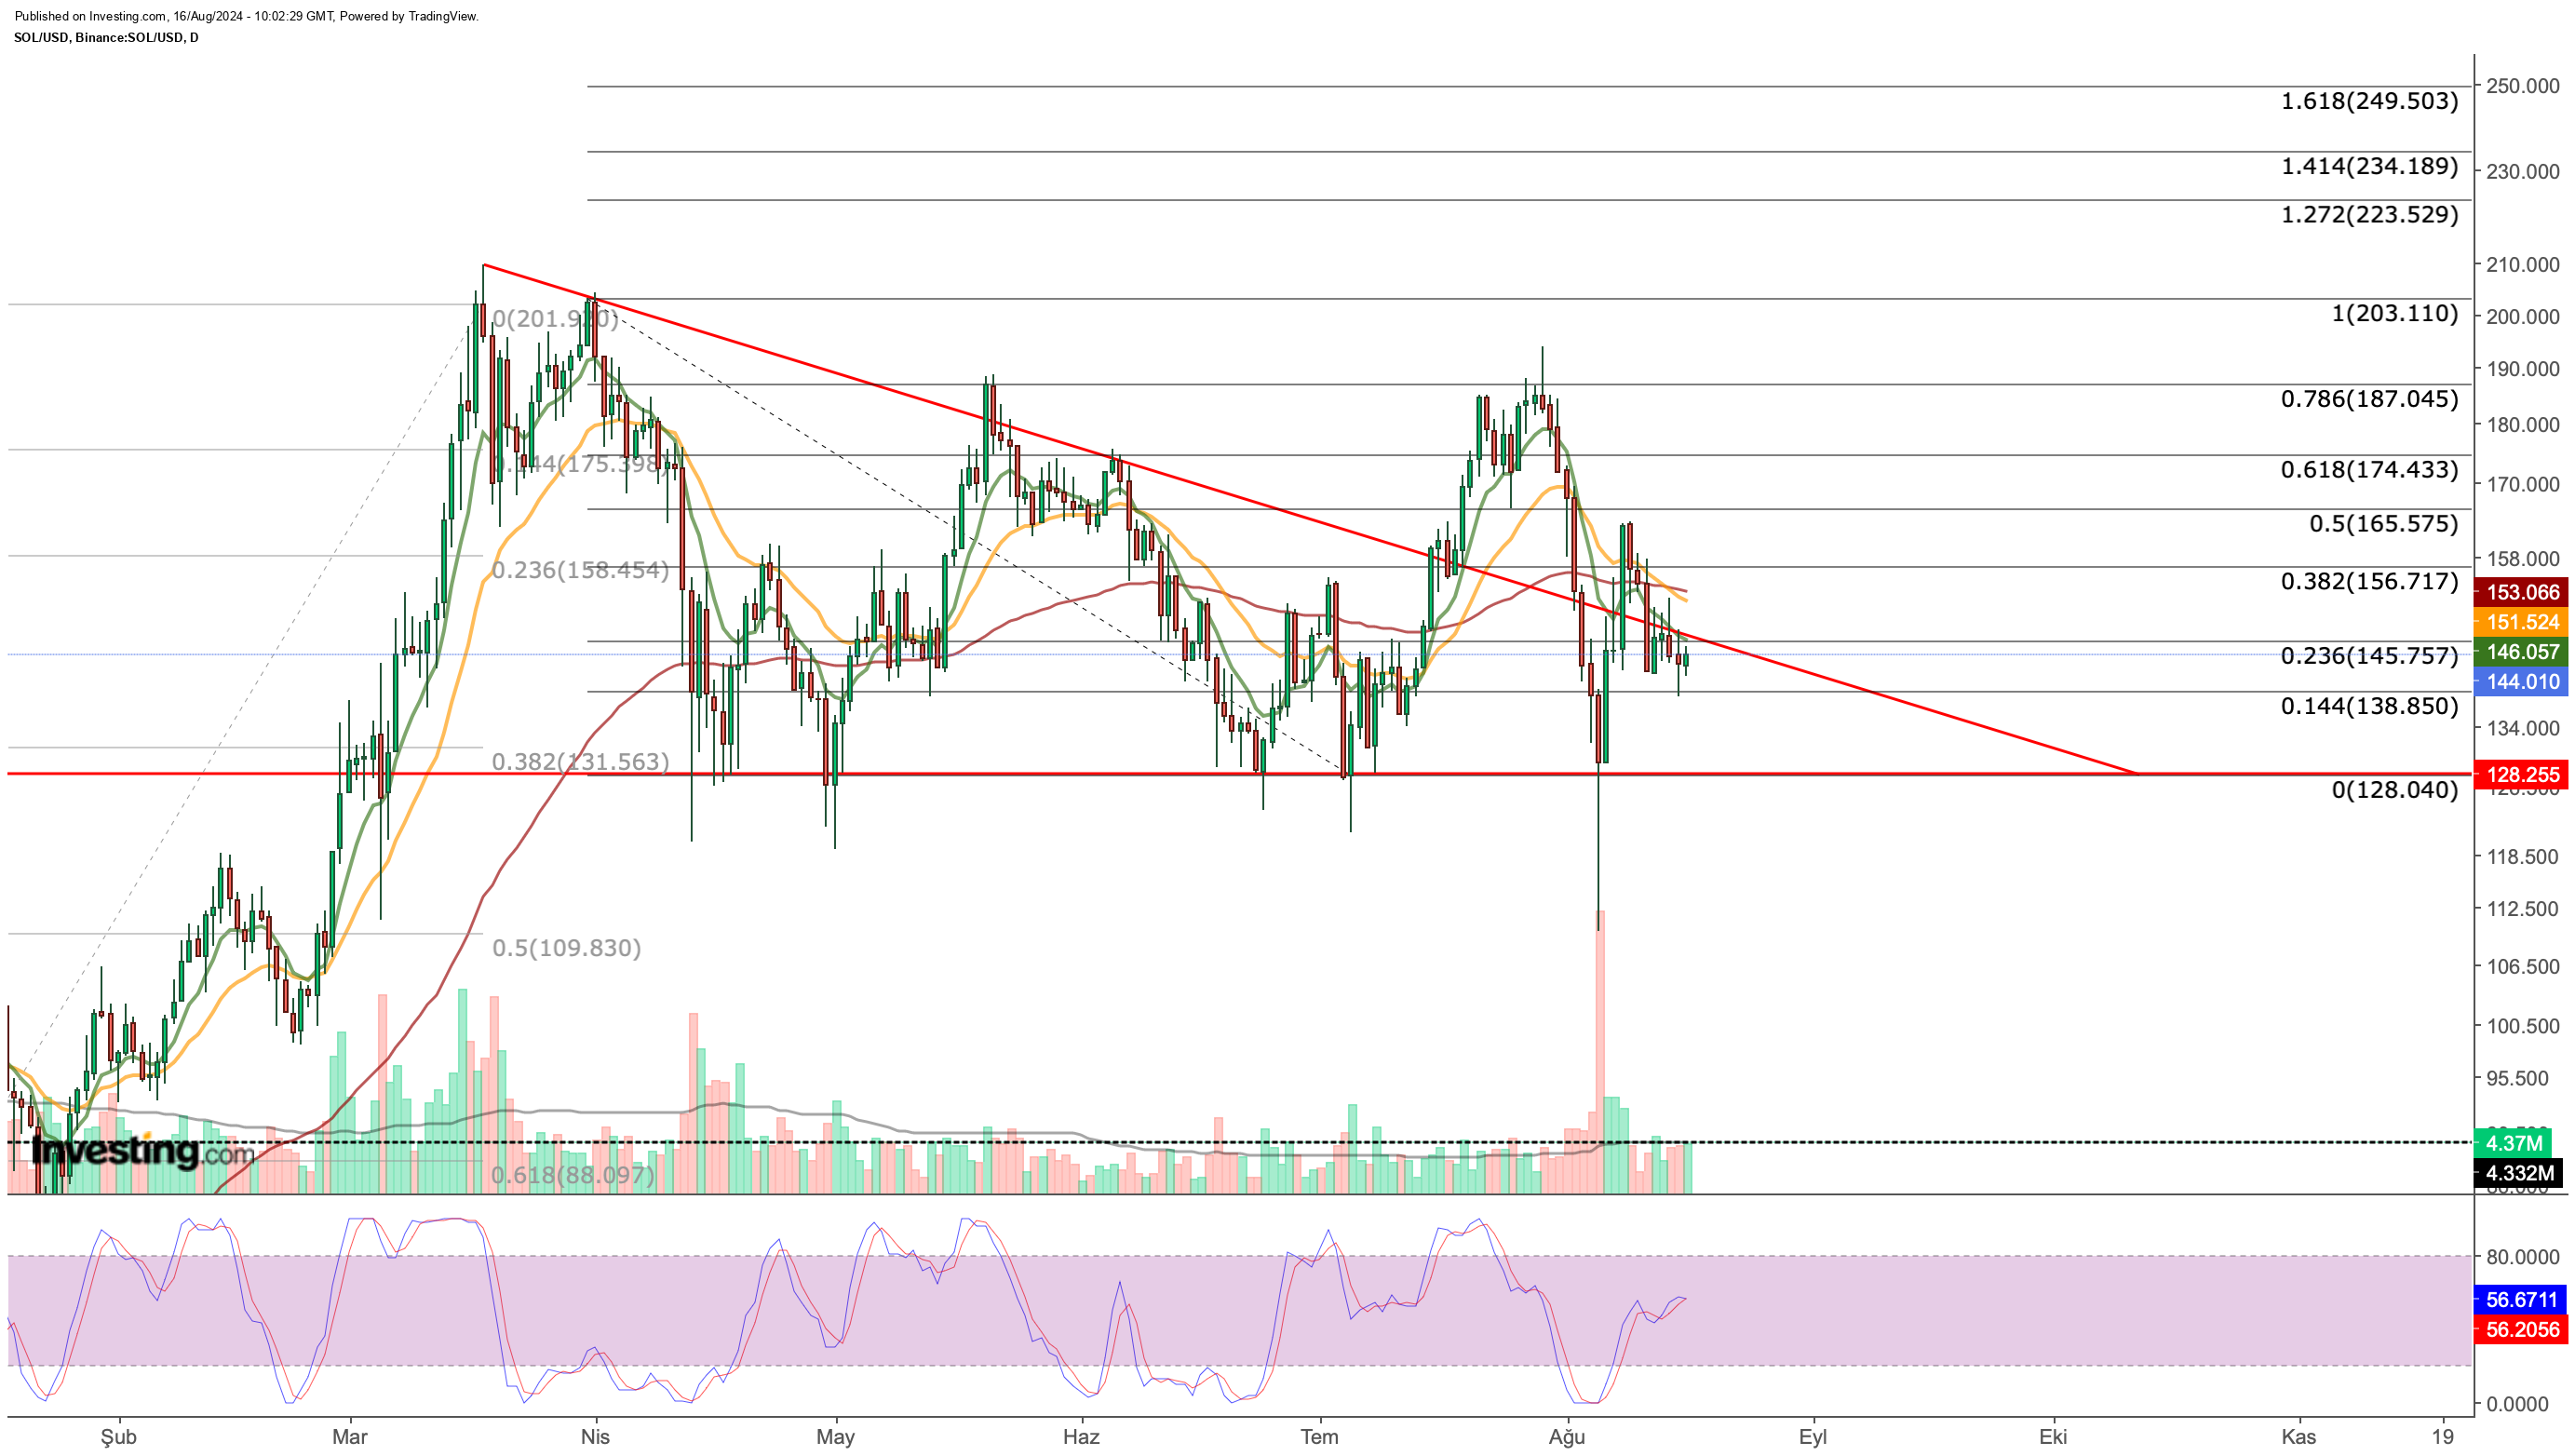
Since April, SOL has consistently tested a key support level around $128. Last week's sharp decline reaffirmed this as the primary support. Despite a brief recovery to $165, SOL has remained flat, fluctuating around $140 as trading volumes dropped.
If SOL fails to close above $146 in the coming days, the downward trend may extend towards the main support below $130, especially if trading volumes fall below $138.

Conversely, a sustained move above $146 could shift the focus to the $155-$165 range. Given the recent intensification of sales around this area, a breakout could accelerate SOL’s price toward $200.
Currently, the nearest support is approximately 5% below the current price, while the potential target is about 15% above at $165, suggesting a 1:3 risk-return ratio with a stop-loss just below $138 for short-term trades. For short positions, targeting $128 as a take-profit level with a stop-loss at $150 offers a 10% return target and a 4% risk.
BNB Returns to In-Channel Trading
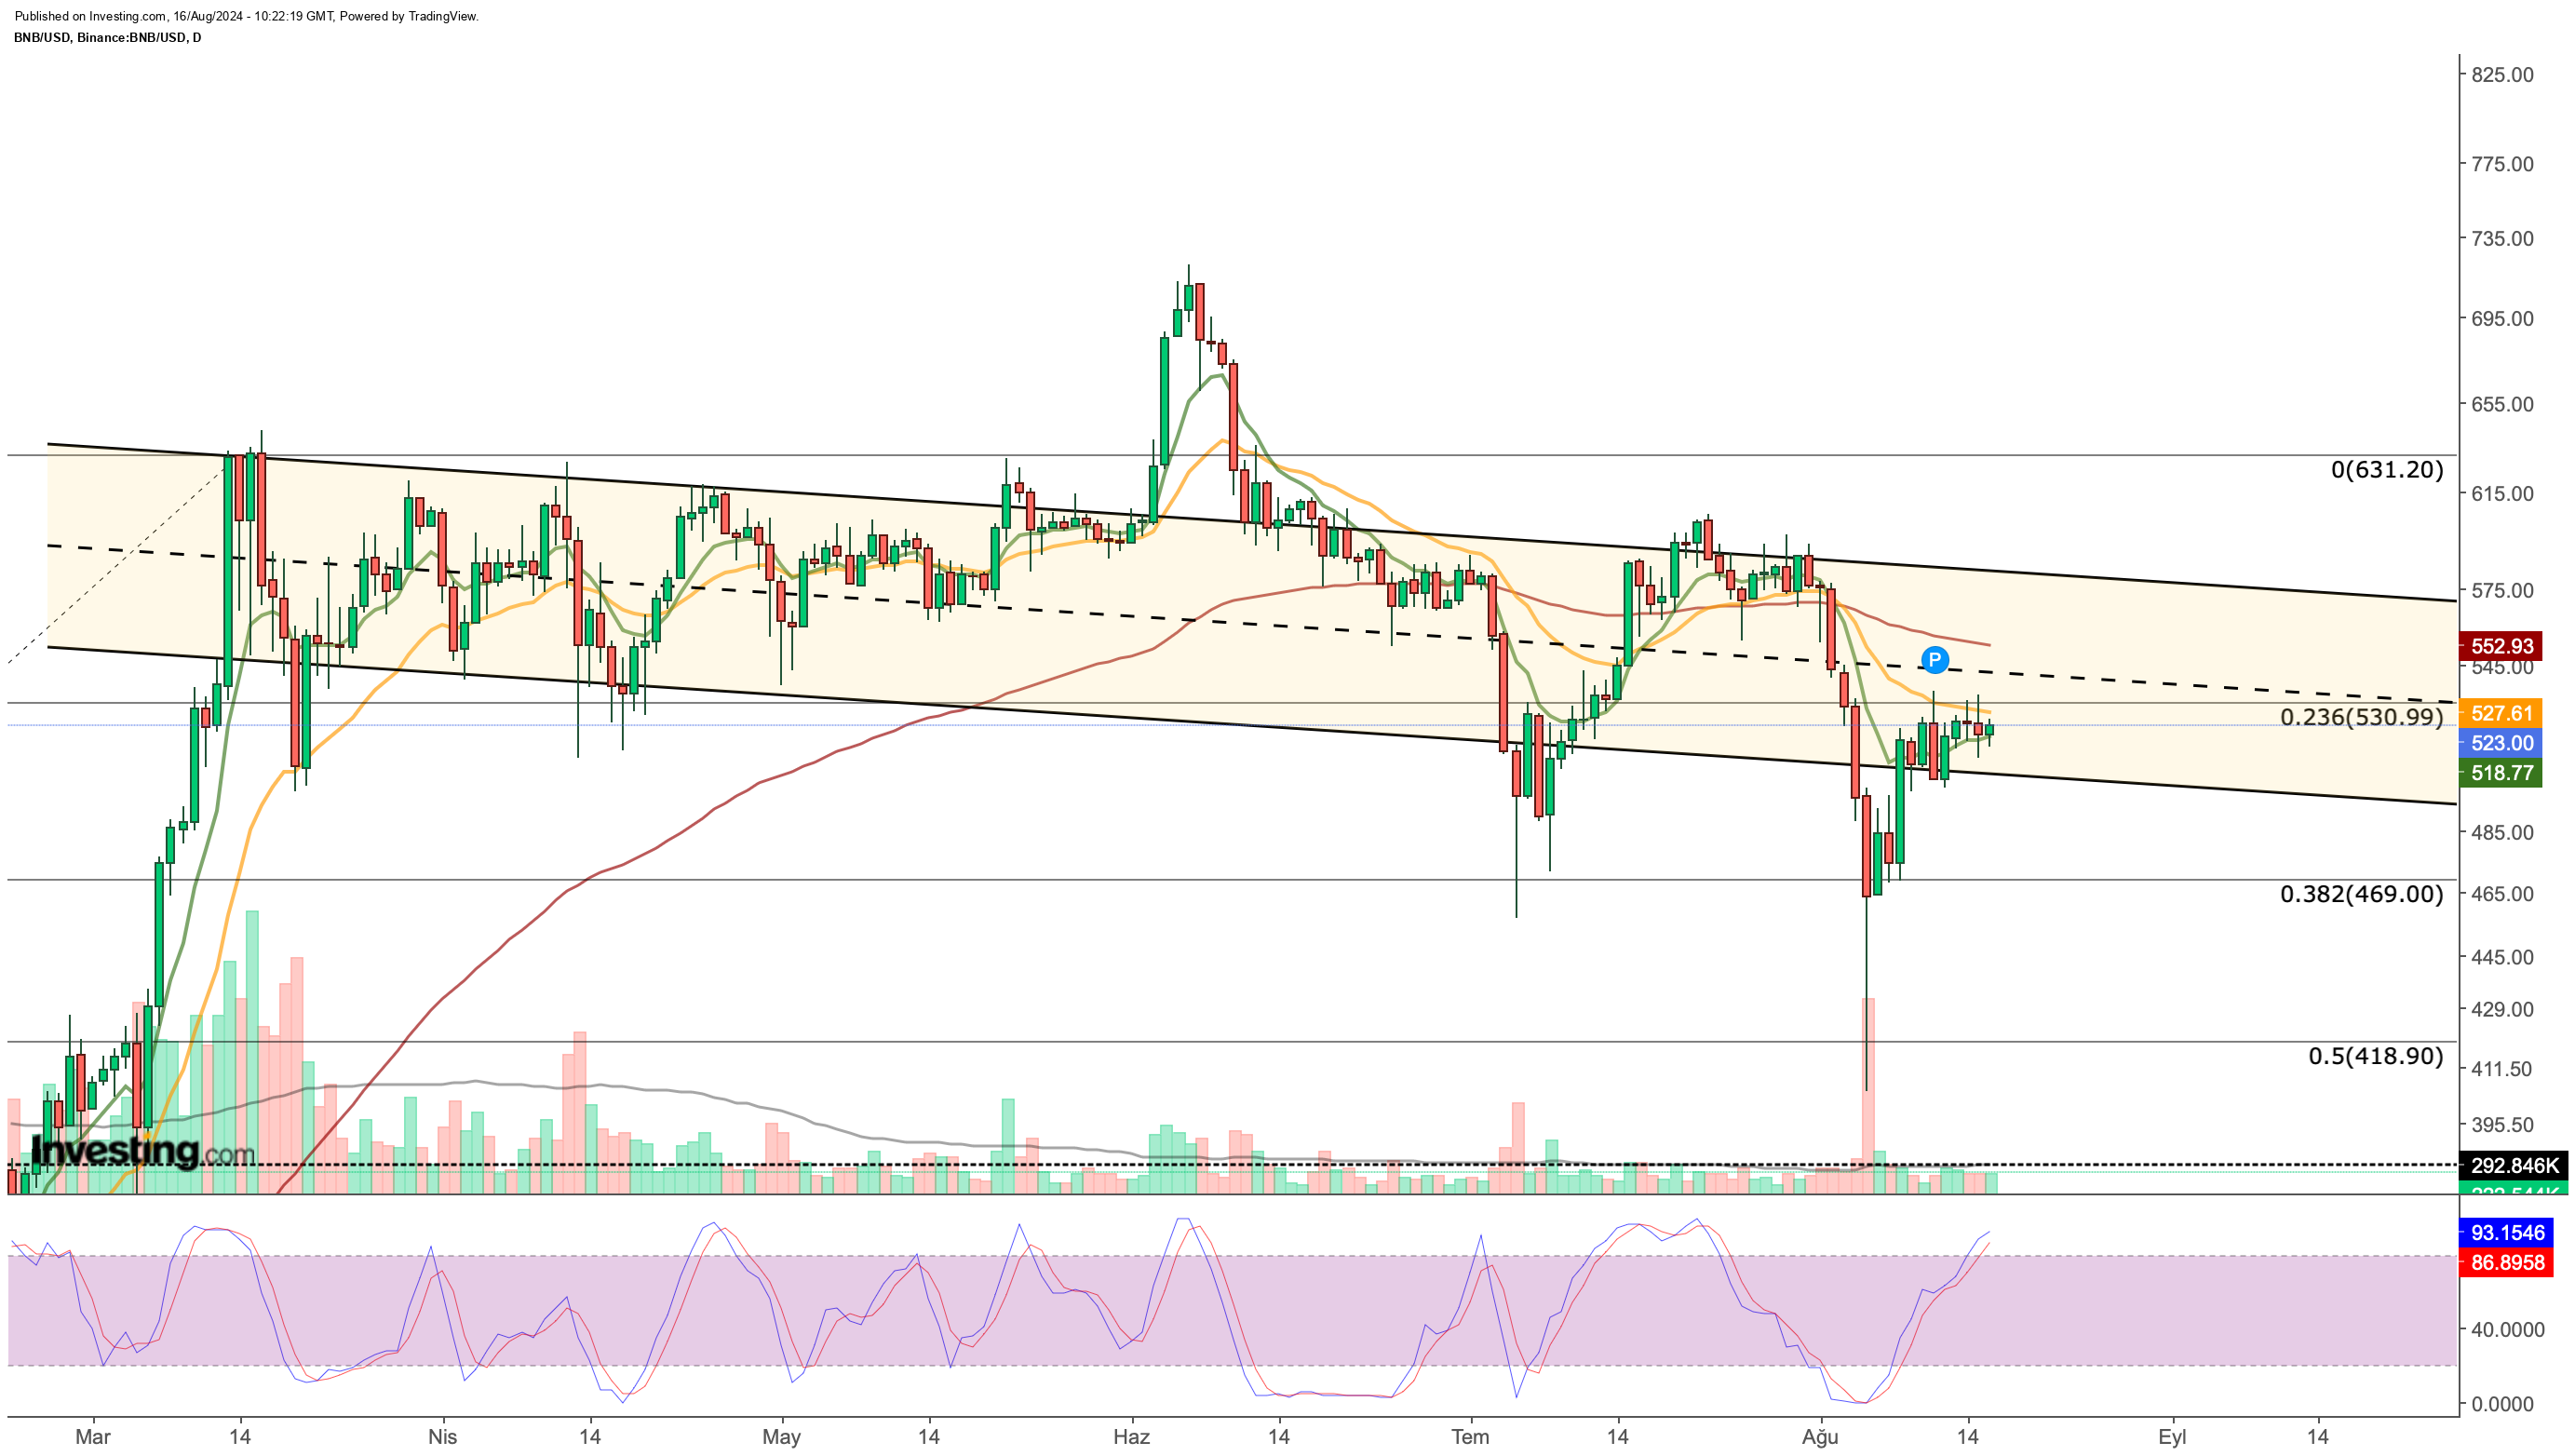
BNB, which has been moving within a bearish channel since March, recently experienced heightened volatility. Panic selling last week briefly pushed BNB out of this channel, but it has since rebounded and reentered the channel. Currently, BNB struggles to break through the $525-$530 range and is supported at $518 due to lower trading volumes.

If volatility increases and BNB closes daily above $530, the price could rise to $550 and potentially $580. However, if the $518 support fails, the price might drop towards $505 and possibly $460.
Price Compression in XRP
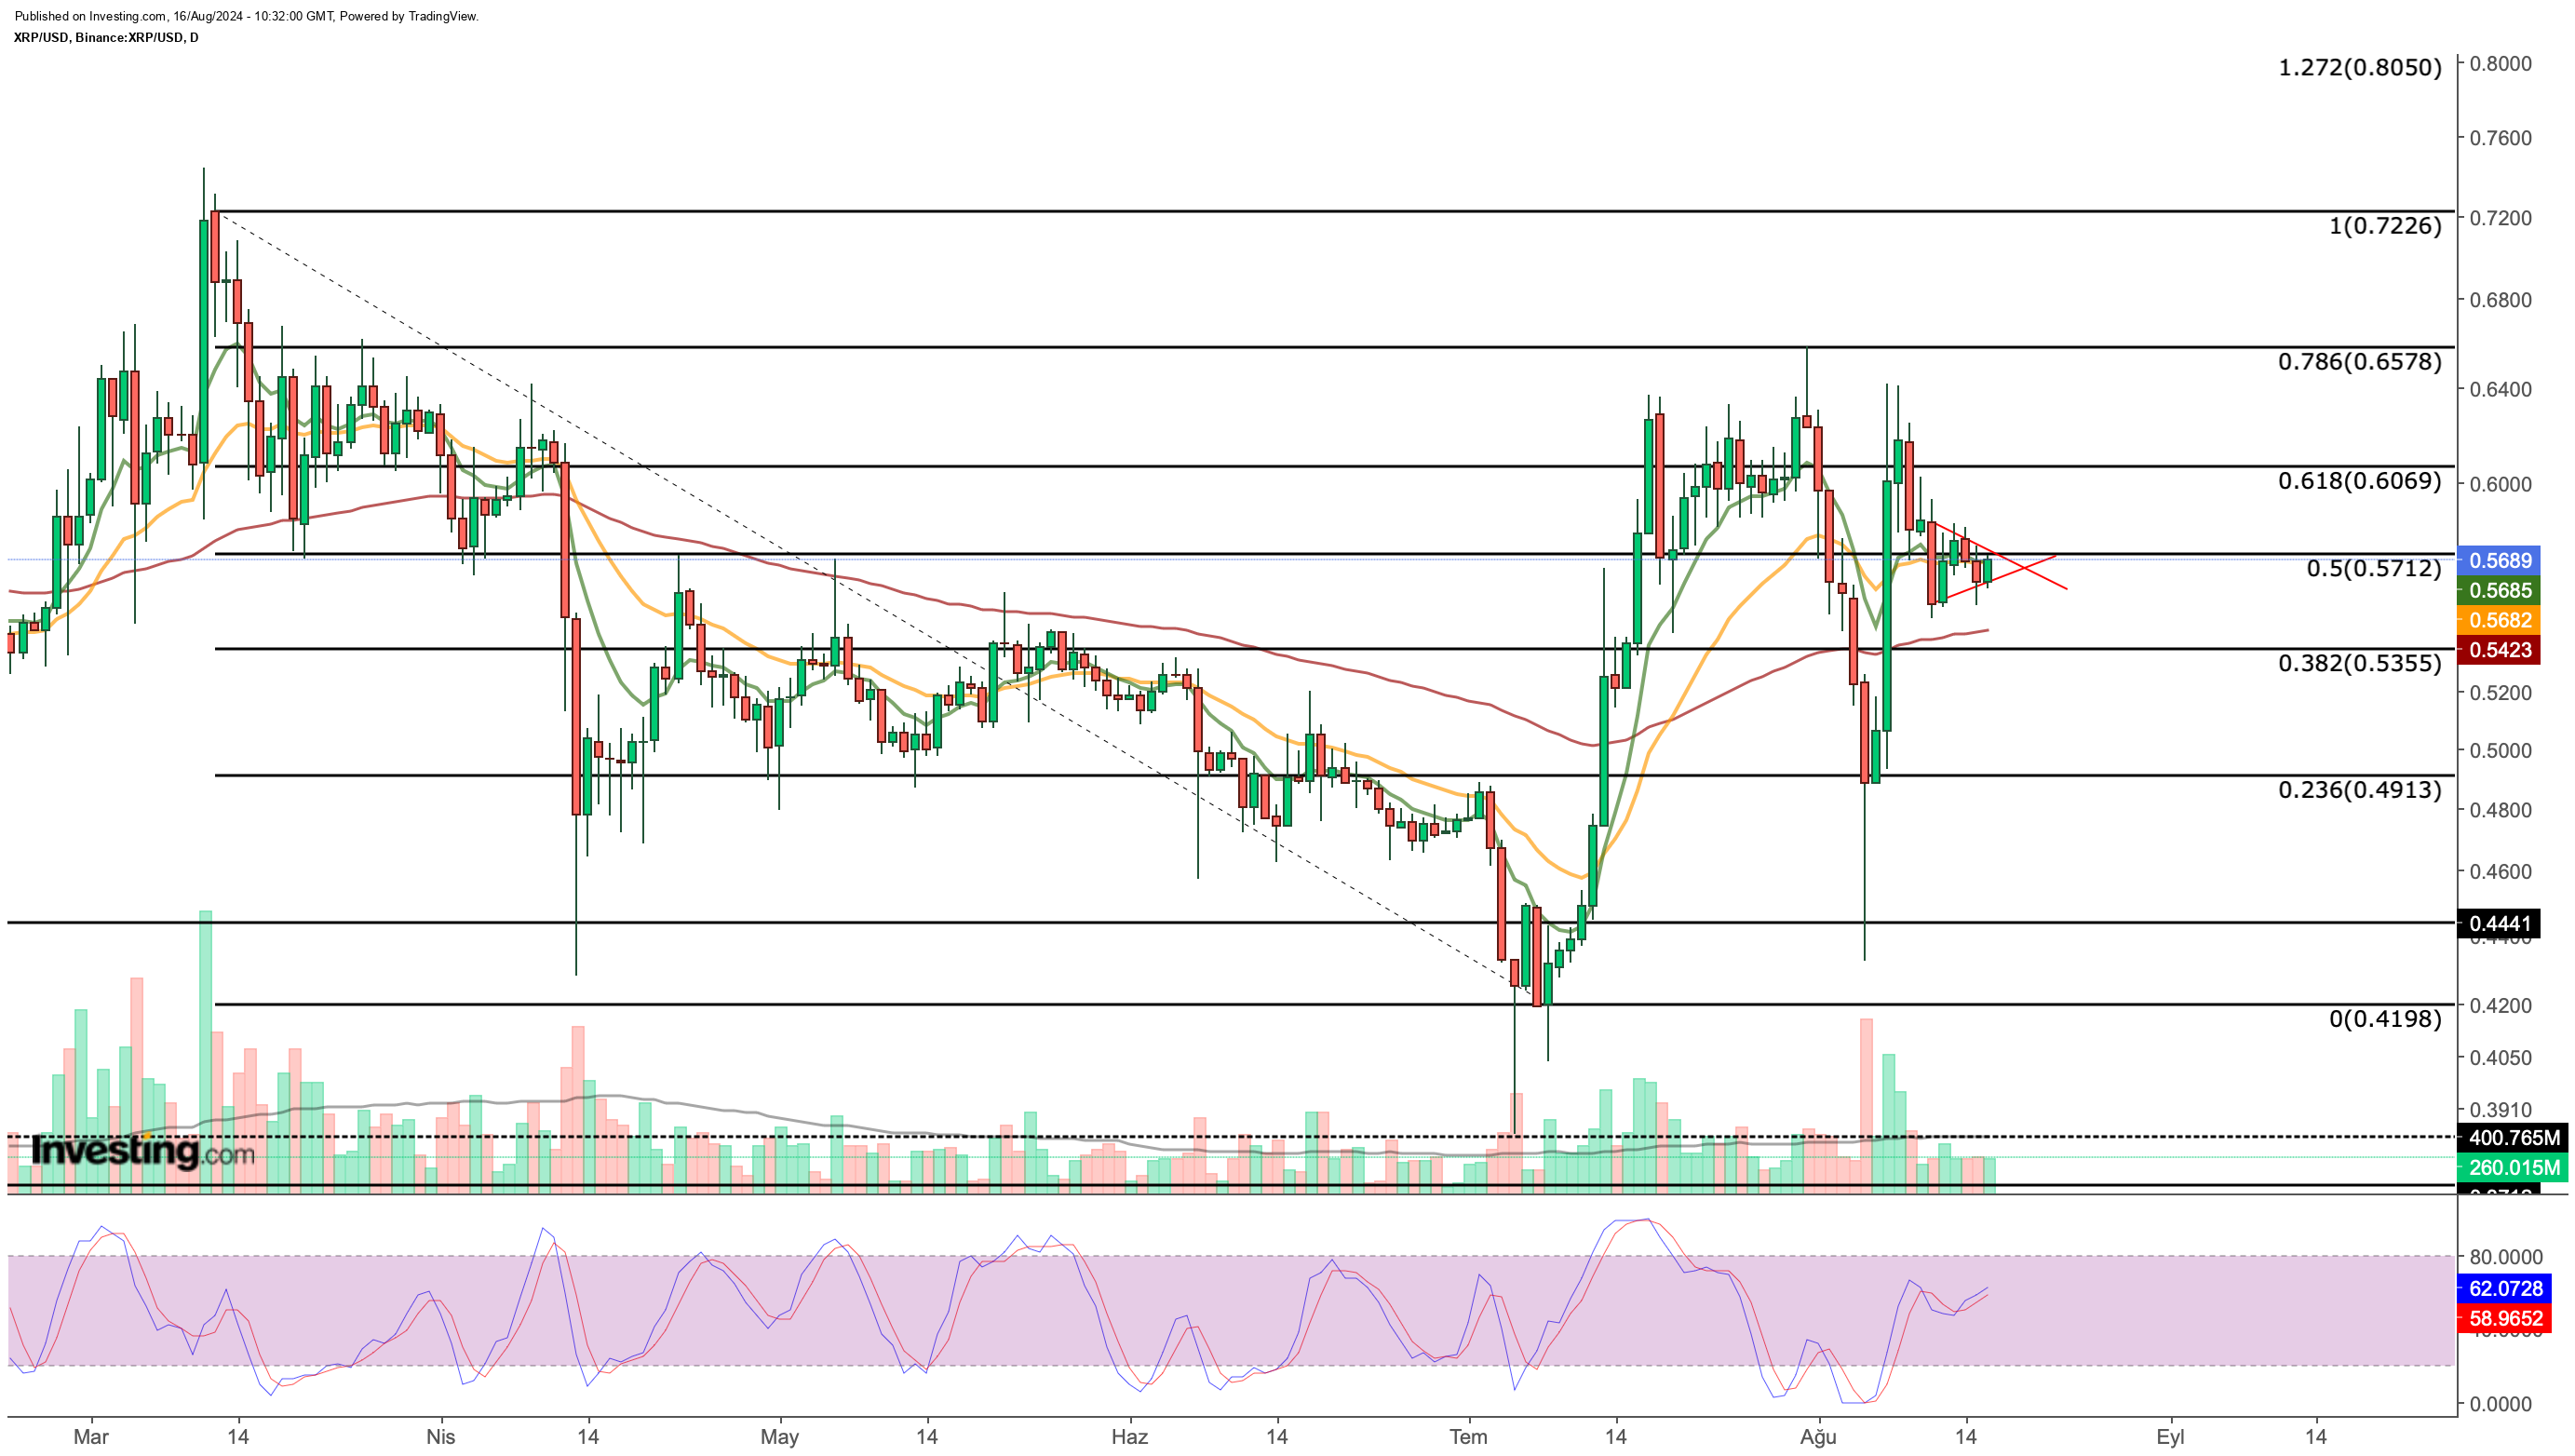
XRP saw a significant rise in July, reaching $0.62, but has since struggled to break this resistance level. Recent gains were quickly erased as XRP faced a stagnant market.

This week, XRP's downward momentum continues towards the $0.5355-$0.54 range, with buyers thinning out. If XRP holds above $0.54, it may first test resistance around $0.62, and if broken, could accelerate to $0.65 and potentially $0.72. However, losing the $0.54 support could signal a new downtrend, possibly pushing XRP below $0.50.
***
This summer, get exclusive discounts on our subscriptions, including annual plans for less than $8 a month.
Try InvestingPro today and take your investing game to the next level.
Disclaimer: This article is written for informational purposes only. It is not intended to encourage the purchase of assets in any way, nor does it constitute a solicitation, offer, recommendation or suggestion to invest. I would like to remind you that all assets are evaluated from multiple perspectives and are highly risky, so any investment decision and the associated risk is at the investor's own risk. We also do not provide any investment advisory services. We will never contact you to offer investment or advisory services.

