S&P 500 struggles for direction as investor await inflation data
The price of oil has been ranging, as market worries whipsaw between optimism on a reopening global economy versus the resurgence of COVID-19 in many parts of the world which might delay the resumption of business as usual. As well, other concerns include OPEC+ allowing more output and a cyclical cutback in Chinese demand.
One headwind for crude has been the outlook for green energy under the Biden Administration. The prediction being made by some is that oil could start sinking, beginning in 2023, plummeting to as little as $10 by 2050.
Meanwhile, analysts at Goldman Sachs forecast that oil will hit $80 this year, as the market will find itself shockingly low on supply relative to the surging demand brought about by the restarting economy. In the investment bank's view:
“The magnitude of the coming change in the volume of demand—a change which supply cannot match—must not be understated.”
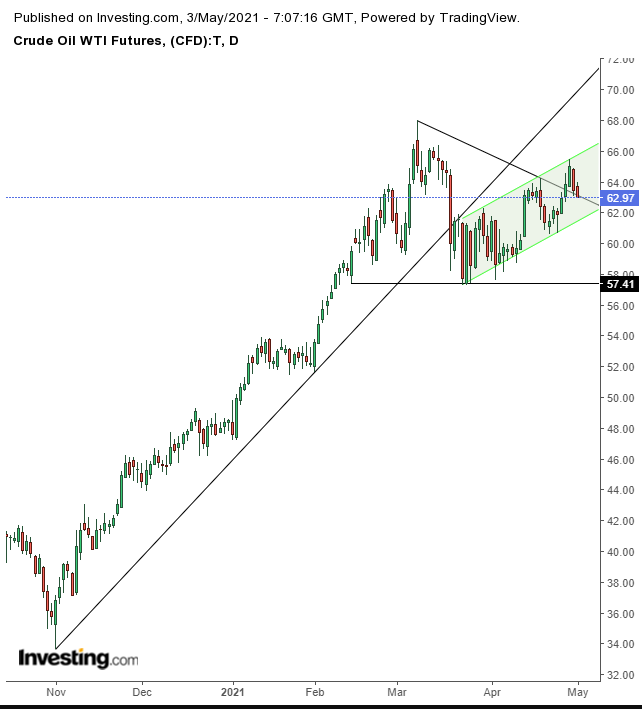
This supply and demand conflict is visible on the chart.

WTI fell below its rising channel since the Nov. 2 low, then proceeded to develop a descending channel. This pattern is shaped by sellers whose rising eagerness compels them to lower their offers while buyers remained cool, willing to bid only at certain levels. That's why this pattern is bearish. However, it’s complete only after downside breakout.
But here's where it gets interesting. The price broke to the topside, blowing out a pattern that's presumed to be bearish.
The effects of a pattern breaking to the opposite direction of where it’s expected to go often causes a market chain reaction that flips the dynamics from bearish to bullish.
Specifically, first, bears must cover their shorts. That's manifested as a sudden shot of demand, pushing prices higher. When the short squeeze is over, the price may stall or even return back toward the pattern.
The price should then find support by triggered long orders and those who’ve been waiting for some clarity on trajectory. At this point they may identify the breakout and would add their weight to the balance side of the equation, pushing prices up for a second leg higher.
By now, previous bears would be ready to get back in the game, joined by retail speculators. Most of the market is expected to be on the side of demand, pushing prices up for the third leg.
But before all that happens, currently the price is down for a second day, testing the top of the pattern. Notice the dotted red line. It demonstrates how the previous support, once broken, turned into a resistance, slowing progress.
At the moment, the price is finding support by the pattern top, but even if it falls back into the pattern, it could still rebound off the bottom of its current rising channel since the March low. Note, the channel bottom meets with the triangle top at $62, making it a presumed, reinforced support.
Based on the pattern height, which includes all the current interest in the contract, the implied target for oil is $74. Keep in mind, though, that even if it will, in fact, get there, it won’t do so in a straight line. That means traders can be stopped out of a winning position.
Trading Strategies – Long Position Setup
Conservative traders should wait for the price to make a new high above the Mar. 8, $67.98 high, then wait for a return move that creates a base.
Moderate traders would enter upon a return toward the channel bottom or the breakout of the red-dotted line.
Aggressive traders could enter a position at will, accepting the higher risk that goes with fewer confirmations, as part of the higher reward for being a step ahead of the market. Money management will be key.
If you don’t know how to customize a plan, here’s an example:
Trade Sample
- Entry: $63
- Stop-Loss: $62
- Risk: $1
- Target: $66
- Reward: $3
- Risk:Reward Ratio: 1:3
Author's Note: We don't have a crystal ball. We also don't claim to know the future. Our analysis could be wrong. And even if it’s right, it’s only so on a statistical basis. Even if the analysis would follow through this time, it doesn’t mean this trade sample will, or that it’s the best way to approach this trade.
You need to learn how to draw a plan that meets your timing, budget and temperament to maximize your odds. Till you do so, you can use our samples, but for educational purposes only. If you have fantasies of making money without understanding the full implication of the analysis, you will not. You will end up poor and unprepared for future trading.
