60%+ returns in 2025: Here’s how AI-powered stock investing has changed the game
- The S&P 500 and Nasdaq are set for potential breakouts amid strong gains.
- Key levels suggest pullbacks may provide re-entry points.
- Traders should watch for opportunities as indexes near resistance.
- Looking for actionable trade ideas to navigate the current market volatility? Unlock access to InvestingPro’s AI-selected stock winners for under $9 a month!
In the past month, the S&P 500 and Nasdaq have enjoyed solid gains, with global markets largely on course to end September in the green.
The long-term uptrend, which has been building for nearly two years, recently picked up momentum thanks to the Federal Reserve.
With a bold 50 basis point rate cut, the Fed kicked off what many expect to be a continued cycle of monetary easing.
Markets are already anticipating another rate cut at the next meeting.
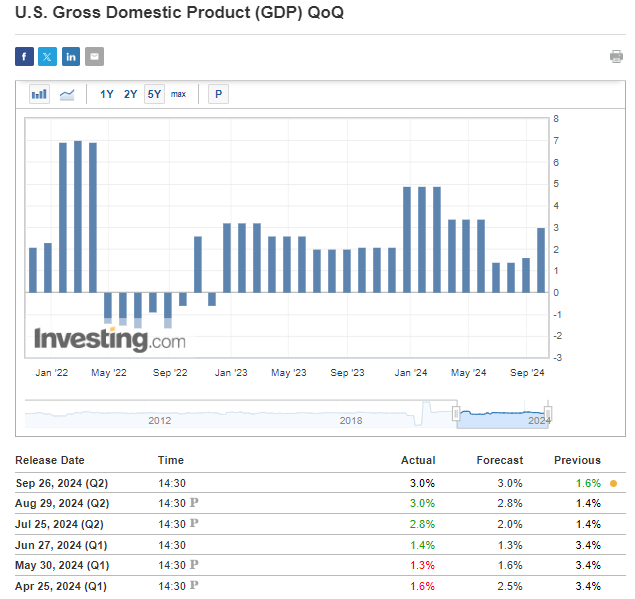
Importantly, recent economic data shows no signs of a looming recession, suggesting these rate cuts aren’t a rescue attempt but rather a calculated move to stimulate growth.

The People's Bank of China also contributed to the positive sentiment by cutting interest rates, unlocking over $140 billion in lending capacity to help achieve its 5% growth target for the year.
As markets look to end the week on a high, let's take a look at how the technical picture is shaping for key indexes.
S&P 500: Pullback in the Offing?
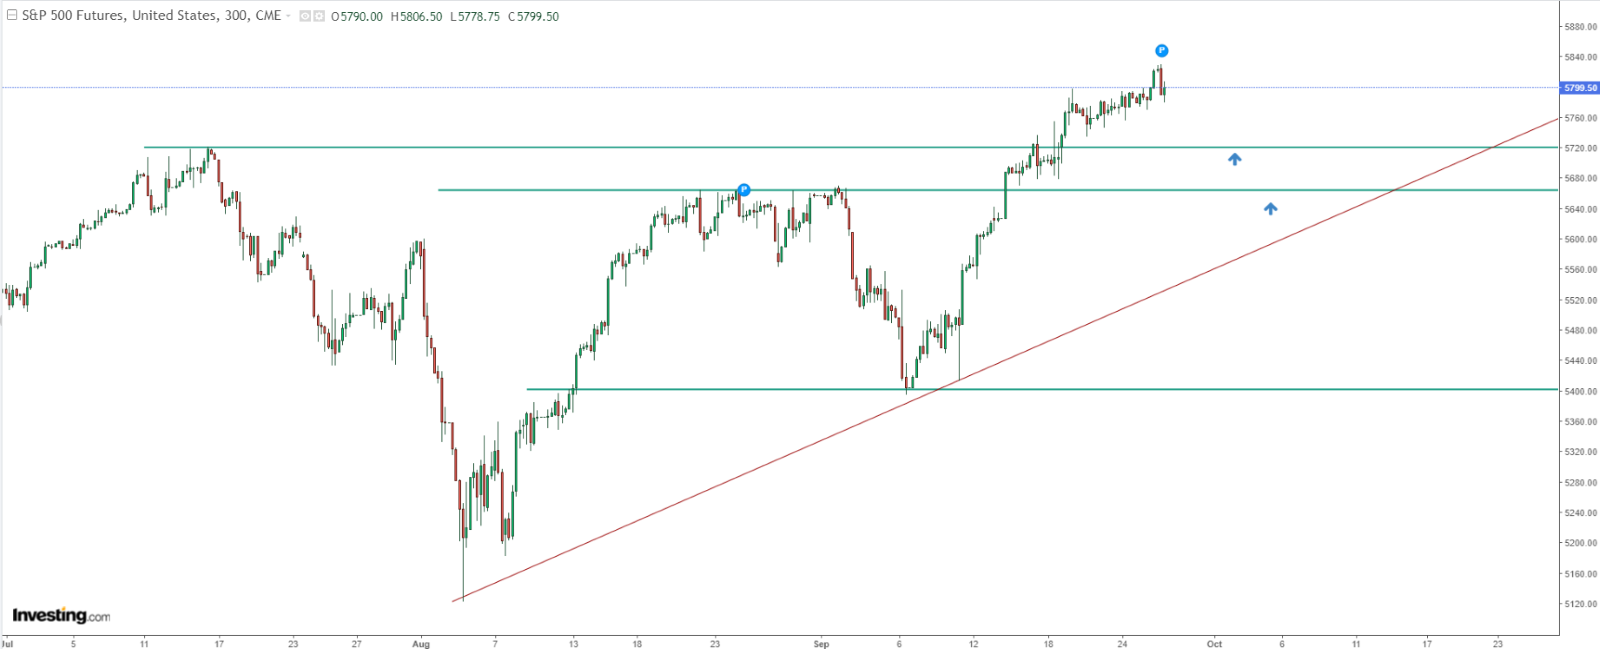
The S&P 500 has been a beacon of strength, recently pushing past its previous all-time highs.
This breakout signals robust market demand, driven largely by expectations of further rate cuts and favorable economic conditions.
From a technical perspective, this move has firmly established 5,720 points as a critical support level.
If the current pullback extends, this zone may act as the first line of defense for the bulls, offering an opportunity for traders to re-enter the market.

Beyond 5,720 points, a deeper correction could target the 5,660 level, where the upward trendline intersects.
This convergence of support levels suggests that any downside will likely be limited, allowing the broader uptrend to remain intact.
On the upside, the round number of 5,900 points represents the next significant resistance level.
If bullish momentum continues, the market could make a swift move toward this psychological barrier, setting the stage for further gains.
The bulls have clear targets ahead, with both technical indicators and sentiment favoring continued upside.
Nasdaq Eyes New Peaks
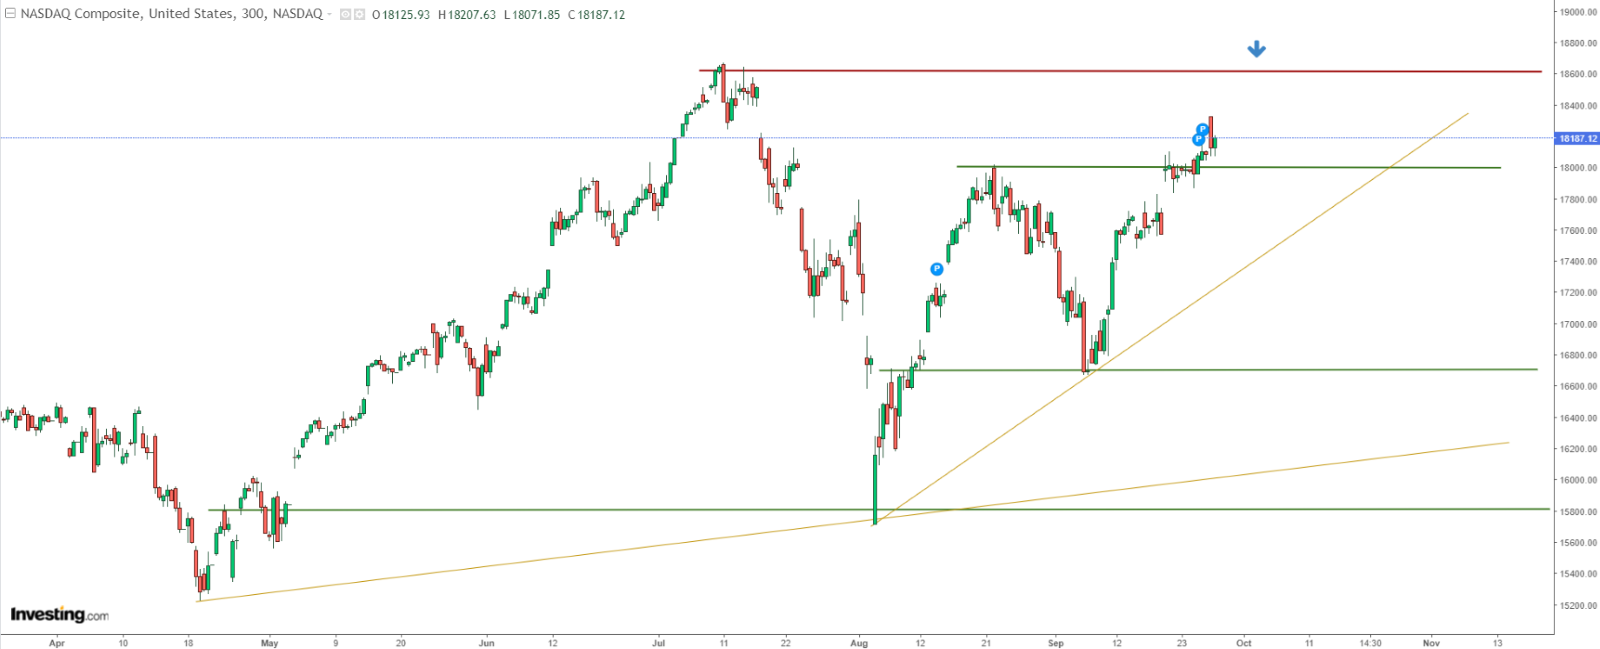
The Nasdaq, while slightly trailing the S&P 500, has exhibited signs of strength. The index recently broke through a key resistance level of around 18,000 points, a signal that momentum is building.
This breakout above a major psychological level marks a pivotal moment for the index, as it opens the path toward a retest of the all-time high near 18,600 points.
From a technical perspective, the NASDAQ’s next objective is clear—attacking this previous peak.

If a pullback occurs before the Nasdaq hits 18,600, traders should watch for support at the 18,000 level, which previously acted as resistance.
This zone now serves as a key inflection point for both short-term traders and long-term investors.
Should the the index breakthrough 18,600, the next logical target for the bulls will be 19,000 points.
A sustained rally toward 19,000 would further reinforce the uptrend, with technical indicators such as RSI and moving averages signaling continued bullish momentum.
DAX Surges with Nearly Vertical Gains
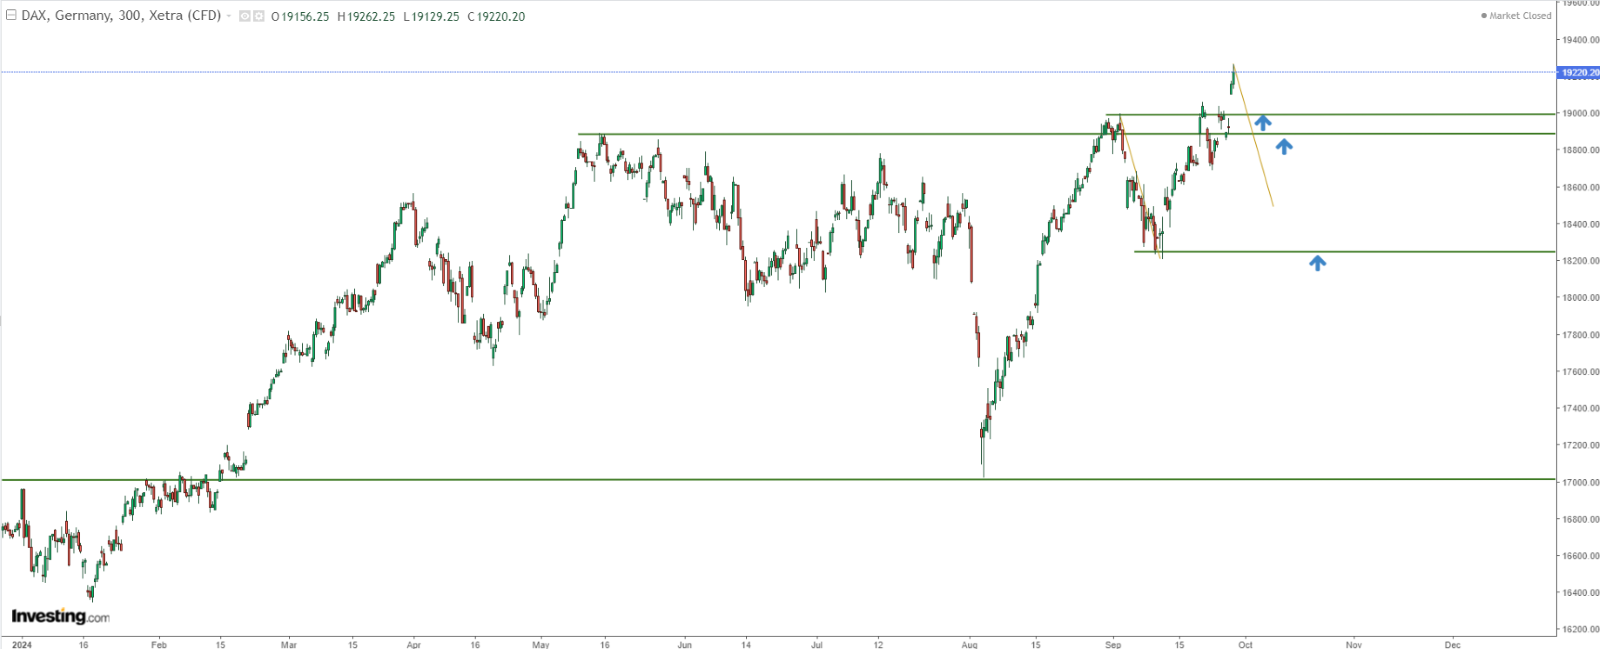
The German DAX leads the pack this month with a 3.34% return, reflecting near-vertical gains after breaking above 19,000 points.

In the event of a shallow correction, support is expected around the previous highs of 18,900 to 19,000 points, keeping the bullish momentum intact.
***
Disclaimer: This article is written for informational purposes only. It is not intended to encourage the purchase of assets in any way, nor does it constitute a solicitation, offer, recommendation or suggestion to invest. I would like to remind you that all assets are evaluated from multiple perspectives and are highly risky, so any investment decision and the associated risk is at the investor's own risk. We also do not provide any investment advisory services. We will never contact you to offer investment or advisory services.
