United Homes Group stock plunges after Nikki Haley, directors resign

- Positive sentiment follows the Fed's rate cut, hinting at a potential record opening for Wall Street.
- S&P 500 futures suggest a continued rally amid easing recession fears and favorable projections.
- Traders must stay alert as economic data and uncertainties could challenge the bullish trend.
- Looking for actionable trade ideas to navigate the current market volatility? Unlock access to InvestingPro’s AI-selected stock winners for under $9 a month!
For now, investor fears about a recession have eased judging by price action since the conclusion of the FOMC press conference.
While US equity indices fell into the close, futures have drifted back higher, signaling a positive start ahead for the S&P 500. In the early European trade, the S&P 500 Futures suggested Wall Street could open at a new record.
Fed delivers what the market wanted
The markets sold off after initially hitting new highs on the back of the Fed’s outsized rate cut on Wednesday. However, index futures have since stabilized, and the US dollar has resumed its sell-off.
It looks like Powell was able to successfully deliver the bigger cut that the markets were hoping to get, implying that this was a one-off and not to be confused with the sort of panic rate cuts that we had seen, for example, during the financial crisis.
The Fed chief said the 50-bps cut to mark the unwinding process of its historic tightening campaign would limit the risks of a downturn while the economy is still strong, saying that future moves would be based on how the economy performs.
Also helping to support stocks was a substantial revision in the Dot Plot projections. Investors have welcomed the Fed’s signal for a further 50 basis points of cuts this year, and another 100 next year. The terminal rate is now projected at 3.0% in 2026.
Can stocks sustain a rally?
So, the recovery means the S&P 500 futures are now on track to rise for the second consecutive week, turning higher for the month too, potentially on course to end higher for the fifth month in a row.
The index is up around 19% year-to-date, adding to its near 25% rise from the year before. The market was half-expecting a bigger rate cut and those expectations were realised.
So, the extra gains we have seen since the FOMC rate decision make at least some sense. But what now, after this impressive run?
Well, while the path of least resistance is clearly to the upside, there are a few obstacles that might derail the rally. Chief among these concerns is the potential for a sharper-than-expected slowdown in the global economy.
With China and the Eurozone struggling already, companies may find it difficult to continue delivering strong earnings like we have seen in recent quarters.
The threat of a fresh round of carry trade unwinding is there, too, should the Bank of Japan turn even more hawkish on Friday, just as the Fed has started cutting interest rates.
Though not so relevant thus far this time, September is typically a difficult month for equities, which means seasonality factors might come into play in the next few days.
On top of all this, the upcoming US presidential elections introduce more uncertainty, making investors more cautious about jumping into market rallies than under normal circumstances.
S&P 500 technical analysis and trade ideas
The bullish trend remained intact post the FOMC rate decision, even if we saw a weaker close on Wednesday. As I often bang on about it, it is all about follow-through.
Despite the bearish-looking inverted hammer, there was literally no downside follow-through in price action.
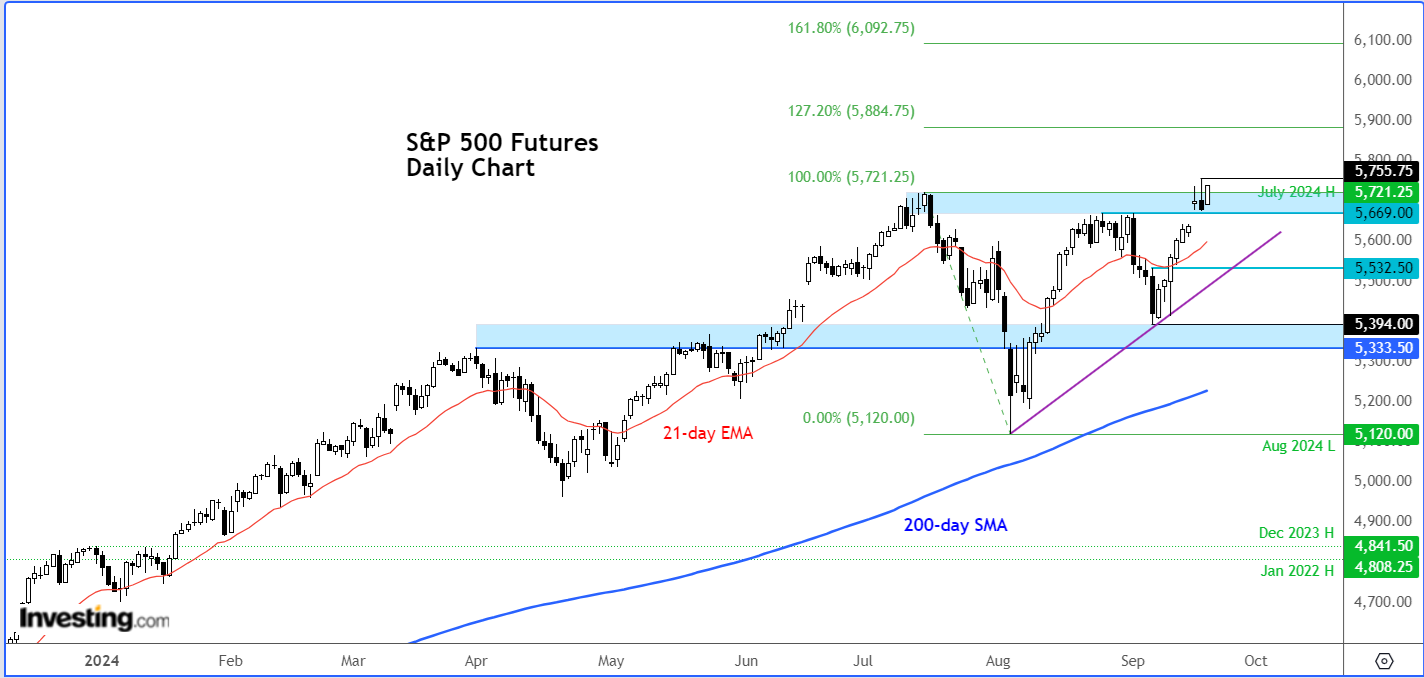
This means that the index has now had the go-ahead to finally break above the July peak of 5721. This level is now going to mark the top end of a key support area starting from 5669.
So, for as long as this 5669-5721 support area holds on any future dips, the short-term path of least resistance would remain to the upside.
Consequently, we could see an extension of the rally to 5,800 initially and potentially toward the Fibonacci extension levels shown on the chart, with the 127.2% level coming in at 5884.
However, if in the coming days we go back below the lower end of the abovementioned support i.e., 5669, then this would present a bearish signal, in which case the index may then fall back to at least its short-term trend line and the next support at 5532.
But for now, the higher highs mean the risks are tilted to the upside as the bulls clearly remain in control of price action.
What about the bears?
Well, there is still a risk that we might enter a bearish trend in the near future, but clearly, confirmation is needed given that we are trading at fresh record highs now.
So, bearish traders must wait patiently until getting some confirmation at least. A drop below the post-FOMC low now is a prerequisite for any bearish trades.
Put another way, bearish traders should be on the lookout for signs of another bull trap – perhaps similar to the mid-July dump we saw when the index ended its run of breaking to new highs at severally overbought levels (as per the RSI indicator, not shown on the chart) and the confirmation was a big bearish engulfing candle printed on 17 July.
Risk management remains key
But whether you're bullish or bearish, managing risk is essential, especially in today’s volatile market environment.
With election uncertainties and economic concerns on the rise, volatility is likely to stay high. Traders will want to stay nimble in the weeks ahead as the trend could easily change at any moment.
***
Disclaimer: This article is written for informational purposes only; it does not constitute a solicitation, offer, advice, counsel or recommendation to invest as such it is not intended to incentivize the purchase of assets in any way. I would like to remind you that any type of asset, is evaluated from multiple perspectives and is highly risky and therefore, any investment decision and the associated risk remains with the investor.