Oracle releases AI Database 26ai with built-in artificial intelligence
With the approach of the Dec. 15 deadline for the next batch of Chinese goods to be hit with tariffs by the U.S., investors—worn out by whipsawing news on whether a trade accord is near—are getting increasingly nervous. To date, neither side has budged from its position. As a result, on Friday, U.S. equities retreated from all-time highs, joining a global selloff, as markets await new trade developments.
China continues to insist that the U.S. completely rollback all tariffs via Phase I of the overall deal. The U.S., on the other hand, is only willing to cancel tariffs scheduled to go into effect on Dec. 15, but only upon signature of Phase I; it insists, instead, that it will only repeal the full array of tariffs when the final deal is inked.
Meanwhile, China’s biggest dollar-denominated bond sale took place last Tuesday. It raised $6 billion for the Asian nation, its biggest international bond sale ever. The country’s Ministry of Finance boasted that orders for the sale reached 3.6 times the issuance.
Major U.S. Indices Retreat From All-Time Highs, But Show Gains For November
All of the major U.S. indices—the S&P 500, NASDAQ Composite, Dow Jones Industrial Average and the Russell 2000—finished lower during Friday's shortened session after the Thanksgiving break. Trading volume was lighter than usual, about 16% below the 30-day average.
The S&P 500 slipped 0.4% from its all-time high, with every single sector in negative territory. Utilities 'outperformed' the laggards (-0.1%) with Energy leading the losses (-1.01%). Consumer Discretionary shares were the second worst performers, (-0.65%).
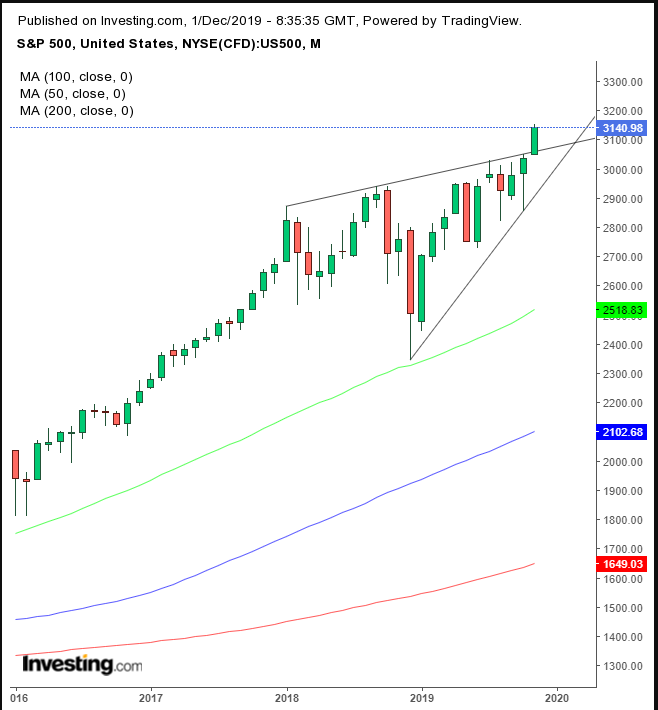
For the week, however, the SPX climbed, (+ 0.99%). Every sector was in the green, except Energy, (-1.57%), which slumped along with the price of oil. It was the benchmark index’s third consecutive monthly advance; the S&P 500 gained 3.43% for the month, 7.4% for the three month period. Technology (+5.95%), Healthcare (+5.47%), and Financials (+4.47%) shares led the pack while Energy (-0.89%), again, underperformed.

Technically, over the course of November, the S&P 500 traded almost entirely above the massive bearish, broadening formation, since January 2018, suggesting the market blew out the pattern.
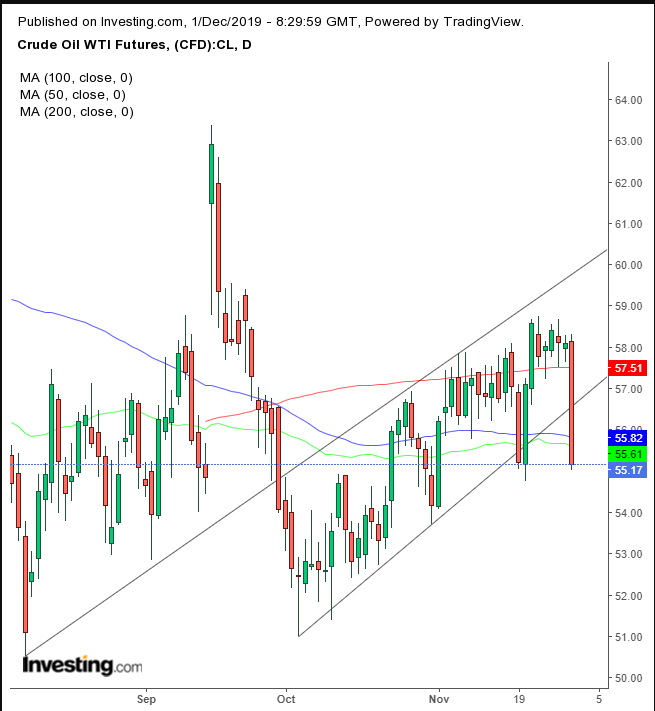
Oil posted its steepest weekly decline in nearly two months. WTI dropped below $57 amid signs that OPEC and OPEC+ don’t intend to increase production cuts at next week’s meeting.

From a technical perspective, crude oil fell below its rising channel since Oct. 3, as well as below all the major MAs. This is the second drop for the commodity below the channel bottom within 10 days.
Yields, including for the 10-year Treasury note, traded mixed after the holiday. Chris Rupkey, MUG Union Bank Chief Financial Economist says the bond market seems to have adopted the Fed’s view that baby boomer generation savings are what's driving down yields. As well, European and Japanese yields are zero or negative, driving money to the U.S. and pushing down Treasury yields even further.
However, Rupkey believes that U.S. monetary policy is what’s weighing most heavily on yields, as investors come to accept that the Fed will keep cutting rates to support growth. If the U.S. will, in fact, fall into a recession, yields will drop to a range of 0.75% to 1.00%, as the Fed will keep carving out historically low rates.
Rupkey argues the Fed is “trying to oversteer the economy.” He wishes the central bank would just set rates at a normal 2.5% to 3.5% level and simply “get out of the way.”

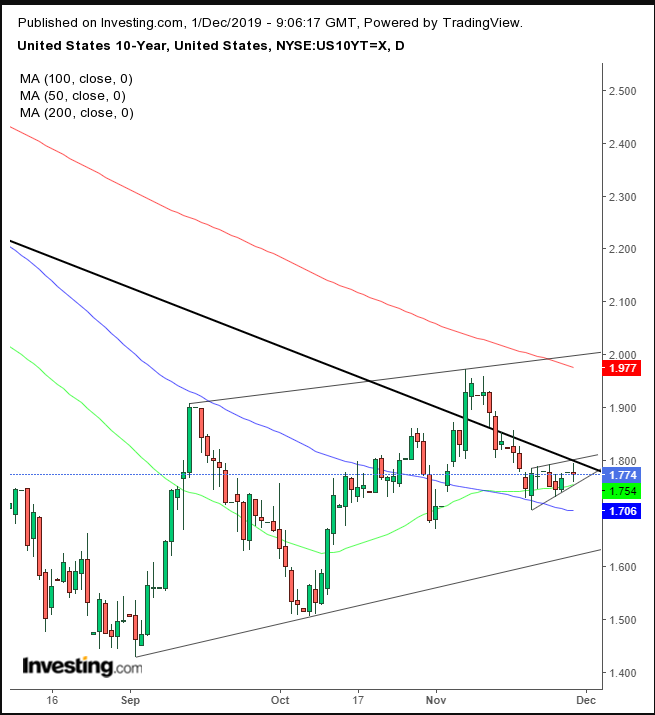
On the technical charts, yields are developing a rising flag, bearish after the preceding drop from Nov. 12 through 20, smack on top of the (thick) downtrend line since the November 2018 top. The 200 DMA has also been pressing on top of the short-term rising channel since the September bottom.

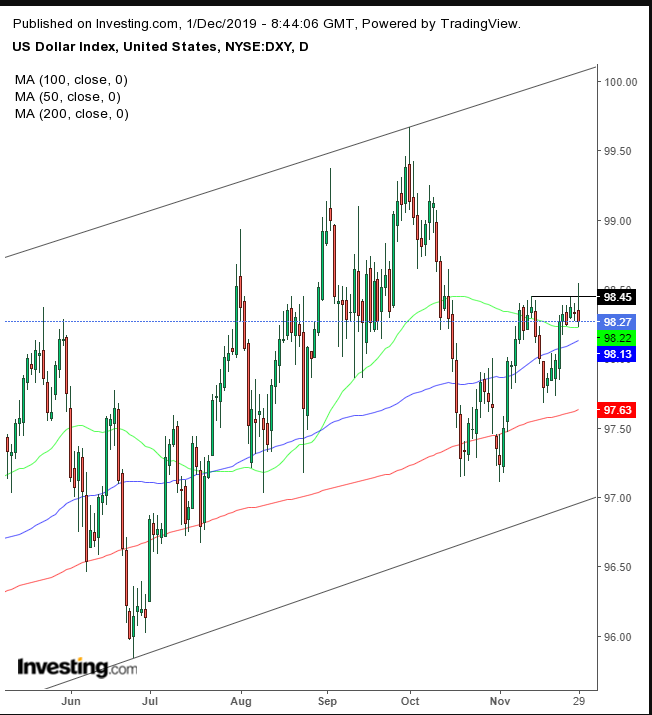
The dollar failed to break to the upside on Friday, from the Nov. 13 high, though it did post a higher intraday high within the rising channel since June 13, while remaining above the 50 DMA for the fifth session, after scaling above the 200, then 100 MAs.
The Bloomberg Dollar Index climbed for the ninth session in a row, its longest winning streak since January 2016. That may signal that the U.S. Dollar Index will follow.
As with everything else market-related right now, a U.S.-Sino trade pact is the wild card. The mid-December deadline looms large as both countries remain at an impasse. President Donald Trump’s signing of the Congressional bill supporting the democratic rights of Hong Kong protestors, people China considers terrorists, provoked China to threaten “strong counter-measures." Naturally, that's not something investors want to hear or see, particularly when stocks are already near the priciest they’ve ever been.
The Week Ahead
All times listed are EST
Sunday
20:45: China – Caixin Manufacturing PMI: probably edged down to 51.4 from 51.7.
Monday
3:55: Germany – Manufacturing PMI: expected to remain flat at 43.8, leaving the metric in contraction mode.
4:30: UK – Manufacturing PMI: seen to remain steady at 48.3, well below the 50.00 mark that signifies growth.
9:00: Eurozone – ECB President Lagarde Speaks
10:00: U.S. – ISM Manufacturing PMI: likely rose to 49.2 from 48.3 in November.
22:30: Australia – RBA Interest Rate Decision: forecast to stay at 0.75%.
Tuesday
4:30: UK – Construction PMI: expected to rise to 44.5 from 44.2, still well below growth metrics.
19:30: Australia – Q3 GDP: likely to stay flat at 0.5% for the third quarter, while rising to 1.7% from 1.4% on a yearly basis.
Wednesday
4:30: UK – Composite PMI: will probably remain flat at 48.5.
4:30: UK – Services PMI: seen to have also remained flat, at 48.6.
8:15: U.S. – ADP Nonfarm Employment Change: expected to have climbed to 140K from 125K.
10:00: U.S. – ISM Non-Manufacturing PMI: anticipated to edge down to 54.5 from 54.7.
10:00: Canada – BoC Interest Rate Decision: likely to remain at 1.75%.
10:30: U.S. – Crude Inventories: last week's stock was larger than expected, coming in at 1.572M barrels.
Thursday
10:00: Canada – Ivey PMI: seen to rise to 53.8 from 48.2, back into growth territory.
Friday
8:30: U.S. – Nonfarm Payrolls: expected to jump to 180K from 128K.
8:30: U.S. – Unemployment Rate: anticipated to remain flat at 3.6%.
8:30: Canada – Employment Change: to surge to 10.0K from -1.8K.
