Veeco launches Lumina+ MOCVD system, receives Rocket Lab order

Introduction & Market Context
AECOM (NYSE:ACM) presented its second quarter fiscal 2025 results on May 6, 2025, highlighting strong financial performance that enabled the company to raise its full-year guidance for the second consecutive quarter. The infrastructure consulting firm continues to benefit from robust demand across its key markets, with less than 35% of U.S. Infrastructure Investment and Jobs Act (IIJA) funding having been deployed to date.
In after-hours trading following the presentation, AECOM shares rose 2.76% to $105.00, reflecting positive investor sentiment about the company’s results and outlook.
Quarterly Performance Highlights
AECOM delivered impressive financial results in the second quarter of fiscal 2025, with adjusted earnings per share increasing 20% year-over-year to $1.25, up from $1.04 in Q2 2024. The company also reported substantial improvement in cash flow generation, with free cash flow surging 141% in Q2 and up 80% for the first half of fiscal 2025.
As shown in the following chart of quarterly highlights:
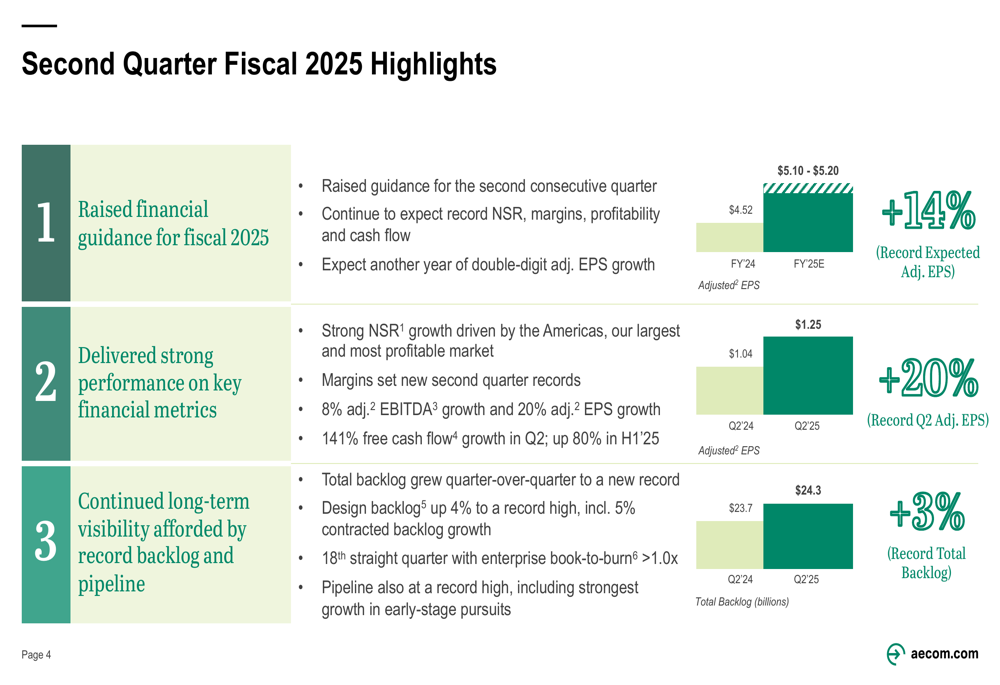
Total (EPA:TTEF) backlog grew by 3% year-over-year to a record $24.3 billion, with design backlog increasing 4% to a new record high. The company has now achieved 18 consecutive quarters with enterprise book-to-burn ratios exceeding 1.0x, indicating continued strong demand for AECOM’s services.
Raised Financial Guidance
Based on the strong performance in the first half of fiscal 2025 and robust backlog, AECOM raised its full-year guidance for the second consecutive quarter. The company maintained its projections for Net Service Revenue growth at 5-8% and segment adjusted operating margin at 16.1%, representing a 30 basis point improvement year-over-year.
The revised guidance is detailed in the following table:
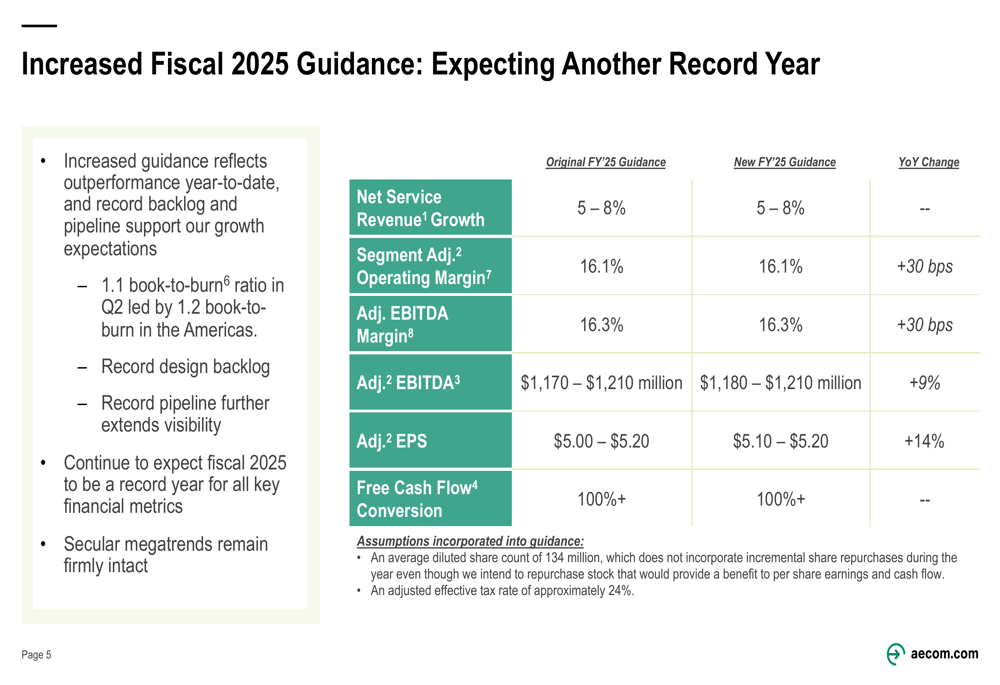
Notably, AECOM increased its adjusted EBITDA guidance to $1,180-$1,210 million, representing 9% year-over-year growth, and raised its adjusted EPS guidance to $5.10-$5.20, reflecting 14% growth compared to fiscal 2024. The company continues to expect free cash flow conversion of over 100% of adjusted net income.
Segment Performance
AECOM’s performance varied by geographic segment in the second quarter. The Americas segment, which represents the largest portion of the company’s business, delivered 6% growth in Net Service Revenue and achieved a 130 basis point improvement in adjusted operating margin to 19.4%. The International segment posted more modest growth of 1% in Net Service Revenue with a 10 basis point increase in adjusted operating margin to 11.1%.
The segment performance breakdown is illustrated in the following charts:
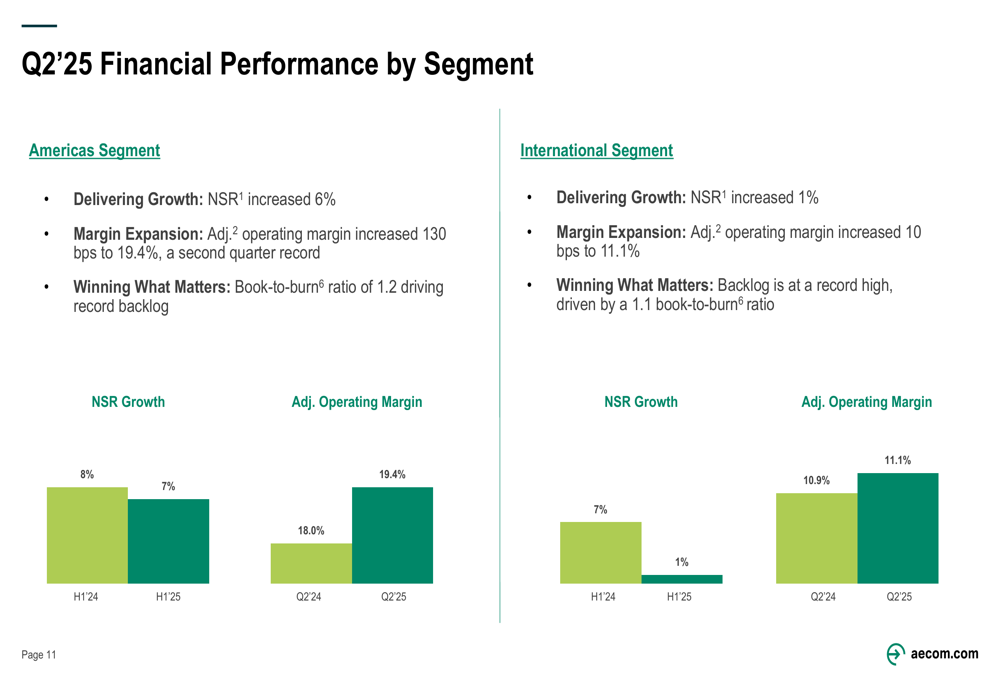
The company’s strong performance in the Americas was driven by continued infrastructure investment, particularly in transportation and water projects. The International segment faced some headwinds, including project reprioritization in the Middle East, but maintained near-record backlog levels.
Strategic Positioning and Market Outlook
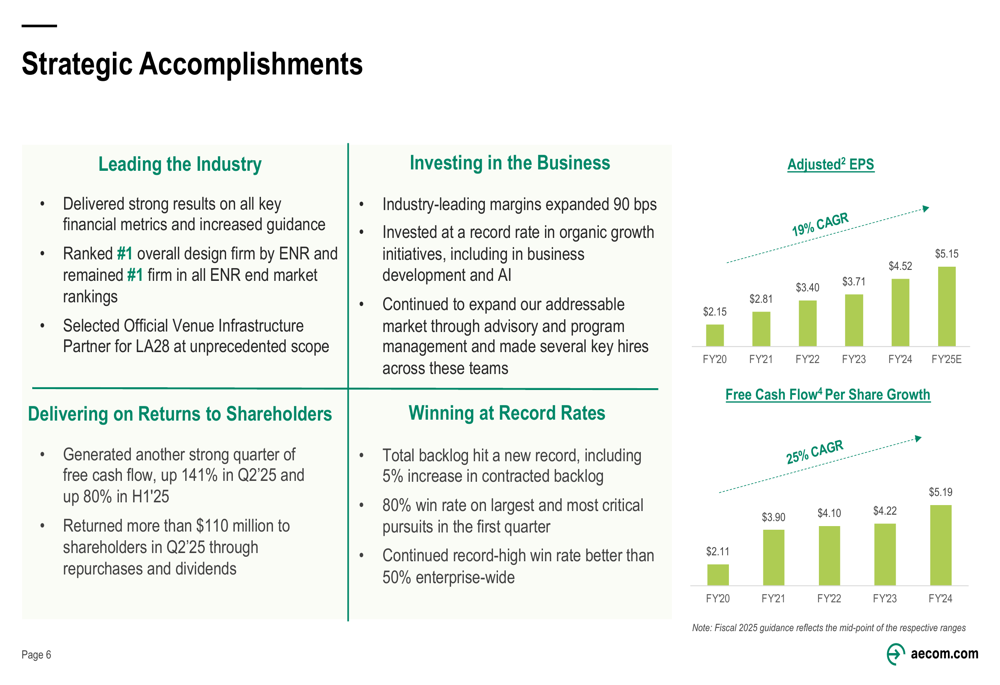
AECOM highlighted its strategic accomplishments and long-term growth trajectory, emphasizing its industry leadership position and consistent financial performance. The company has achieved a 19% compound annual growth rate in adjusted EPS from fiscal 2020 to fiscal 2025 (estimated) and a 25% CAGR in free cash flow per share from fiscal 2020 to fiscal 2024.
The following chart illustrates AECOM’s consistent growth in key financial metrics:
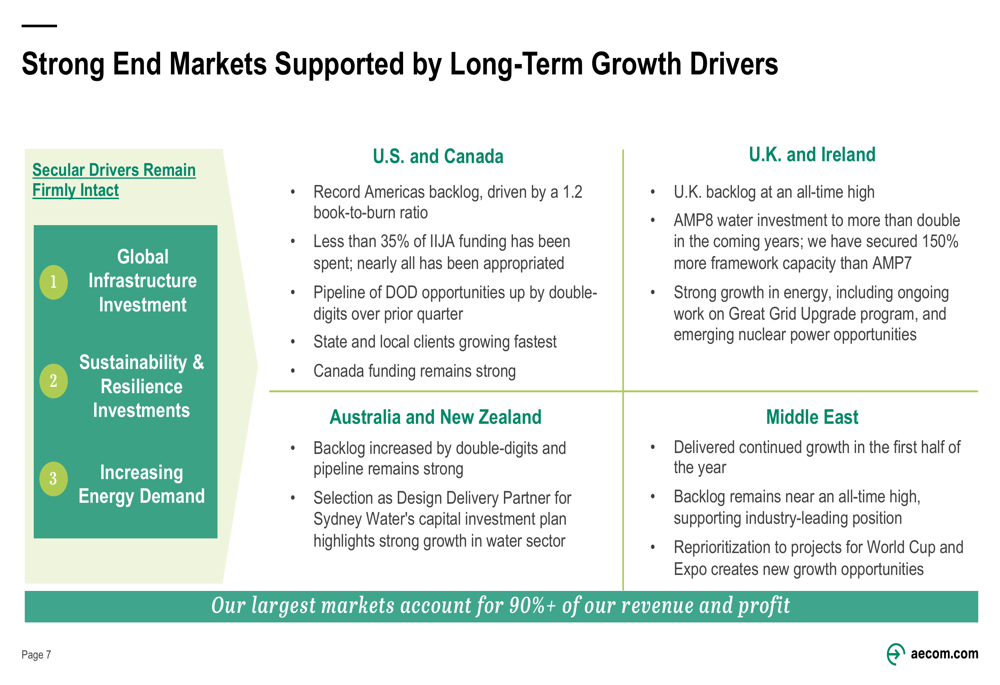
The company’s long-term growth is supported by several secular drivers, including global infrastructure investment, sustainability and resilience initiatives, and increasing energy demand. AECOM noted that its largest markets, which account for over 90% of revenue and profit, continue to show strength.
The company’s end market outlook is summarized in the following slide:
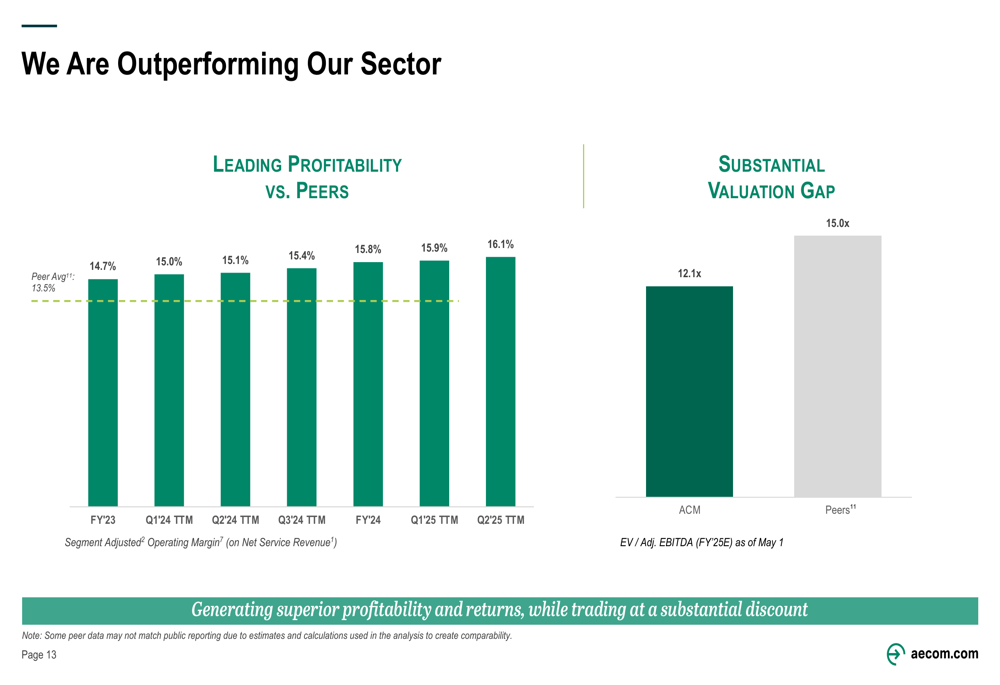
AECOM also emphasized its competitive positioning relative to peers, highlighting its superior profitability and potential for valuation expansion:
Capital Allocation and Shareholder Returns
AECOM continues to execute on its returns-based capital allocation strategy, focusing on shareholder value creation. In the second quarter, the company returned more than $110 million to shareholders through share repurchases and dividends, bringing the total for the first half of fiscal 2025 to $165 million.
The company’s capital allocation priorities and financial strength are detailed in the following slide:
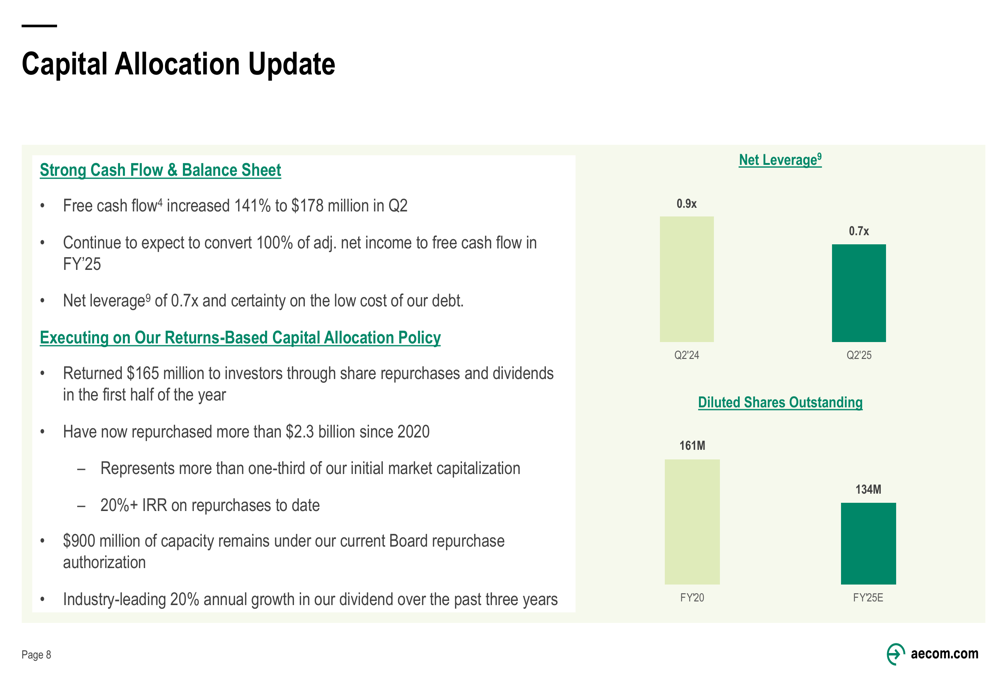
Since 2020, AECOM has repurchased more than $2.3 billion worth of shares, reducing its diluted shares outstanding from 161 million in fiscal 2020 to an expected 134 million in fiscal 2025. The company’s net leverage ratio improved to 0.7x in Q2 2025, down from 0.9x in the same period last year, providing financial flexibility for continued investment and shareholder returns.
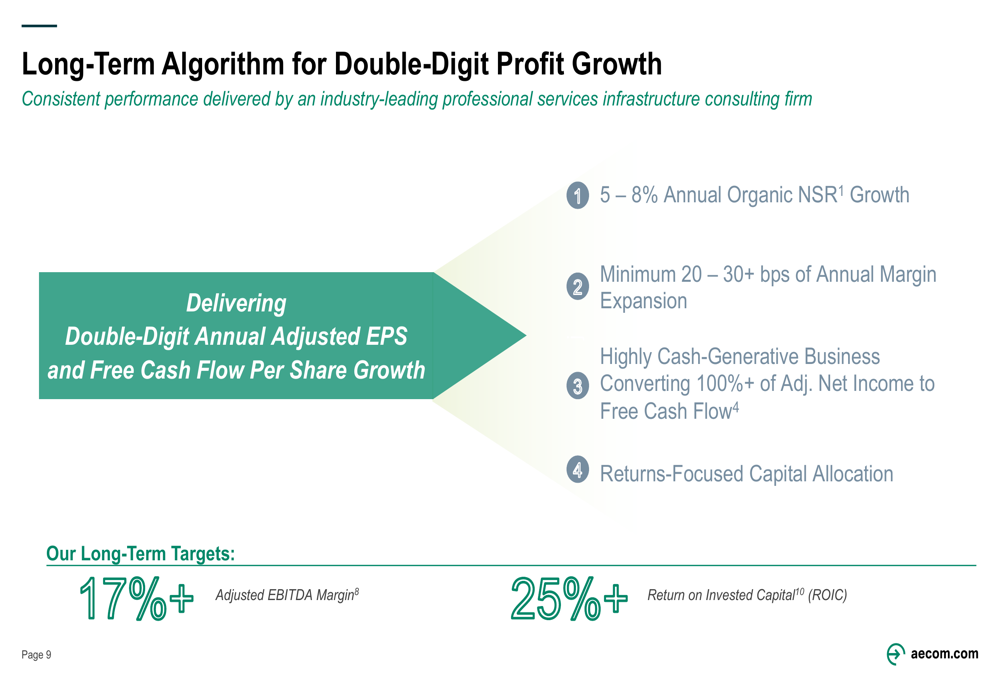
AECOM’s long-term algorithm for double-digit profit growth includes:
Looking ahead, AECOM remains well-positioned to capitalize on infrastructure spending trends across its key markets, with a focus on high-margin professional services and a diversified business model that spans multiple sectors and geographies.
Full presentation:
This article was generated with the support of AI and reviewed by an editor. For more information see our T&C.