Texas Roadhouse earnings missed by $0.05, revenue topped estimates

Introduction & Market Context
Aflac Incorporated (NYSE:AFL) released its second quarter 2025 presentation, revealing a stark contrast between GAAP and adjusted earnings metrics. The insurance giant’s stock traded up 0.87% in premarket at $99.78, showing modest investor confidence despite mixed results. This follows a challenging first quarter when the company missed both earnings and revenue expectations.
Quarterly Performance Highlights
The most striking figure from Aflac’s presentation is the 64.2% year-over-year decline in net earnings per diluted share, which fell from $3.10 in Q2 2024 to just $1.11 in Q2 2025. However, adjusted earnings metrics showed far more stability.
As shown in the following chart of quarterly earnings per share:
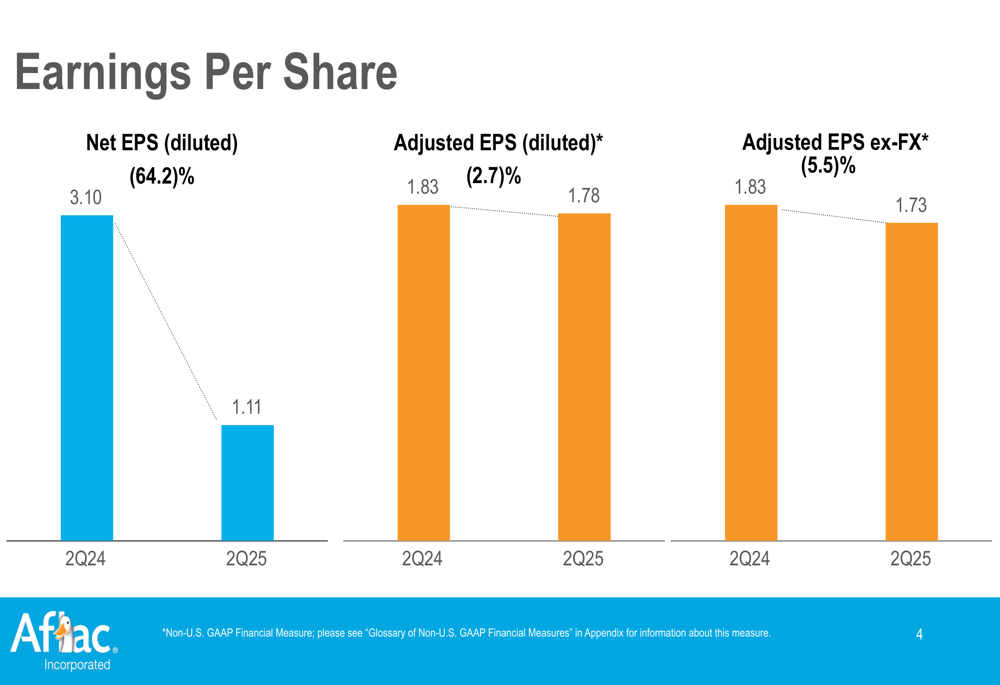
Adjusted EPS declined by a much more modest 2.7%, from $1.83 to $1.78. When excluding foreign exchange impacts, adjusted EPS fell 5.5% to $1.73. This significant divergence between GAAP and adjusted metrics suggests substantial one-time items or investment losses affected the quarter’s results.
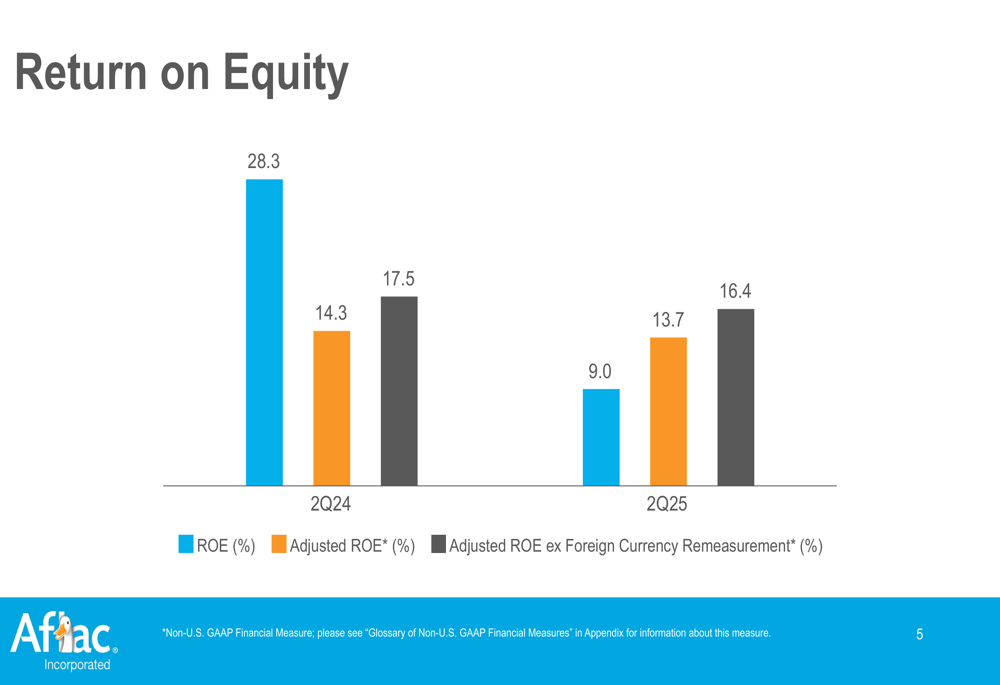
Return on equity metrics followed a similar pattern, with GAAP ROE plummeting from 28.3% to 9.0% year-over-year, while adjusted ROE showed a much smaller decline from 14.3% to 13.7%.
Detailed Financial Analysis
Aflac’s Japan segment, which has historically been a significant contributor to the company’s overall performance, maintained solid persistency at 93.7% in Q2 2025, indicating strong customer retention.
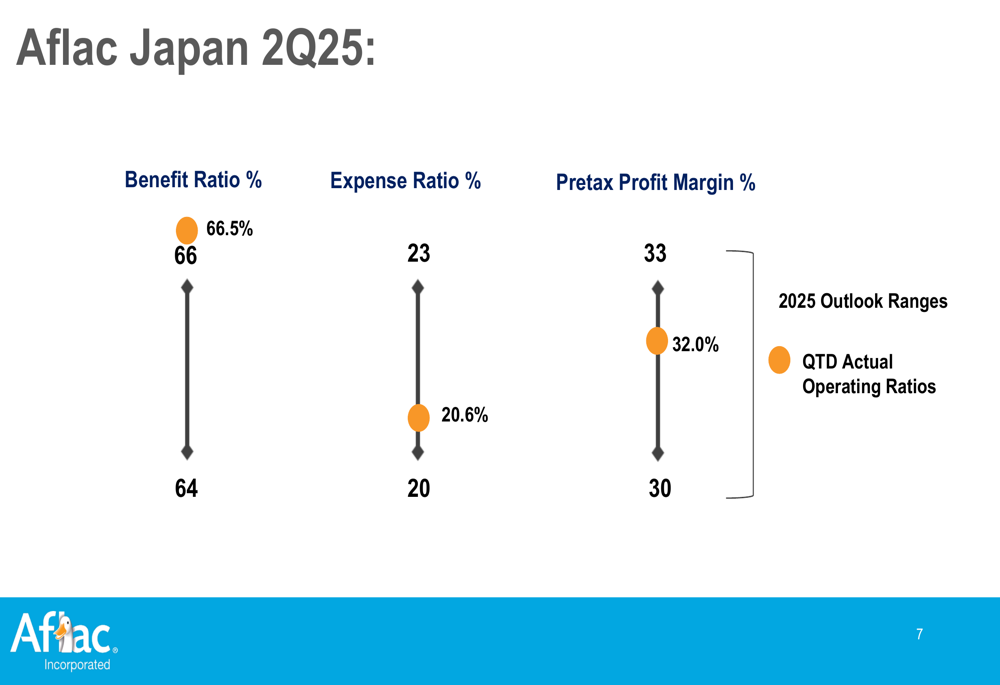
The Japan segment’s operating ratios remained largely within target ranges, with a benefit ratio of 66% (target:64-66.5%) and expense ratio of 20.6% (target:20-23%), resulting in a pretax profit margin of 32.0% (target:30-33%).
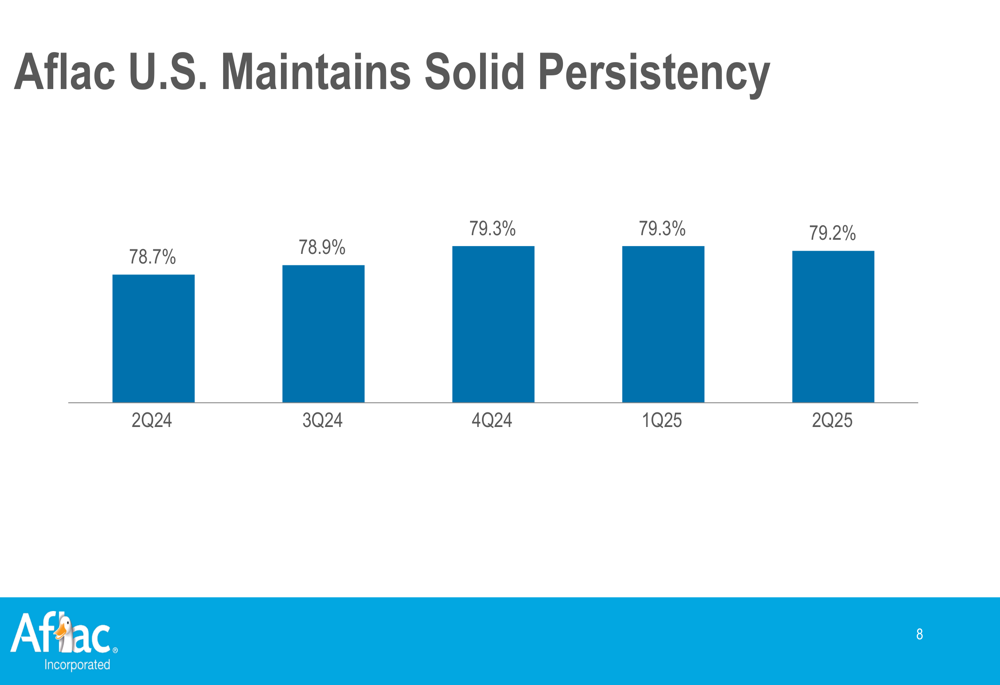
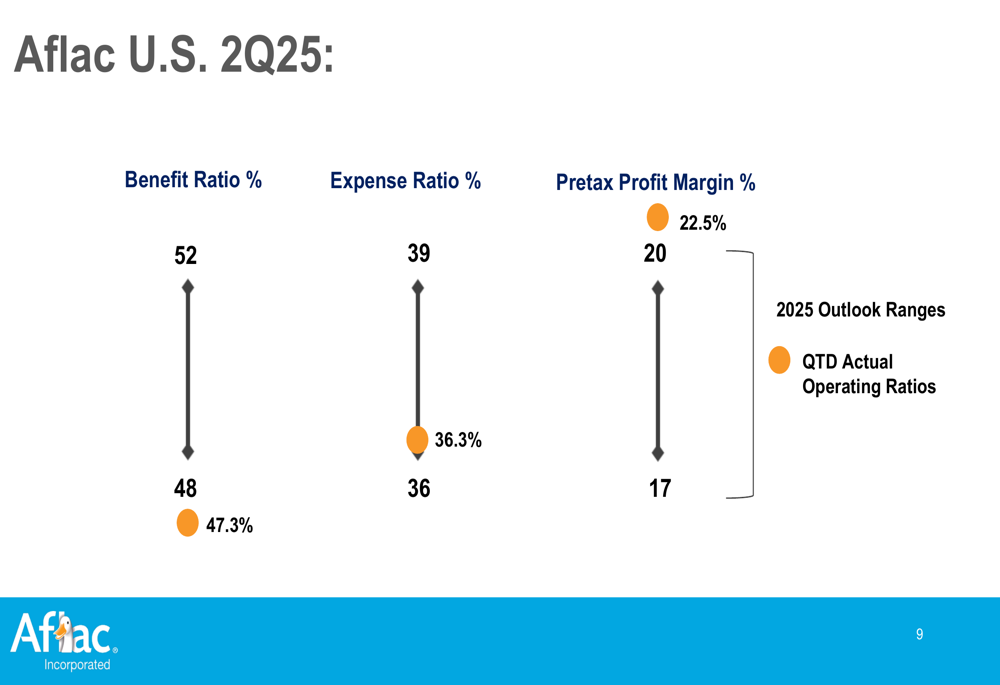
Similarly, Aflac’s U.S. segment showed strong persistency at 79.2% for Q2 2025, reflecting stable customer retention in the domestic market.
The U.S. segment’s operating metrics were particularly strong, with the benefit ratio at 47.3%, slightly below the target range of 48-52%, and the expense ratio at 36.3%, within the target range of 36-39%. Notably, the U.S. pretax profit margin exceeded expectations at 22.5%, above the target range of 17-20%.
Strategic Initiatives
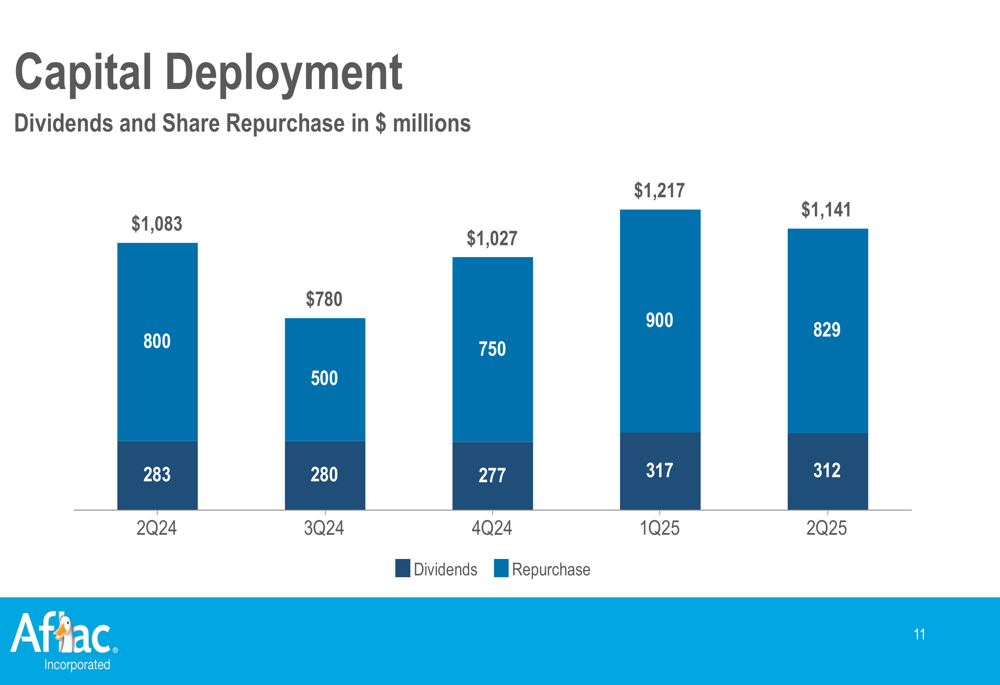
Despite earnings pressure, Aflac maintained robust capital deployment, returning $1.14 billion to shareholders in Q2 2025 through a combination of $829 million in dividends and $312 million in share repurchases. This represents a continuation of the company’s strong shareholder return strategy, with total capital deployment exceeding $1 billion for the fifth consecutive quarter.
The following chart illustrates Aflac’s consistent capital deployment strategy:
This substantial capital return comes despite the challenges faced in the first quarter, when Aflac reported revenue of $3.4 billion, significantly below the forecast of $4.26 billion, and adjusted EPS of $1.66, slightly missing expectations of $1.68.
Forward-Looking Statements
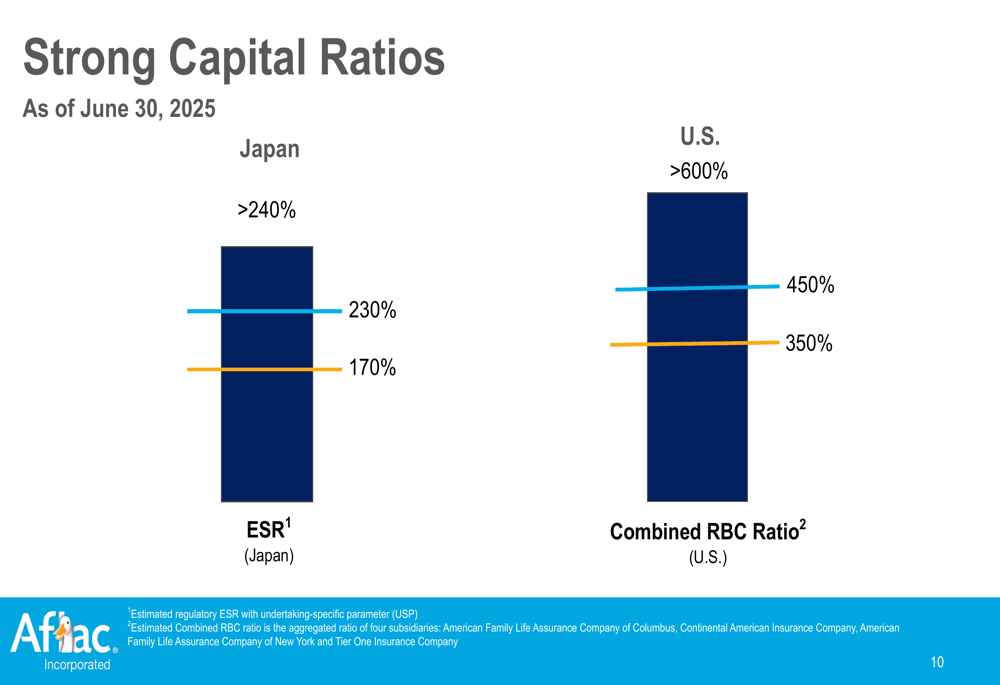
Aflac’s capital position remains strong, with the Japan segment reporting an Estimated Solvency Ratio (ESR) of 230%, well within the target range of 170% to >240%. Similarly, the U.S. segment’s Risk-Based Capital (RBC) ratio stands at 450%, comfortably within the target range of 350% to >600%.
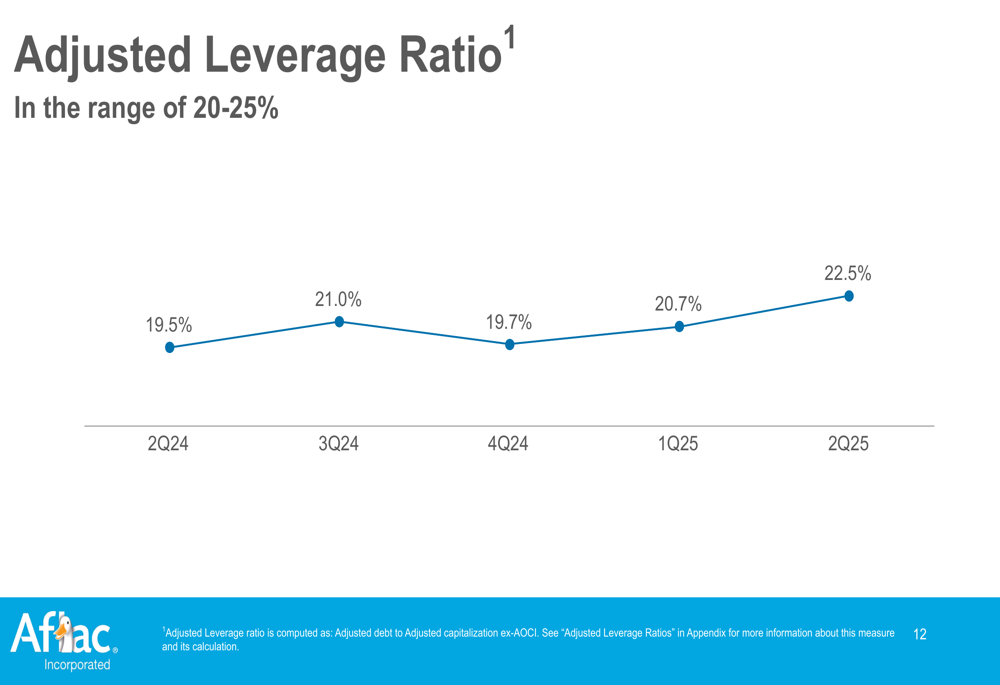
However, the company’s adjusted leverage ratio has been trending upward, reaching 22.5% in Q2 2025 compared to 19.5% in Q2 2024. While still within acceptable limits, this increasing leverage warrants monitoring as it could impact financial flexibility.
Conclusion
Aflac’s Q2 2025 presentation reveals a company navigating challenges while maintaining operational stability. The dramatic difference between GAAP and adjusted earnings metrics highlights significant one-time factors affecting reported results. Despite these challenges, Aflac continues to demonstrate financial discipline through consistent capital deployment and maintaining key operating metrics within target ranges.
Investors will likely focus on the company’s ability to stabilize net earnings in coming quarters while maintaining the strong capital position and shareholder returns that have been hallmarks of Aflac’s strategy. With the stock trading around $99.78, well below its 52-week high of $115.50, market sentiment appears cautious but not alarmed by the mixed results.
Full presentation:
This article was generated with the support of AI and reviewed by an editor. For more information see our T&C.