German construction sector still in recession, civil engineering only bright spot

Introduction & Market Context
Bank of America (NYSE:BAC) released its second quarter 2025 financial results on July 16, showing year-over-year growth across key metrics but a sequential decline from the first quarter’s performance. The bank reported revenue of $26.5 billion, up 4% year-over-year but down from $27.4 billion in Q1 2025. In premarket trading, BAC shares were down 0.54% to $45.90, suggesting investors had mixed reactions to the results.
The presentation highlighted the bank’s continued focus on organic growth, digital transformation, and artificial intelligence initiatives amid a challenging interest rate environment. While the quarterly performance demonstrated resilience with 4% revenue growth and 7% EPS growth year-over-year, the sequential decline from Q1 raises questions about growth momentum in the second half of 2025.
Quarterly Performance Highlights
Bank of America reported net income of $7.1 billion for Q2 2025, representing a 3% increase year-over-year but a decline from $7.4 billion in Q1. Earnings per share came in at $0.89, up 7% from the same period last year but below the $0.90 reported in the previous quarter.
As shown in the following summary of Q2 2025 financial results, the bank maintained healthy returns with a Return on Equity (ROE) of 10.0% and Return on Tangible Common Equity (ROTCE) of 13.4%:
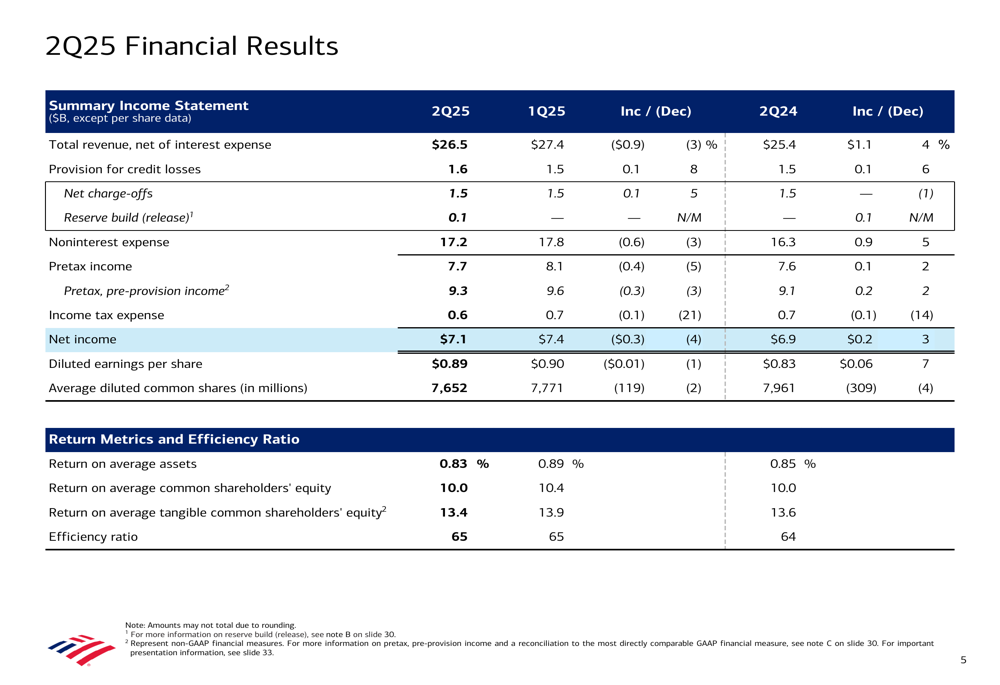
The bank’s balance sheet remained strong with total deposits of $2.0 trillion, up 5% year-over-year. Average loans and leases increased by 7% to $1.13 trillion, demonstrating continued lending growth across segments. The Common Equity Tier 1 (CET1) ratio stood at 11.5%, well above regulatory requirements, though slightly down from 11.8% in the previous quarter.
The detailed financial highlights reveal that Net Interest Income (NII) grew to $14.7 billion, a 7% increase year-over-year and a 2% increase from the previous quarter, showing resilience in the bank’s core earnings power:
Balance Sheet and Capital Position
Bank of America maintained a robust balance sheet with total assets of $3.44 trillion. The bank’s liquidity position remained strong with average Global Liquidity Sources of $938 billion. Book value per share increased to $37.13, an 8% improvement from Q2 2024, while tangible book value per share rose to $27.71, up 9% year-over-year.
As illustrated in the following balance sheet summary, the bank continued to prioritize capital strength while returning value to shareholders through $2.0 billion in common dividends and $5.3 billion in share repurchases:
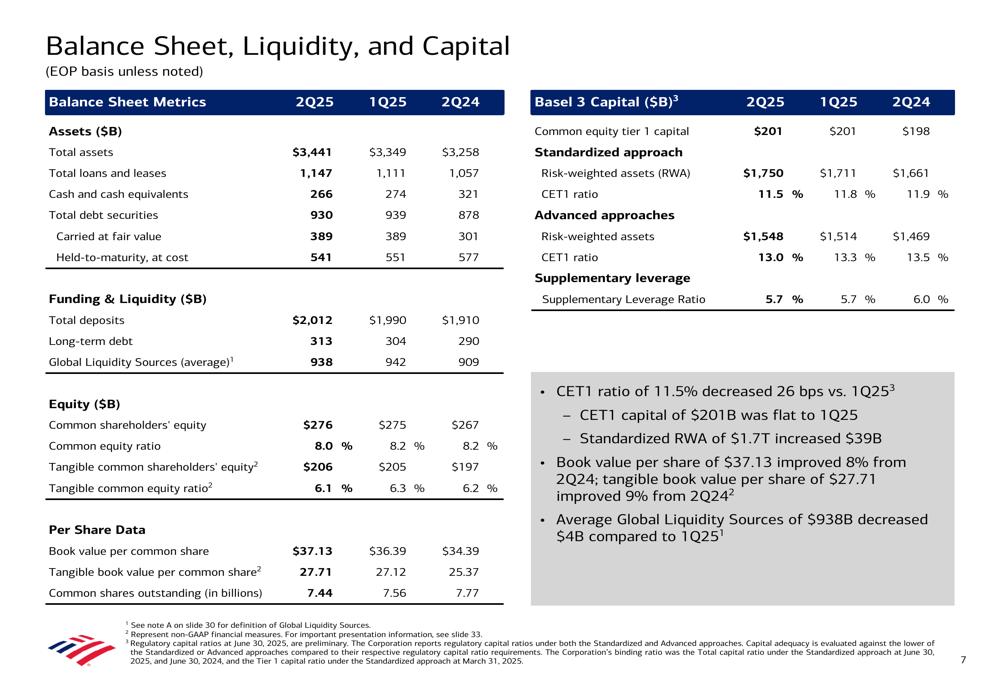
The bank announced plans to increase its quarterly common dividend by 8%, demonstrating confidence in its financial position and commitment to shareholder returns despite the sequential decline in quarterly performance.
Segment Performance
Bank of America reported organic growth across all business segments, with particularly strong performance in Global Markets and continued momentum in Consumer Banking and Global Wealth & Investment Management.
The following chart illustrates the bank’s organic growth across different business segments, highlighting key achievements such as 26 consecutive quarters of net checking account growth in Consumer Banking and record sales and trading revenue in Global Markets:
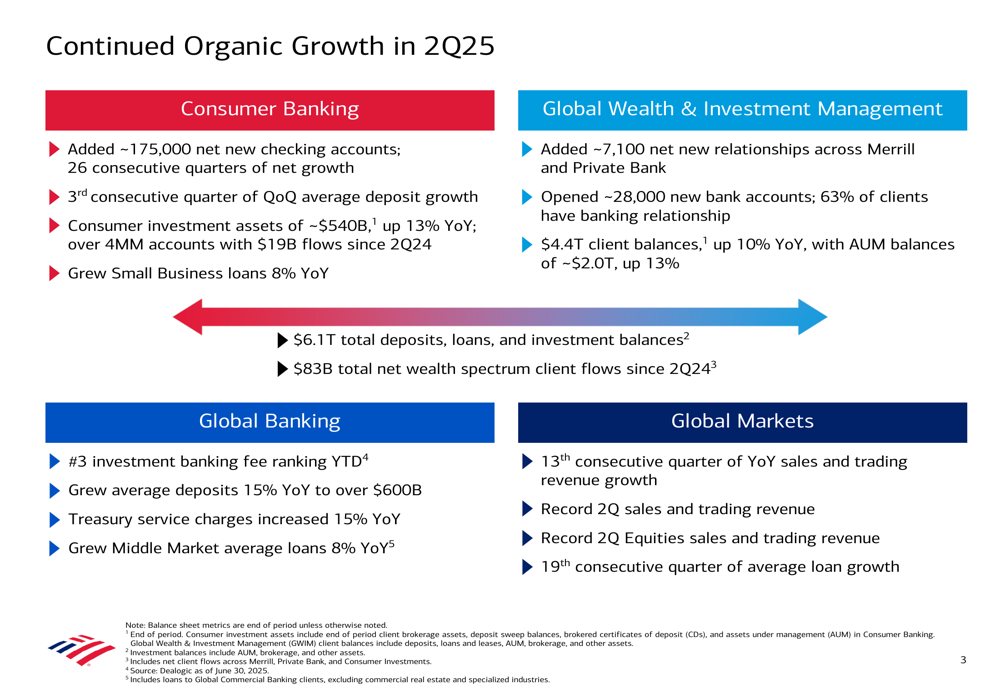
Consumer Banking delivered net income of $2.97 billion with an efficiency ratio of 51%. The segment added approximately 175,000 net new checking accounts and grew consumer investment assets to $540 billion, up 13% year-over-year.
Global Wealth & Investment Management reported net income of $993 million with client balances reaching $4.4 trillion, up 10% year-over-year. The segment added approximately 7,100 net new relationships across Merrill and Private Bank.
Global Banking generated net income of $1.7 billion, maintaining the #3 position in investment banking fee ranking year-to-date. The segment grew average deposits by 15% year-over-year to over $600 billion.
Global Markets delivered a strong performance with net income of $1.53 billion, marking the 13th consecutive quarter of year-over-year sales and trading revenue growth. The segment achieved record second-quarter sales and trading revenue, particularly in Equities.
Asset Quality
Bank of America’s asset quality remained stable with net charge-offs of $1.5 billion, relatively flat compared to both the previous quarter and the same period last year. The provision for credit losses was $1.6 billion, slightly up from $1.5 billion in both Q1 2025 and Q2 2024.
As shown in the following asset quality chart, the bank maintained an allowance for loan and lease losses of $13.3 billion, representing 1.17% of total loans and leases:
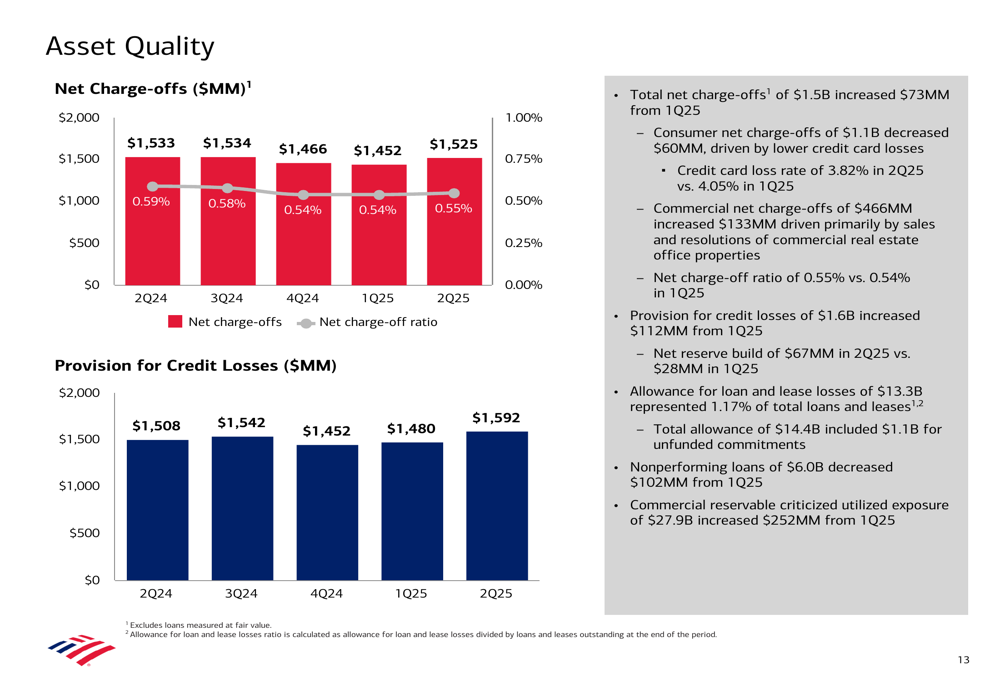
Commercial net charge-offs increased by $133 million from the previous quarter, while consumer credit performance remained relatively stable. Nonperforming loans decreased by $102 million from Q1 2025, indicating continued strength in overall credit quality.
Digital and AI Initiatives
A significant portion of the presentation focused on Bank of America’s investments in artificial intelligence and digital capabilities. The bank highlighted its AI applications across various operations, including customer service, search and summarization, content generation, and operations.
The following slide details how Bank of America is leveraging AI across its enterprise, with notable achievements such as 20 million active consumer Erica users and AI-enabled fraud detection models:
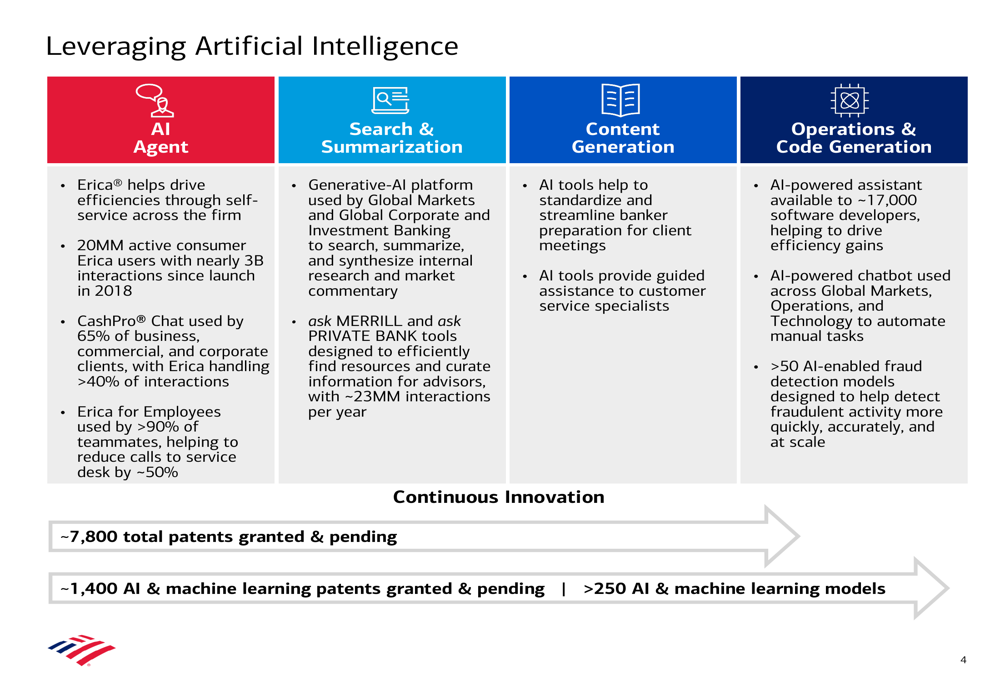
Digital engagement continued to grow across all segments, with 79% of consumer households digitally active and 86% of Global Wealth & Investment Management households digitally engaged. The bank’s digital assistant, Erica, has recorded nearly 3 billion interactions since its launch in 2018, demonstrating strong adoption of digital tools.
Forward Outlook
Looking ahead, Bank of America provided a positive outlook for Net Interest Income, projecting growth to between $15.5 billion and $15.7 billion by the fourth quarter of 2025. This outlook aligns with the guidance provided in the previous quarter and suggests confidence in continued NII expansion despite anticipated interest rate cuts.
The following chart illustrates the bank’s Net Interest Income outlook, factoring in various elements including day count, fixed-rate asset repricing, interest rate cuts, and balance sheet growth:
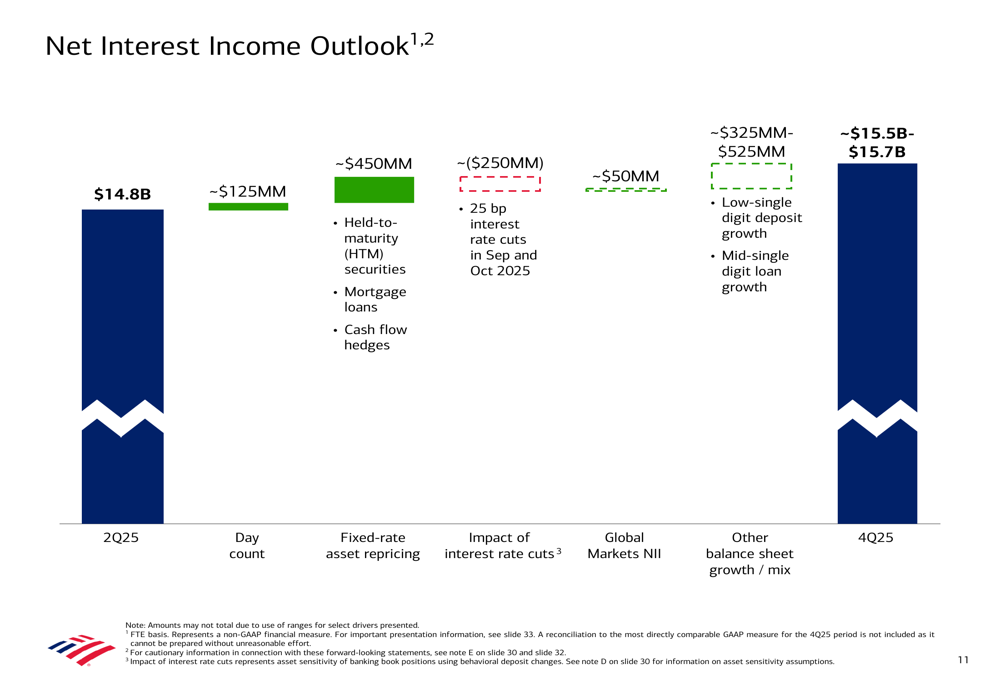
Management expects to deliver operating leverage in the second half of 2025, indicating improved efficiency and potentially stronger earnings growth. The bank also anticipates continued organic growth across segments, supported by ongoing investments in technology and digital capabilities.
Conclusion
Bank of America’s Q2 2025 financial results demonstrate resilience with solid year-over-year growth, though the sequential decline from Q1 suggests potential challenges ahead. The bank’s continued investments in AI and digital capabilities, combined with strong organic growth across segments, position it well for future growth despite the evolving economic environment.
While investors may be concerned about the quarter-over-quarter decline in revenue and earnings, the bank’s robust capital position, healthy returns, and positive NII outlook provide reasons for optimism. As Bank of America navigates through the second half of 2025, its ability to maintain growth momentum while managing expenses and credit quality will be crucial for sustaining investor confidence.
Full presentation:
This article was generated with the support of AI and reviewed by an editor. For more information see our T&C.