US LNG exports surge but will buyers in China turn up?

Bank7 Corp (NASDAQ:BSVN) released its second-quarter 2025 earnings presentation on July 17, 2025, highlighting continued earnings growth and industry-leading performance metrics. The community bank reported earnings per share of $1.16, representing a 7.4% increase from the previous quarter’s $1.08, which had already exceeded analyst expectations.
Quarterly Performance Highlights
Bank7 reported net income of $11.1 million for Q2 2025, a 7.4% increase from $10.3 million in Q1. Total (EPA:TTEF) assets grew to $1.84 billion, up 2.8% from the previous quarter, while total loans increased by 5.2% to $1.50 billion. The bank maintained a strong return on average assets (ROAA) of 2.47%, improving from 2.41% in Q1.
The bank’s net interest margin (excluding loan fees) was 4.61%, slightly down from 4.69% in the previous quarter, but still significantly outperforming industry peers. The efficiency ratio remained excellent at 39.95%, reflecting the bank’s disciplined approach to expense management.
As shown in the following corporate overview slide, Bank7 delivered strong performance across key metrics:
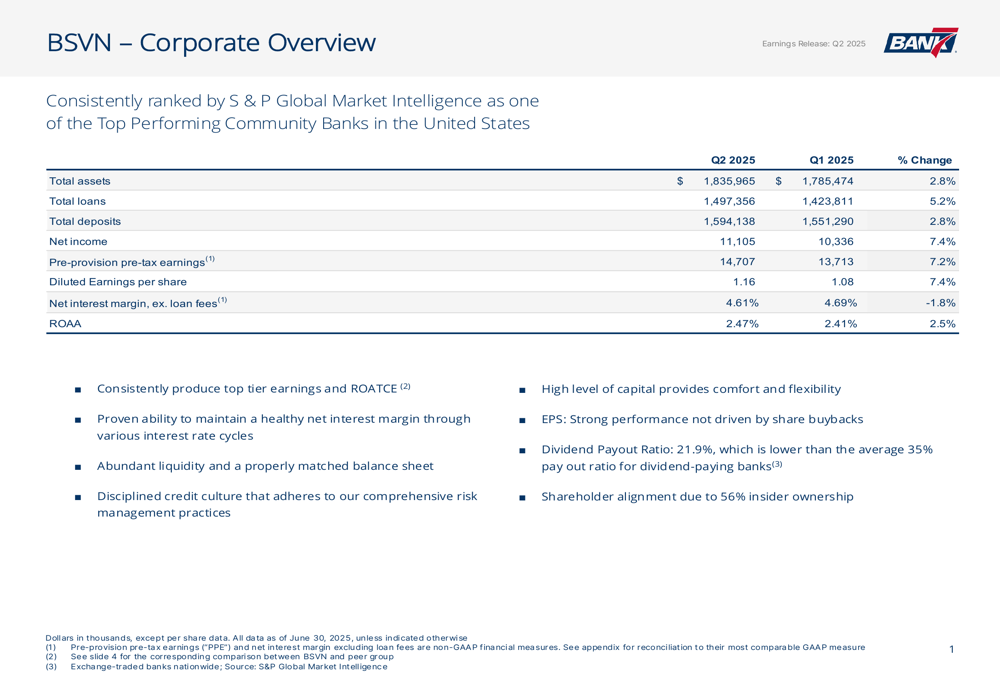
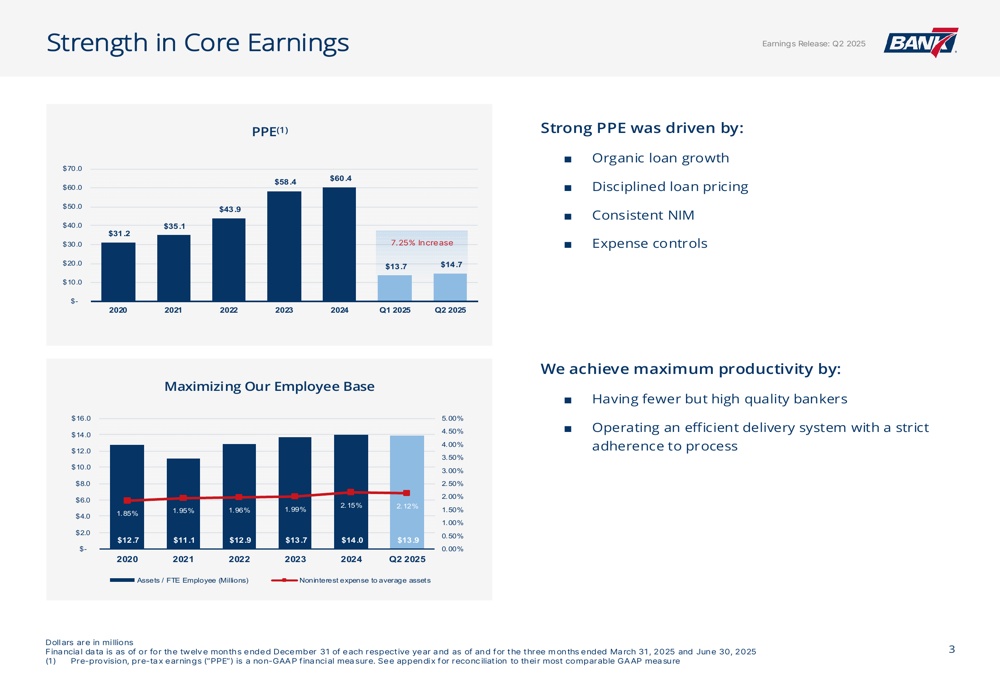
Pre-provision pre-tax earnings increased to $14.7 million in Q2 2025, representing a 7.2% increase from the previous quarter. This continues a trend of consistent earnings growth, as illustrated in the following chart:
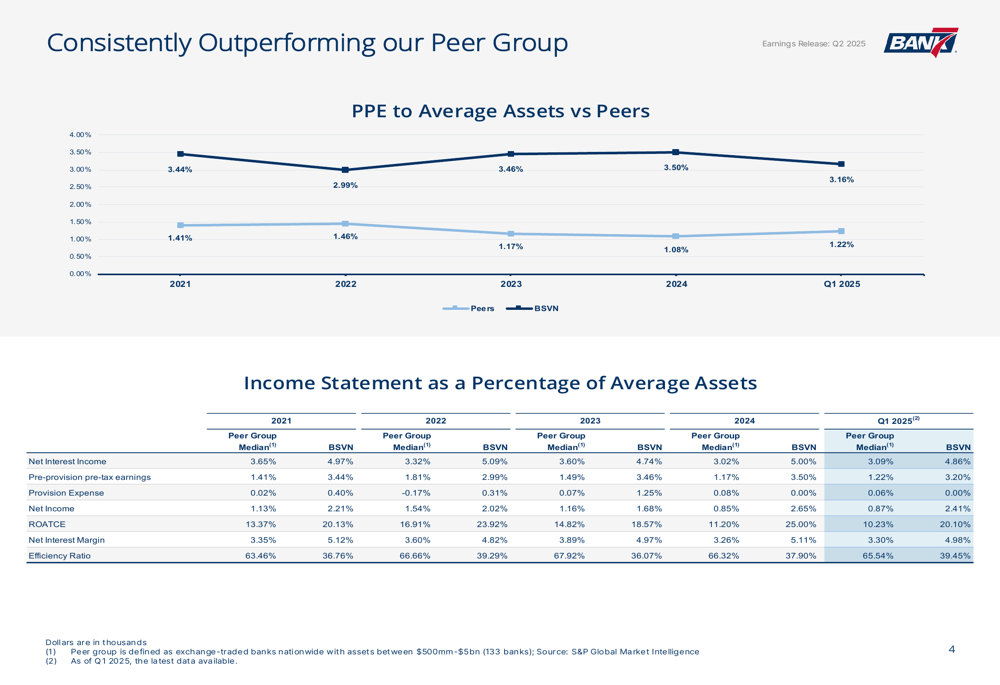
Competitive Industry Position
Bank7 continues to significantly outperform its peer group across multiple key performance metrics. The bank’s pre-provision pre-tax earnings to average assets ratio of 3.20% in Q1 2025 was nearly triple the peer group median of 1.22%. Similarly, Bank7’s net interest margin of 4.98% substantially exceeded the peer median of 3.30%.
The following comparison highlights Bank7’s consistent outperformance versus its banking peers:
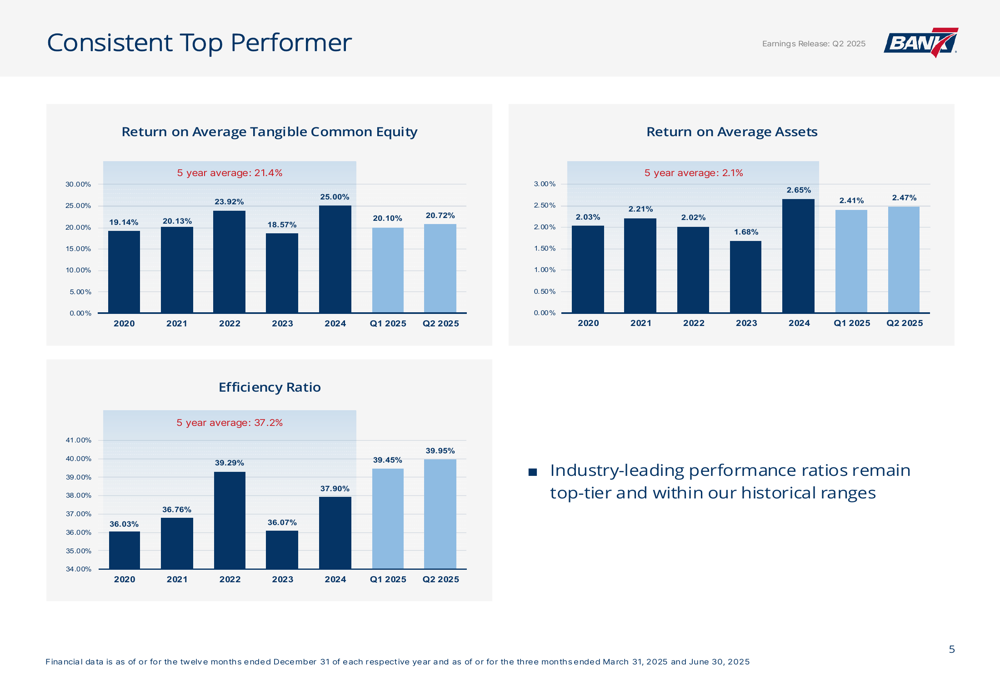
This superior performance has translated into exceptional returns for shareholders. Since its IPO in September 2018, Bank7 has delivered a total shareholder return of 163.6%, compared to the public banks median of just 18.6%. Over a five-year period, the bank’s total shareholder return reached 339.3%, far outpacing the median for major exchange-traded banks at 79.3%.
The bank’s consistent top-tier performance is further illustrated in its return metrics over time:
Balance Sheet Strength & Liquidity
Bank7 maintains a fortress balance sheet with capital ratios significantly exceeding regulatory requirements. As of Q2 2025, the bank reported a Common Equity Tier 1 (CET1) ratio of 13.89% and a Tier 1 Leverage ratio of 12.49%, providing substantial shock-absorption capacity.
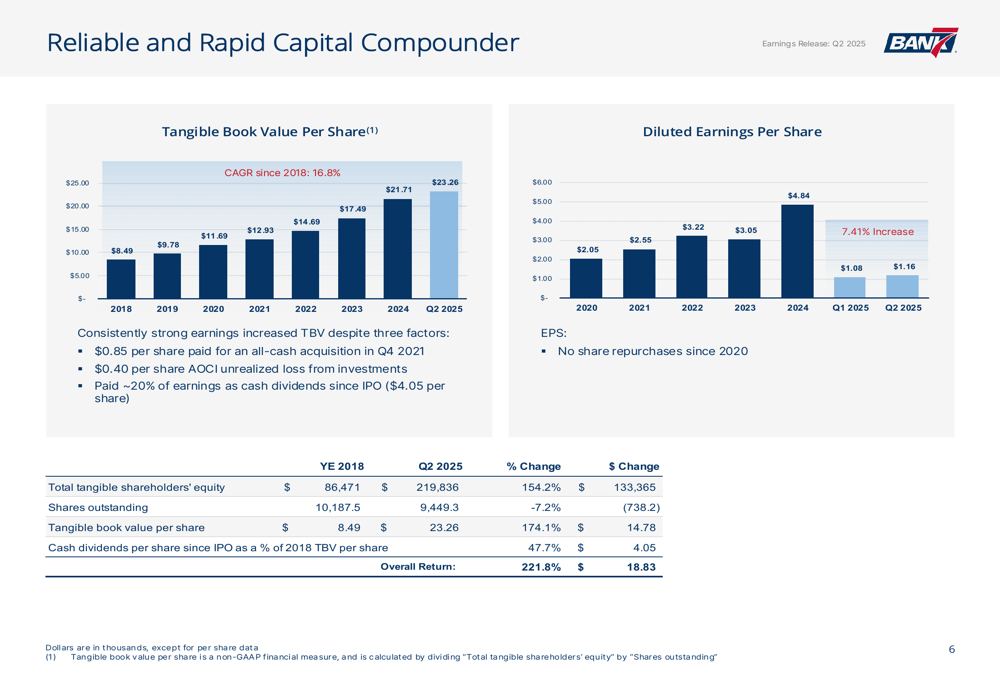
The bank’s tangible book value per share has grown impressively to $23.26 in Q2 2025, representing a compound annual growth rate of 16.8% since 2018. This growth has occurred despite paying approximately 20% of earnings as cash dividends since the IPO.
The following chart illustrates Bank7’s consistent tangible book value growth:
Liquidity remains strong, with $757.14 million in cash, unpledged securities, and undrawn credit lines providing 2.62x coverage of adjusted uninsured deposits. Uninsured deposits total $380.32 million (23.86% of total deposits), but when adjusted for insider and collateralized deposits, this figure drops to $289.09 million (18.13% of total).
The bank’s deposit composition remains diversified, with noninterest-bearing deposits comprising 20.3% of the total, while interest-bearing deposits make up 79.7%. Total deposits grew to $1.59 billion, a 2.8% increase from the previous quarter.
Strategic Positioning & Outlook
Bank7 is well-positioned for a declining rate environment with 75% of its loan portfolio in variable-rate instruments. This positioning should help maintain the bank’s historically strong net interest margin through various rate cycles.
The bank’s loan portfolio remains diversified across multiple sectors, with commercial and industrial loans comprising 24.4% of total loans, hospitality at 18.6%, and energy at 11.2%. This diversification helps mitigate sector-specific risks while allowing the bank to leverage its expertise in key areas.
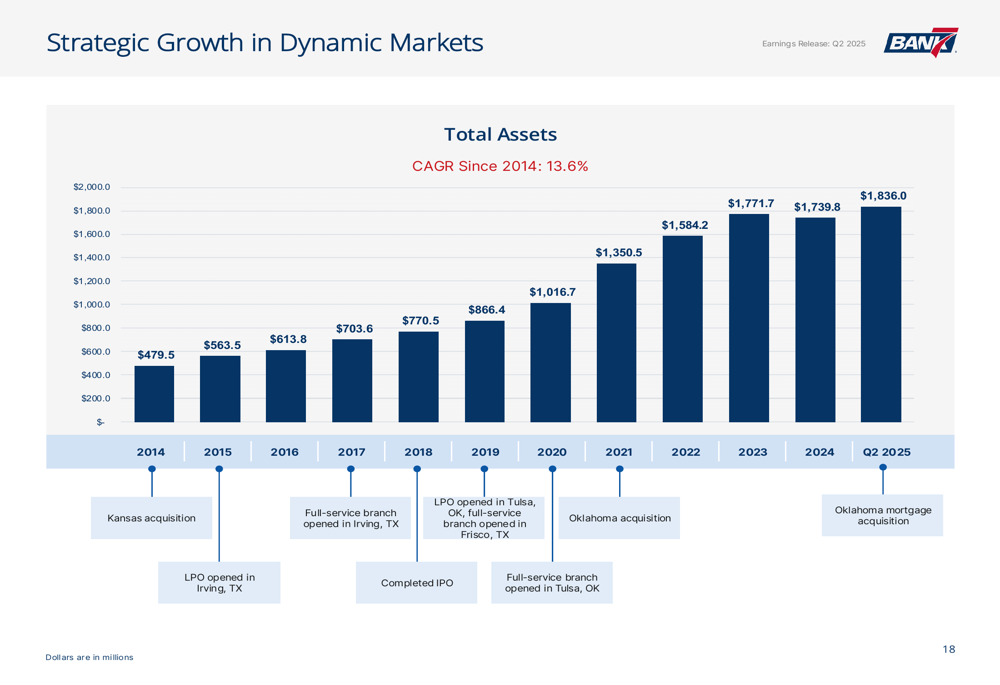
Bank7’s strategic growth in dynamic markets is illustrated in the following chart, showing consistent asset growth with a compound annual growth rate of 13.6% since 2014:
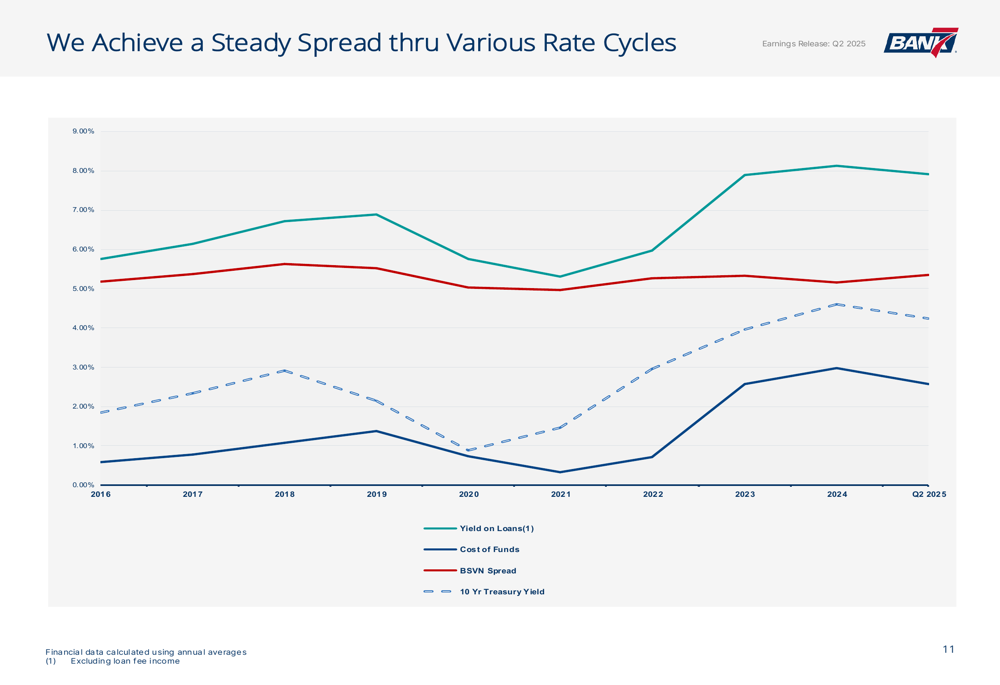
The bank maintains a consistent net interest margin despite rate fluctuations, with a real-time net interest margin (excluding loan fee income) of 4.66% at quarter-end. This stability is achieved through disciplined loan pricing and balance sheet management.
As shown in the following chart, Bank7 has maintained a steady spread through various rate cycles:
With its strong capital position, diversified loan portfolio, and industry-leading performance metrics, Bank7 appears well-positioned to continue its growth trajectory and outperformance relative to peers. The bank’s 56% insider ownership further aligns management interests with shareholders, supporting the continued focus on long-term value creation.
Full presentation:
This article was generated with the support of AI and reviewed by an editor. For more information see our T&C.