Incannex Healthcare stock tumbles after filing $100M offering

Benchmark Electronics Inc (NYSE:BHE) presented its first quarter 2025 financial results on April 29, revealing a sequential revenue decline but continued strength in gross margins and cash flow generation. The electronic manufacturing services provider reported $632 million in revenue and non-GAAP earnings per share of $0.52, down from $0.61 in the previous quarter.
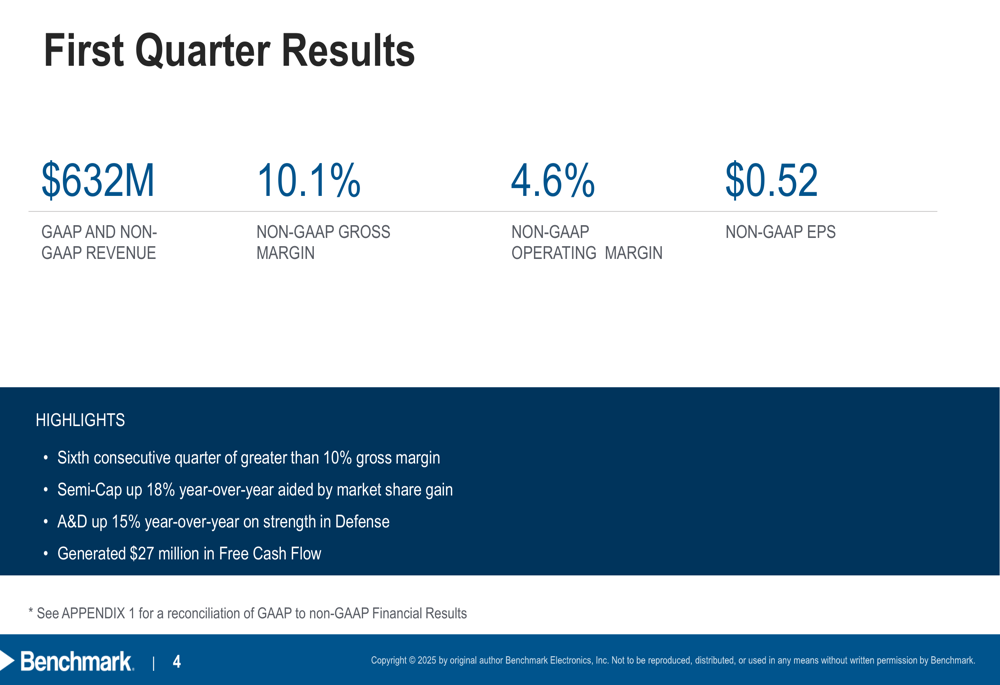
Quarterly Performance Highlights
Benchmark reported $632 million in both GAAP and non-GAAP revenue for Q1 2025, representing a decrease from $657 million in Q4 2024. Despite the revenue decline, the company maintained a non-GAAP gross margin of 10.1%, marking the sixth consecutive quarter above 10%. Non-GAAP operating margin came in at 4.6%, with earnings per share at $0.52.
As shown in the following quarterly results summary:
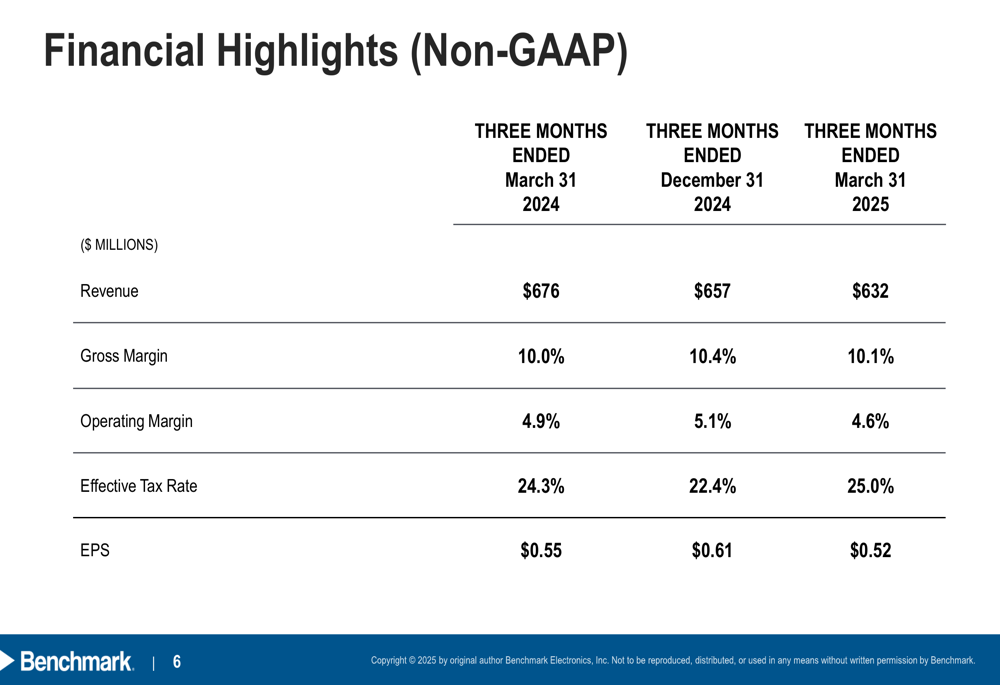
The company’s financial performance showed some sequential softening compared to the previous quarter. Non-GAAP gross margin decreased slightly from 10.4% to 10.1%, while operating margin declined from 5.1% to 4.6%. The effective tax rate increased to 25.0% from 22.4% in the previous quarter.
The following table illustrates the quarter-over-quarter comparison:
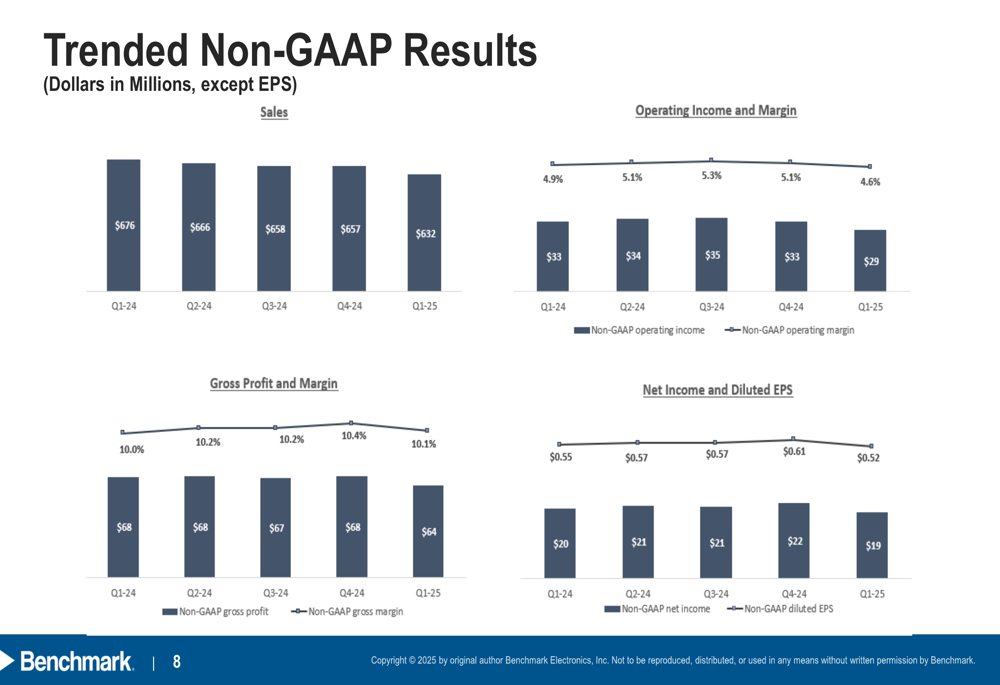
Looking at longer-term trends, Benchmark has maintained relatively stable gross margins despite fluctuations in revenue over the past five quarters. The company’s non-GAAP gross profit has remained in the $64-68 million range, while diluted EPS has fluctuated between $0.52 and $0.61.
Sector Performance Analysis
Benchmark’s revenue breakdown reveals a diversified portfolio across five key sectors, with Medical (TASE:BLWV) representing the largest segment at 32% of total revenue. The company experienced mixed performance across sectors, with Aerospace & Defense showing 4% sequential growth while Medical and Advanced Computing & Communications both declined by 12% quarter-over-quarter.
The following chart illustrates the sector breakdown and performance:
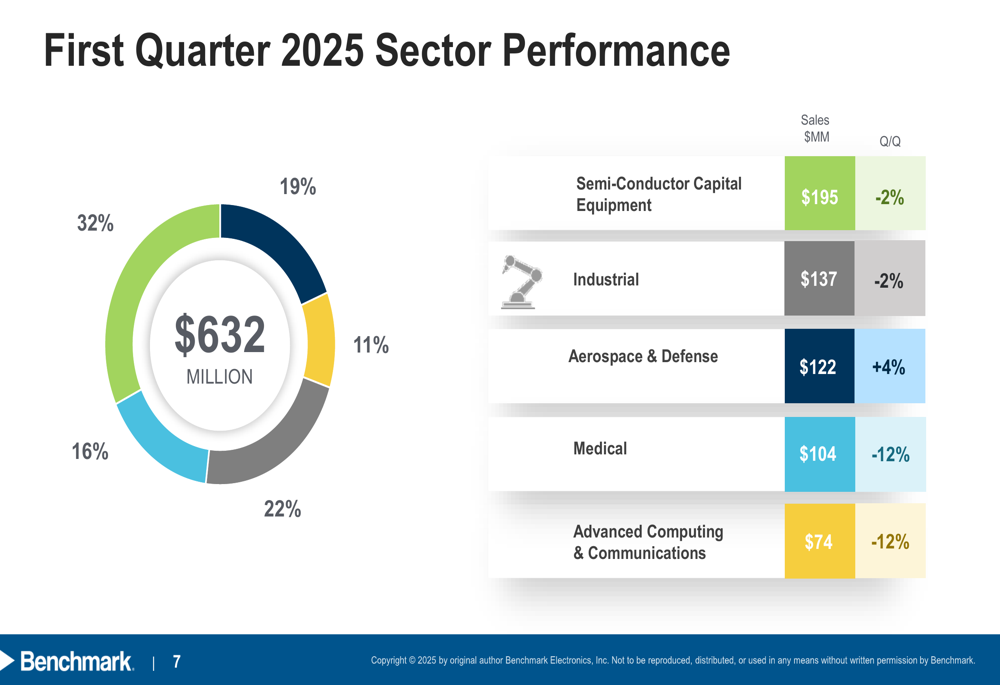
Year-over-year comparisons paint a more positive picture for certain segments. Semi-Cap showed 18% growth compared to Q1 2024, aided by market share gains in next-generation platforms. Similarly, Aerospace & Defense grew 15% year-over-year, driven by strength in the defense subsector.
The company provided a detailed sector outlook, highlighting strong bookings momentum in Industrial, anticipated gradual recovery in Medical as new programs ramp, and continued strength in Defense. The Advanced Computing & Communications sector faces challenges due to high-performance computing platform transitions, though a new 5G Communications program is expected to ramp in the second half of 2025.
Cash Flow and Balance Sheet Strength
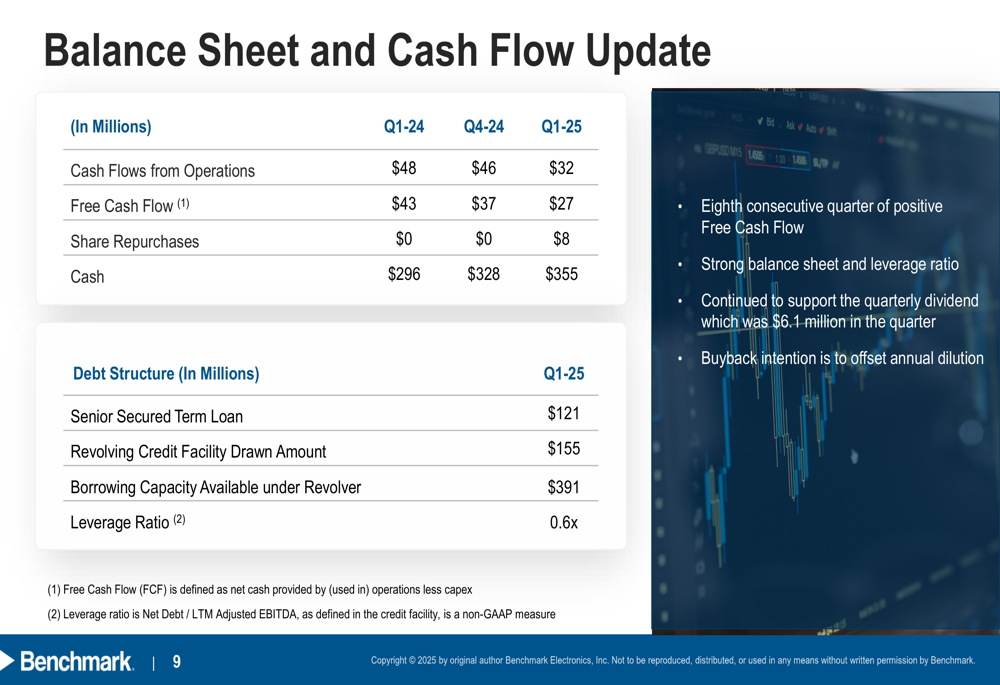
Benchmark demonstrated continued financial discipline with $27 million in free cash flow generation during Q1 2025, marking the eighth consecutive quarter of positive free cash flow. The company has generated over $140 million in free cash flow over the trailing twelve months.
The balance sheet remains strong with $355 million in cash, up from $328 million in Q4 2024 and $296 million in Q1 2024. The company maintains a conservative leverage ratio of 0.6x and has $391 million in available borrowing capacity.
The following slide details the company’s balance sheet and cash flow metrics:
Working capital efficiency continues to improve, with the cash conversion cycle decreasing to 86 days in Q1 2025 from 89 days in Q4 2024 and 94 days in Q1 2024. This improvement was primarily driven by an increase in accounts payable days from 54 to 61.
Forward Guidance and Outlook
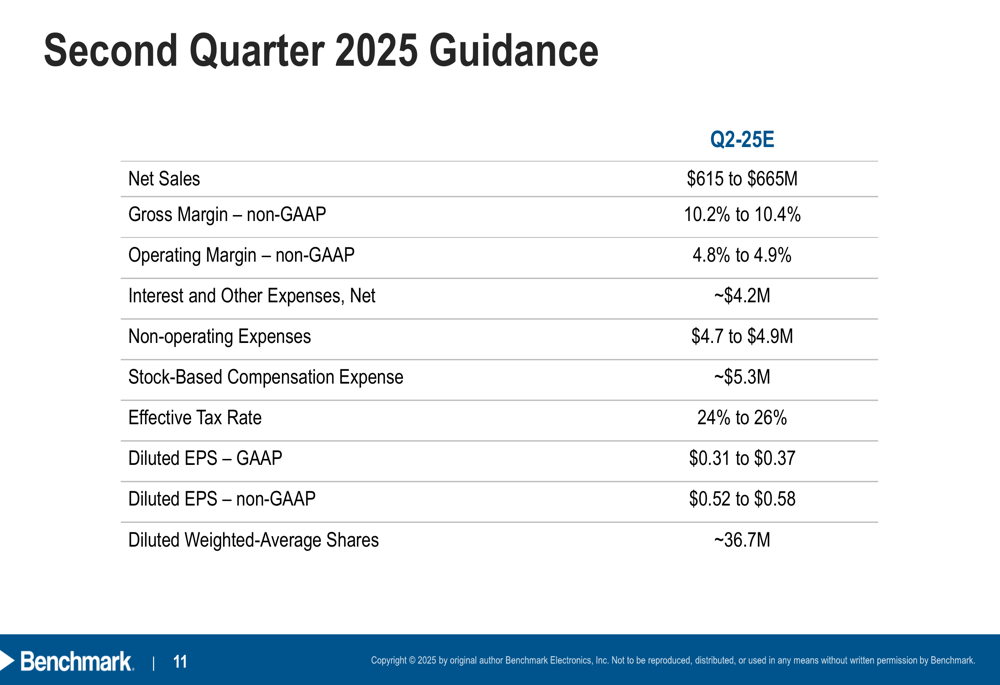
For the second quarter of 2025, Benchmark provided guidance that suggests relative stability in its business. The company expects revenue between $615 million and $665 million, with non-GAAP gross margin improving slightly to 10.2-10.4% and non-GAAP operating margin at 4.8-4.9%. Non-GAAP earnings per share are projected at $0.52-$0.58.
The detailed Q2 2025 guidance is presented below:
Management highlighted several strategic priorities moving forward, including managing demand volatility from tariffs while protecting profitability, driving free cash flow, and returning capital to investors through dividends and share repurchases. The company repurchased $8 million in shares during Q1 2025 and continues to support its quarterly dividend of $6.1 million.
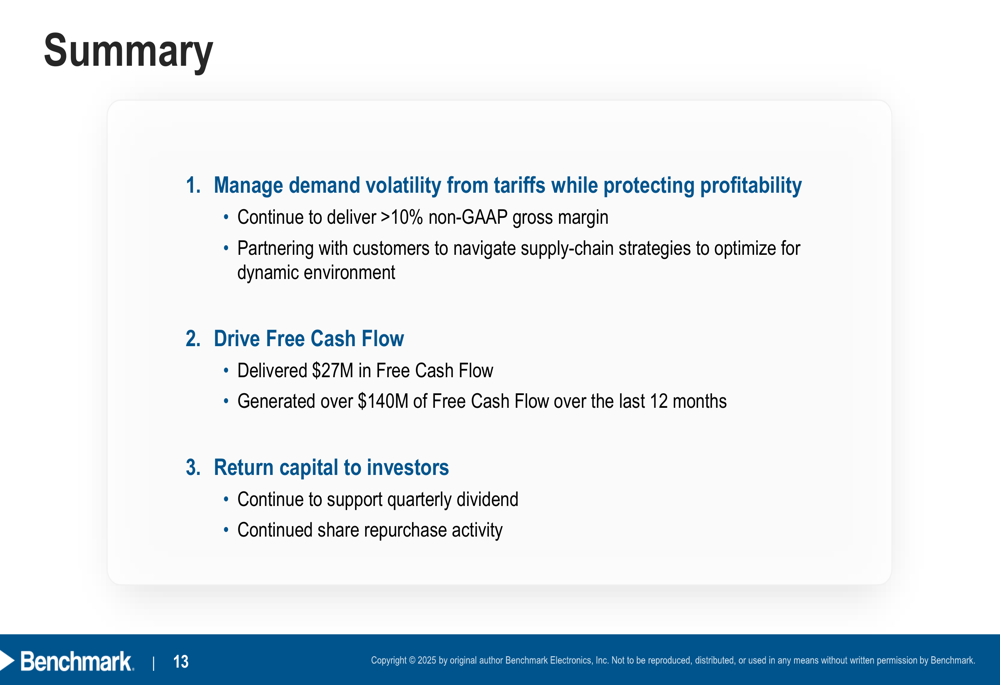
Benchmark’s manufacturing footprint positions it well to navigate the dynamic tariff environment, with 36% of its manufacturing base in the U.S. and over 55% in the Americas. The company is working with customers to optimize supply chain strategies while maintaining its flexible global approach.
In the aftermarket session following the presentation, Benchmark’s stock showed minimal movement, trading at $38.27, up just 0.08% from its regular session close of $38.11. The stock remains well below its 52-week high of $52.57 but significantly above its 52-week low of $29.52.
Full presentation:
This article was generated with the support of AI and reviewed by an editor. For more information see our T&C.