Beamr video compression achieves up to 50% improvement for AVs

Introduction & Market Context
BJ’s Wholesale Club (NYSE:BJ) reported solid second-quarter fiscal 2025 results, highlighted by strong bottom-line performance and continued membership growth. According to the company’s investor presentation released on August 22, 2025, BJ’s delivered $5.3 billion in net sales, representing a 3.2% increase compared to the same period last year.
Despite the positive results, BJ’s stock traded down 1.39% in premarket trading to $104.68, suggesting investors may have had higher expectations or are responding to broader market conditions. The stock has performed well overall, trading near its 52-week high of $121.10, well above its 52-week low of $76.33.
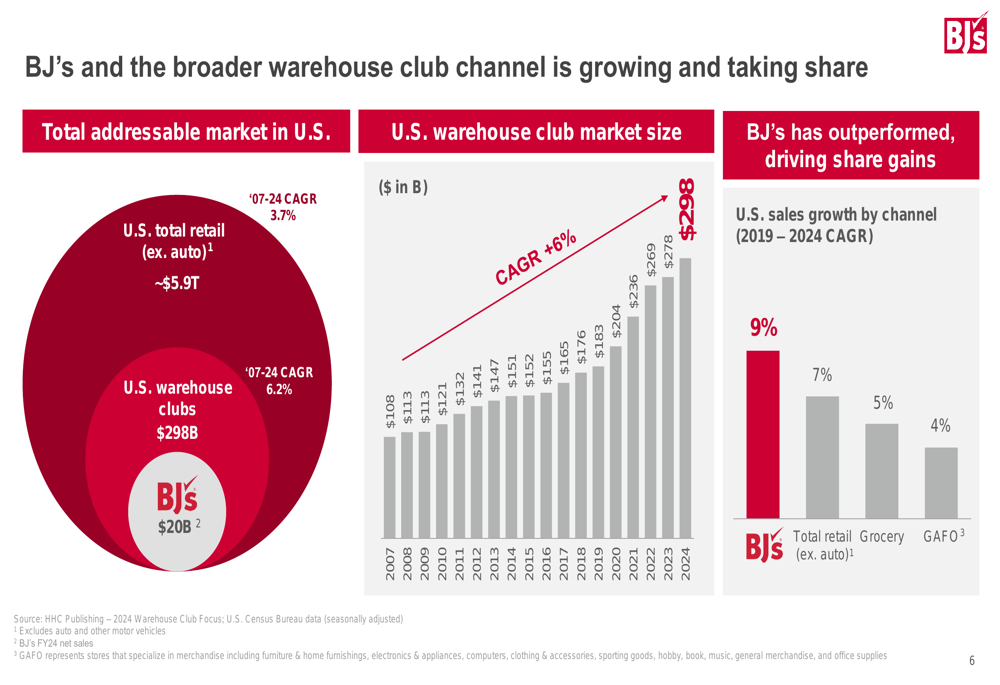
BJ’s continues to gain market share in the warehouse club sector, which has grown at a 6.2% CAGR from 2007-2024, significantly outpacing the broader retail market’s 3.7% growth during the same period. The company now represents approximately $20 billion of the $298 billion U.S. warehouse club market.
As shown in the following chart of BJ’s market position and growth trajectory:
Quarterly Performance Highlights
BJ’s Q2 FY25 results demonstrated solid growth across key metrics. Comparable club sales increased by 2.3% year-over-year, excluding the impact of gasoline. The company’s merchandise gross margin rate improved by 10 basis points compared to Q2 FY24, while adjusted EBITDA grew 8.0% to $303.9 million.
Adjusted earnings per share reached $1.14, representing a 4.6% increase from the prior year, while adjusted free cash flow totaled $87.3 million for the quarter. The company maintained its strong balance sheet with a net debt to LTM adjusted EBITDA ratio of just 0.4x.
The following slide highlights BJ’s Q2 FY25 performance across key metrics:
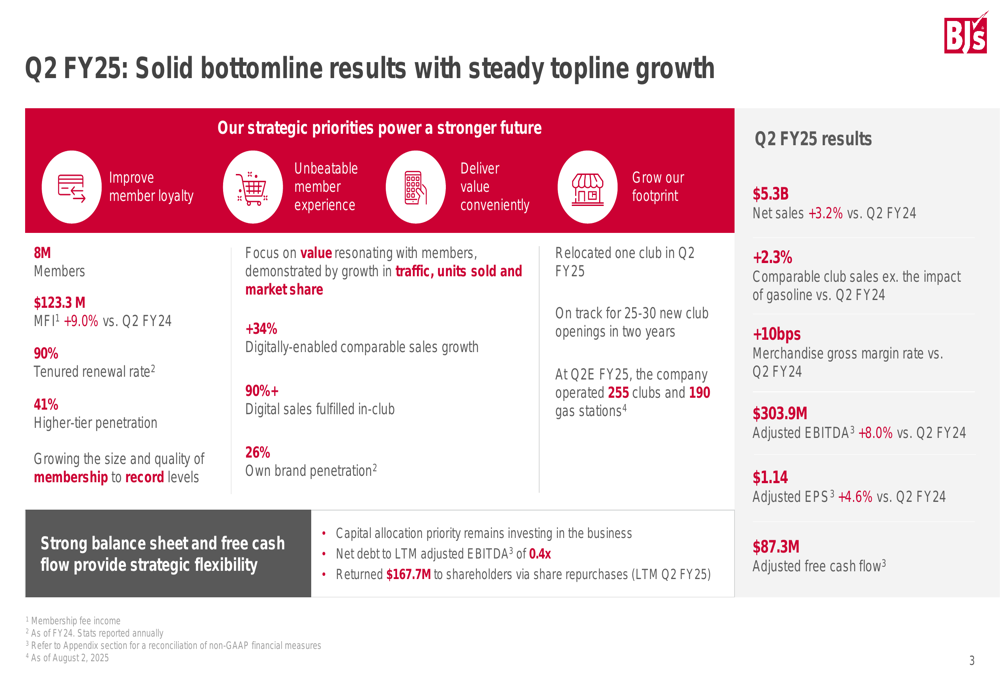
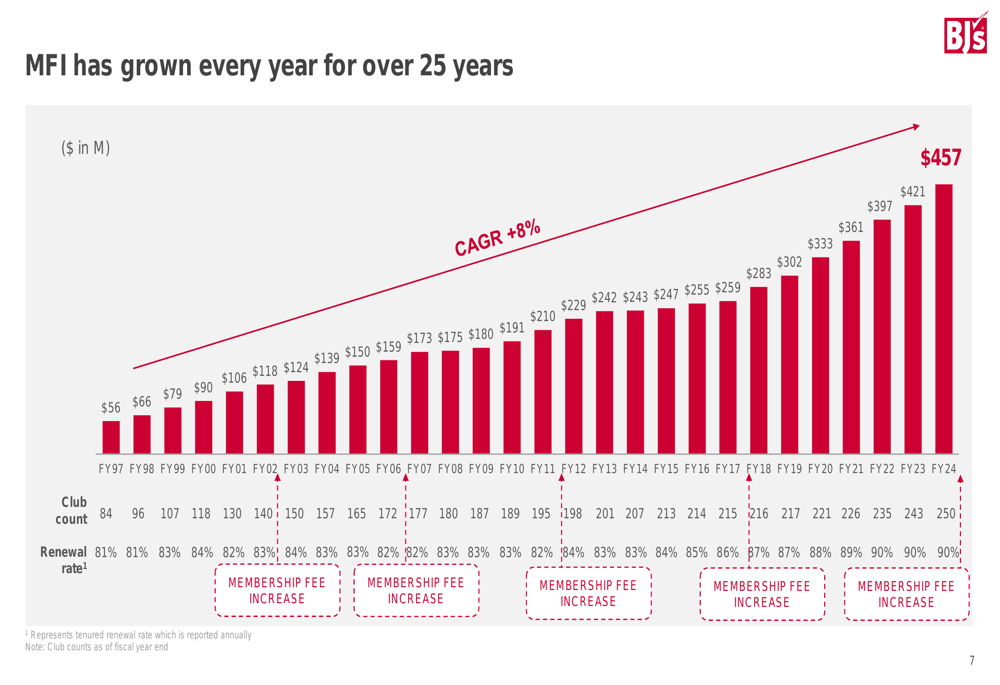
Membership metrics were particularly strong, with membership fee income (MFI) increasing 9.0% year-over-year to $123.3 million. The company now serves approximately 8 million members and maintains an impressive 90% tenured renewal rate, demonstrating high customer loyalty. Additionally, 41% of members have opted for higher-tier memberships, which typically generate greater revenue for the company.
BJ’s membership fee income has shown remarkable consistency, growing every year for over 25 years, as illustrated in this historical chart:
Strategic Initiatives
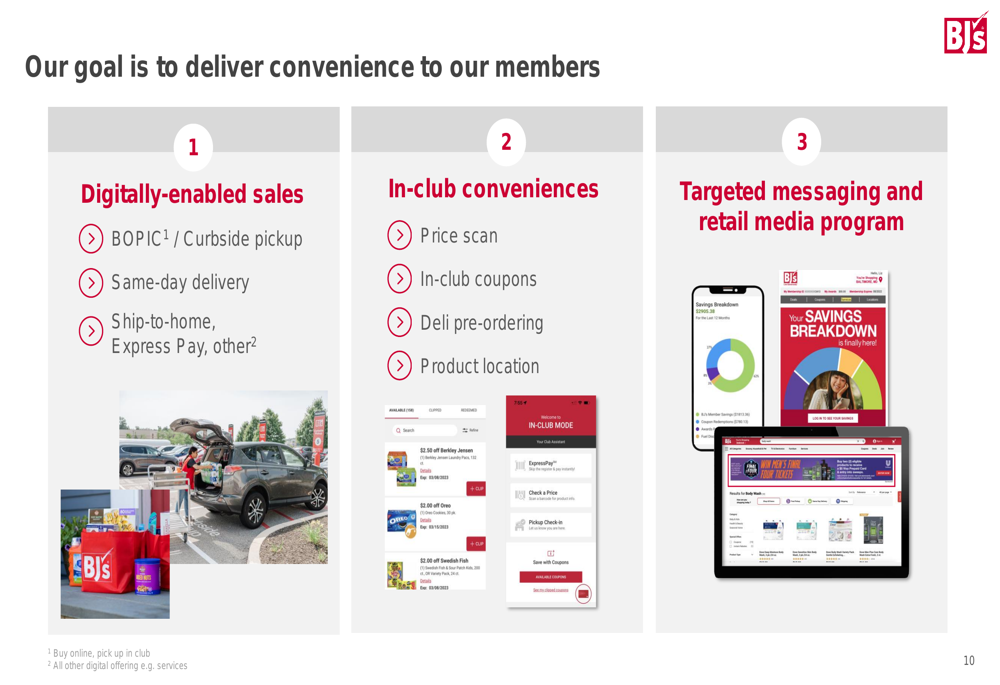
Digital transformation remains a key focus for BJ’s, with digitally-enabled comparable sales growing 34% in Q2 FY25. Notably, 90% of digital sales were fulfilled in-club, leveraging BJ’s physical footprint while meeting evolving consumer preferences for convenience.
The company’s presentation emphasized that digitally engaged members are approximately twice as valuable as non-digital members, driving greater trips, spending, and renewal rates. This explains BJ’s continued investment in digital capabilities, including its mobile app, curbside pickup, same-day delivery, and express pay options.
The following slide illustrates BJ’s approach to delivering convenience through digital channels:
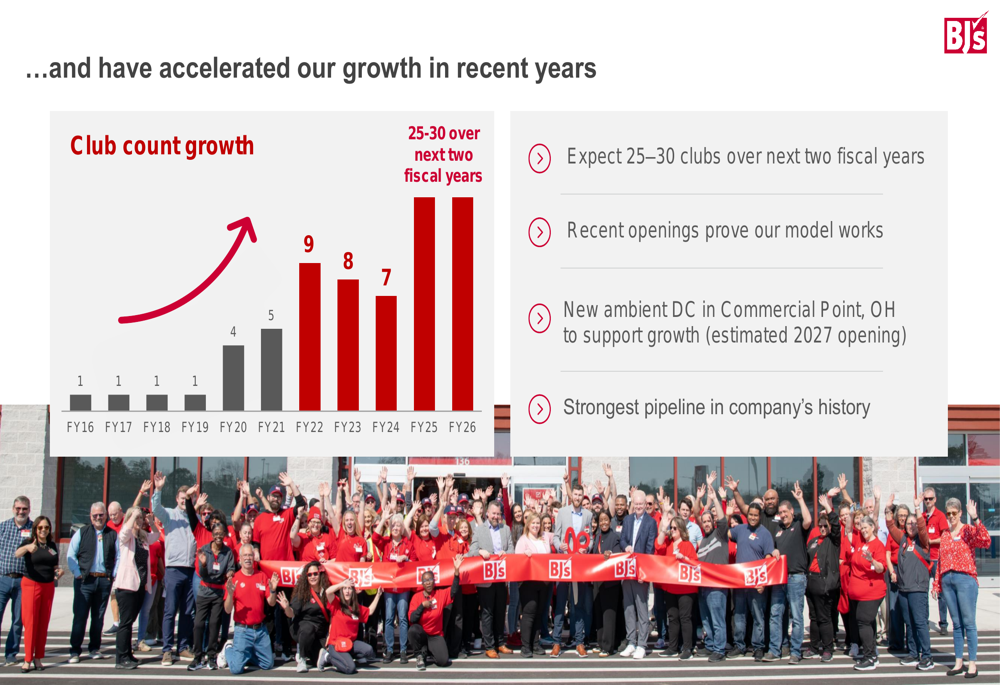
BJ’s is also accelerating its physical expansion, with plans to open 25-30 new clubs over the next two fiscal years. This represents a significant increase from previous years’ growth rates, which ranged from 1-9 new clubs annually between FY16-FY24. The company recently entered its 21st state with a location in Louisville, Kentucky, and plans to open a new ambient distribution center in Commercial Point, Ohio by 2027 to support its growth.
This accelerated expansion strategy is visualized in the following chart:
Competitive Industry Position
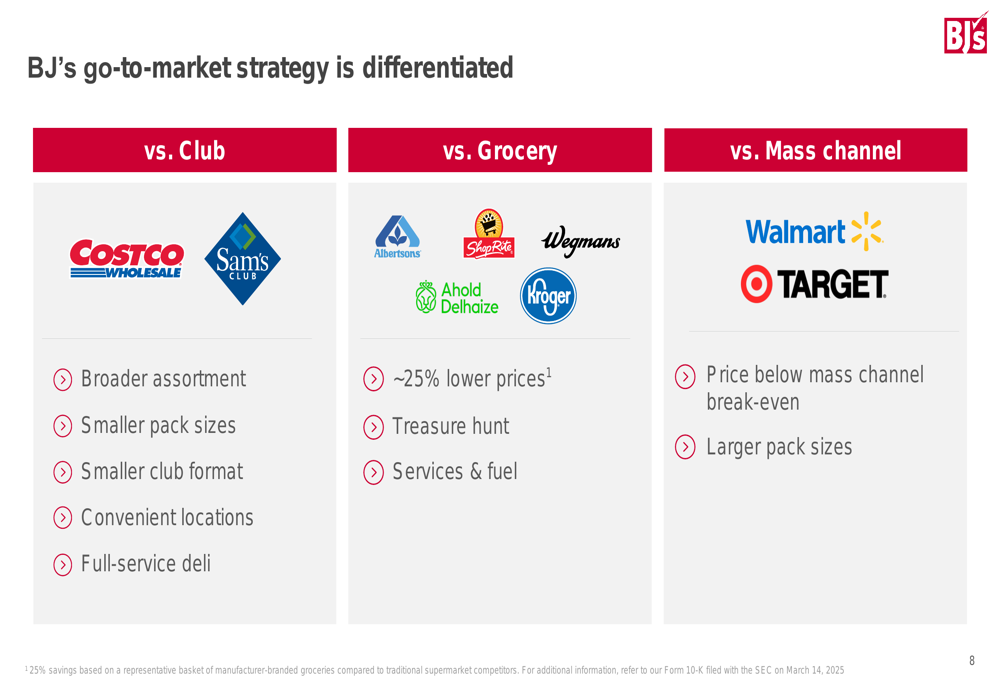
BJ’s has carved out a distinct competitive position in the retail landscape, differentiating itself from other warehouse clubs, traditional grocery chains, and mass retailers. Compared to competitors like Costco (NASDAQ:COST) and Sam’s Club, BJ’s offers a broader assortment, smaller pack sizes, a smaller club format, more convenient locations, and a full-service deli.
Against grocery chains, BJ’s touts approximately 25% lower prices, a "treasure hunt" shopping experience, and additional services including fuel stations. When compared to mass retailers like Walmart (NYSE:WMT) and Target (NYSE:TGT), BJ’s positions its pricing below these competitors’ break-even points while offering larger pack sizes.
The company’s differentiated go-to-market strategy is illustrated in this competitive positioning slide:
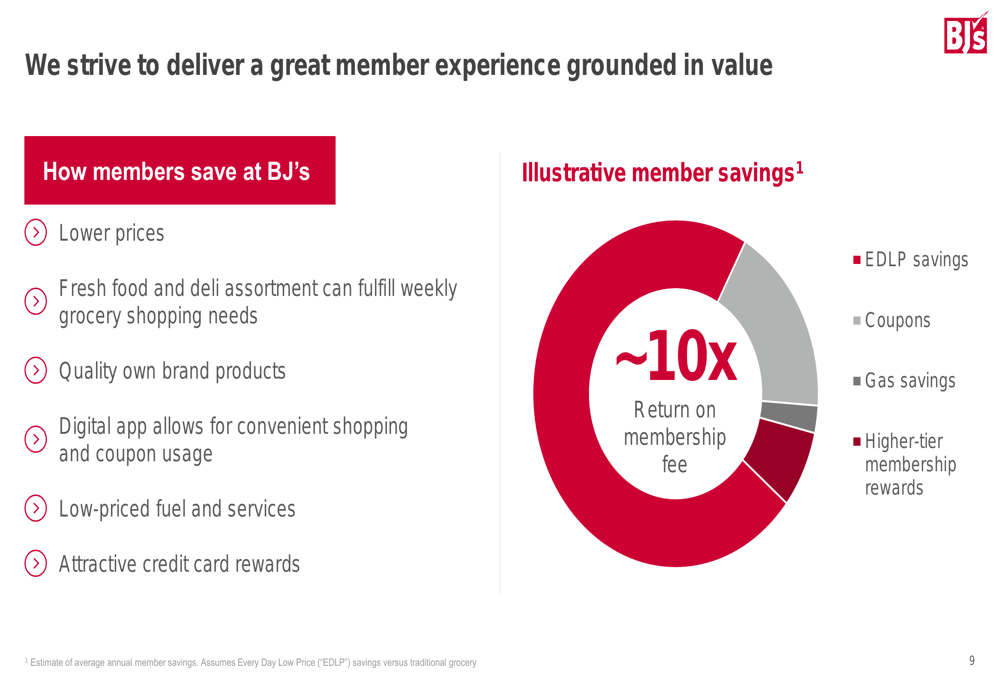
BJ’s value proposition to members remains central to its strategy, with the company emphasizing that members receive approximately 10 times the value of their membership fee through everyday low prices, coupons, gas savings, and higher-tier membership rewards. This value-focused approach has helped BJ’s outperform the broader retail market, growing at a 9% CAGR from 2019-2024, compared to 7% for total retail excluding auto, 5% for grocery, and 4% for GAFO (General merchandise, Apparel, Furniture, and Other).
The following slide highlights the company’s value proposition to members:
Forward-Looking Statements & Capital Allocation
Looking ahead, BJ’s outlined long-term financial targets including low-single-digit to mid-single-digit percentage growth in comparable club sales, mid-single-digit percentage growth in total revenues, and high-single-digit to low-double-digit percentage growth in earnings per share.
The company remains committed to disciplined capital allocation, prioritizing investments in business growth while maintaining a strong balance sheet and returning cash to shareholders. BJ’s recently announced a new $1 billion share repurchase program expiring in January 2029, replacing its previous $500 million program that was fully utilized. Since FY18, the company has repurchased over $816 million in shares.
BJ’s capital allocation strategy is detailed in the following chart:

The company has delivered impressive growth since 2018, with net sales increasing 58%, membership fee income growing 61%, and adjusted EPS surging 205%. During this period, BJ’s generated $2.7 billion in cumulative adjusted free cash flow while reducing its leverage ratio to just 0.5x net debt to adjusted EBITDA.
This performance trajectory positions BJ’s well for continued growth, despite the competitive retail environment and potential economic headwinds. With its differentiated business model, expanding footprint, growing digital capabilities, and loyal membership base, BJ’s appears well-equipped to execute on its long-term strategic objectives.
Full presentation:
This article was generated with the support of AI and reviewed by an editor. For more information see our T&C.