US stock futures inch lower after Wall St marks fresh records on tech gains

Introduction & Market Context
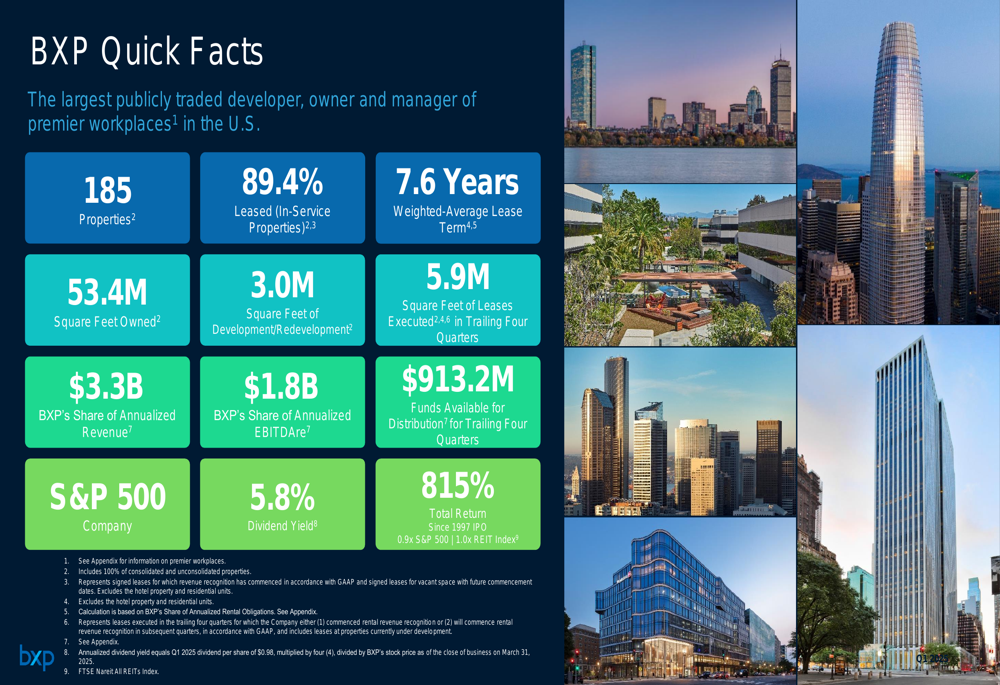
BXP Inc (NYSE:BXP), the largest publicly traded developer, owner, and manager of premier workplaces in the United States, presented its Q1 2025 investor overview highlighting the company’s performance amid evolving office market dynamics. Despite broader market challenges in the office sector, BXP reported stronger-than-expected quarterly results with an EPS of $0.39, beating forecasts by $0.02, and revenue of $865.2 million exceeding expectations.
The company’s presentation emphasized how its focus on premier workplace assets has allowed it to outperform the broader office market, particularly as companies increasingly implement more stringent in-office work requirements. BXP’s stock closed at $63.54 on May 9, 2025, up 1.05% for the day, though it had experienced a 3.51% decline following its earnings release on April 30.
As shown in the following snapshot of BXP’s key metrics and positioning in the market:
Quarterly Performance Highlights
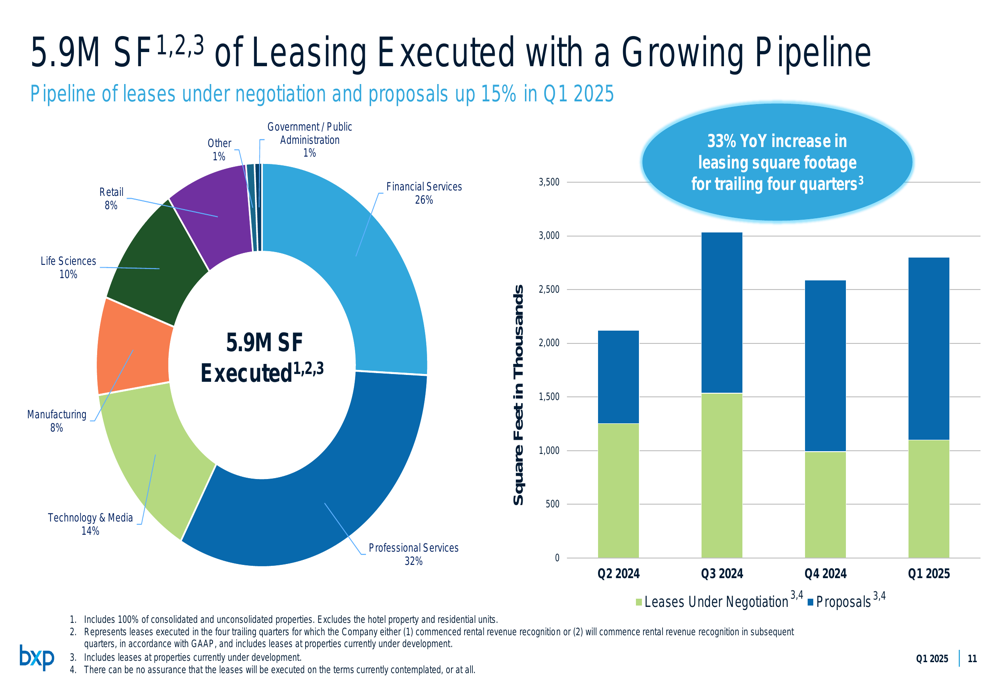
BXP demonstrated strong leasing momentum in Q1 2025, signing 1.1 million square feet of leases, representing approximately 140% of its historical 5-year average for the first quarter. This aligns with the 25% year-over-year increase mentioned in the company’s earnings call. The trailing four quarters saw 5.9 million square feet of leasing executed, a 33% increase compared to the previous year.
The company’s pipeline of leases under negotiation and proposals increased by 15% in Q1 2025, suggesting continued leasing momentum. Industry diversification remains a key strength, with leasing activity spread across multiple sectors including professional services (32%), financial services (26%), and technology & media (14%).
The following chart illustrates BXP’s leasing activity by industry sector and the growing pipeline of potential leases:
BXP’s portfolio performance continues to benefit from its strategic focus on central business district (CBD) locations, which represent approximately 88% of annualized rental obligations. The CBD portfolio maintains a strong leased percentage of 92.7%, significantly outperforming suburban locations.
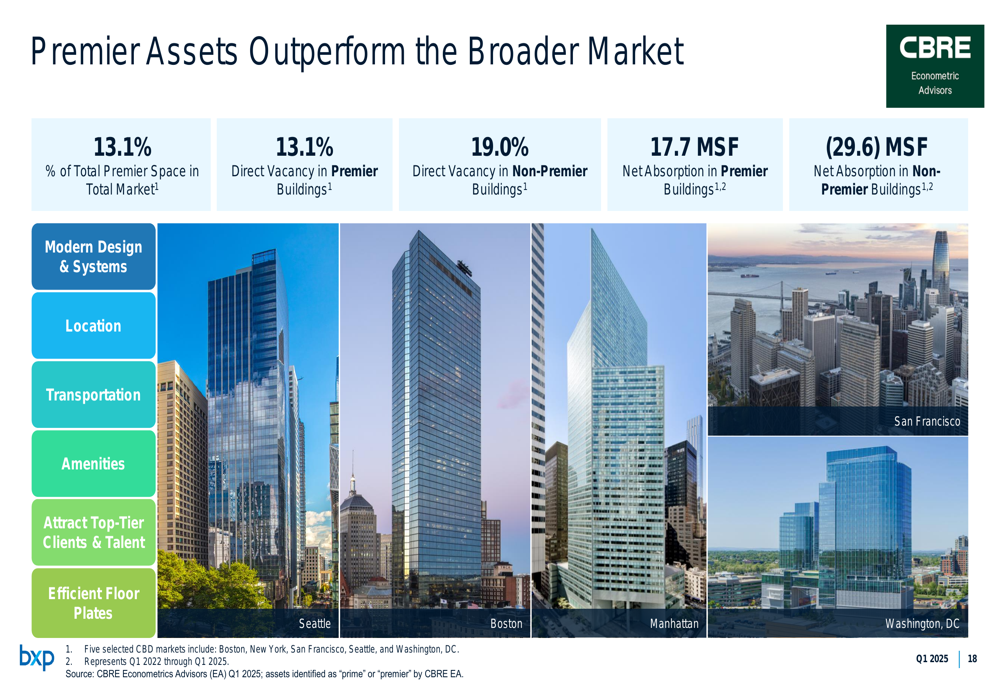
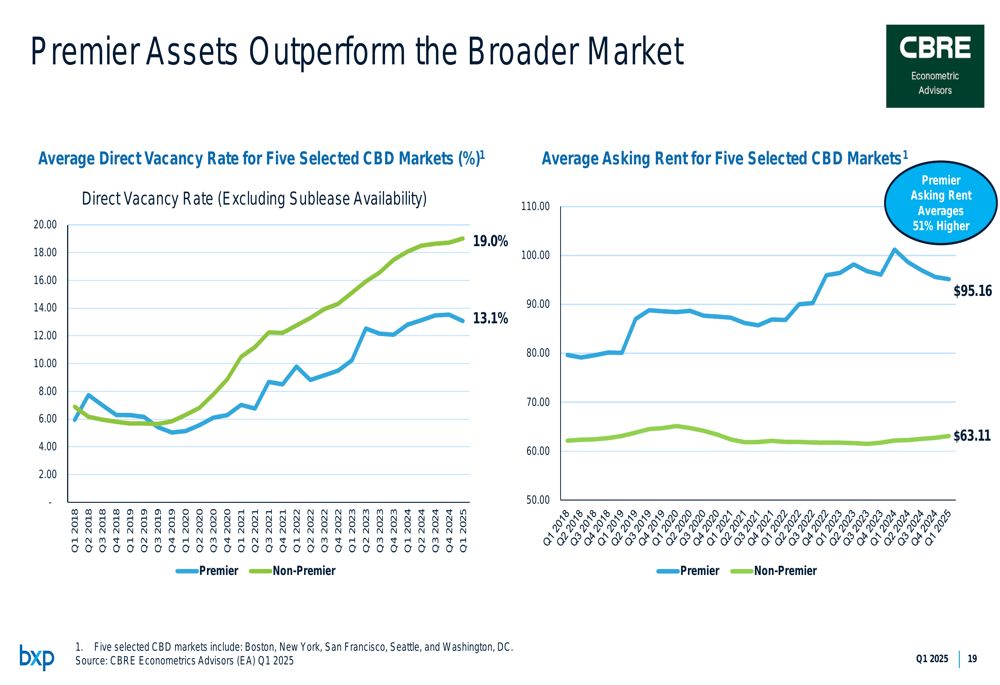
The company highlighted how premier assets are outperforming the broader market, with direct vacancy rates of 13.1% for premier buildings versus 19.0% for non-premier buildings, according to CBRE (NYSE:CBRE) Econometric Advisors:
This performance gap is further illustrated in the following charts showing both vacancy rates and asking rents for premier versus non-premier properties:
Strategic Initiatives
BXP’s strategy centers on consistent portfolio refreshment and development-driven growth. From 2010 through Q1 2025, the company has executed $8.2 billion in dispositions (14.2 million square feet), $7.6 billion in acquisitions (16.2 million square feet), and $10.0 billion in development deliveries (17.5 million square feet).
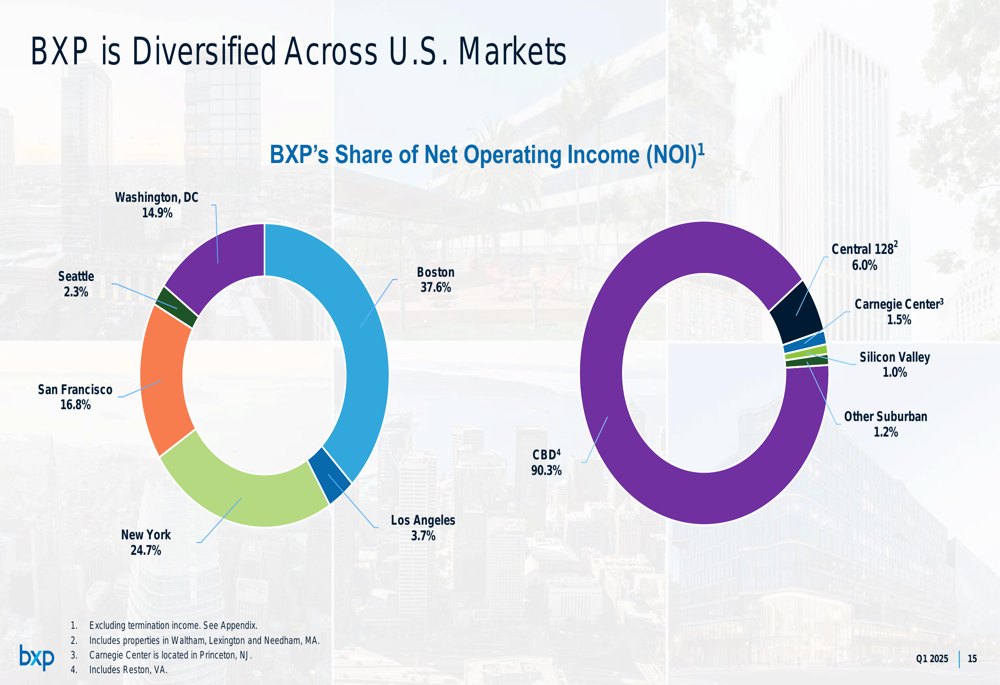
The company maintains a diverse geographic footprint across six major U.S. markets, with Boston representing 37.6% of NOI, followed by New York (24.7%), San Francisco (16.8%), Washington, DC (14.9%), Los Angeles (3.7%), and Seattle (2.3%). This diversification helps mitigate market-specific risks while maintaining focus on premier CBD locations.
The following chart illustrates BXP’s market diversification:
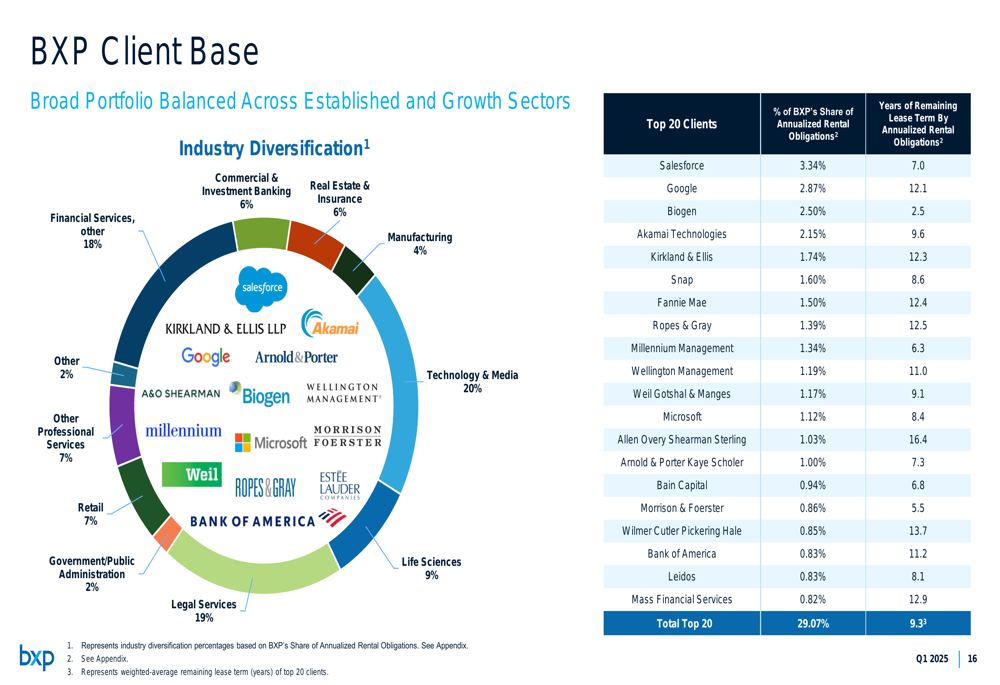
BXP’s client base is similarly diversified across established and growth sectors, with technology & media (20%), legal services (19%), and financial services (18%) representing the largest industry concentrations. The top 20 clients account for a significant portion of rental obligations, with companies like Salesforce (NYSE:CRM), Google (NASDAQ:GOOGL), and Biogen (NASDAQ:BIIB) among the largest tenants.
The following breakdown shows BXP’s client diversification by industry:
Development Pipeline and Growth Opportunities
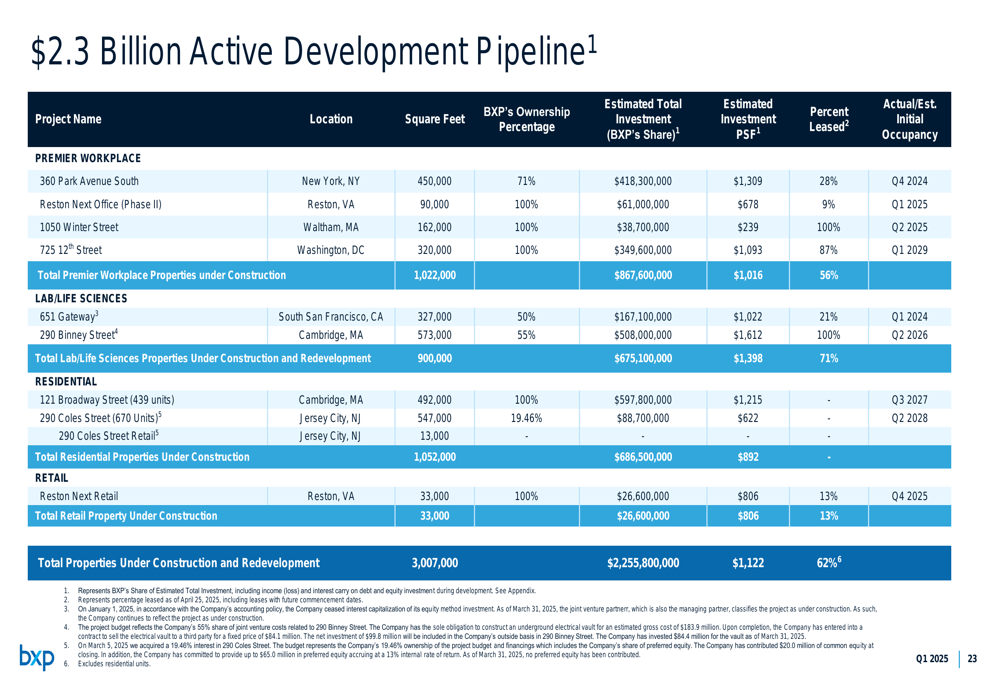
BXP maintains a robust $2.3 billion active development pipeline spanning 3.0 million square feet, with projects 62% pre-leased overall. The pipeline includes premier workplace developments (56% pre-leased), lab/life sciences developments (71% pre-leased), residential developments, and retail redevelopments.
The company highlighted several key investment opportunities, including a multi-family development at 290 Coles Street in Jersey City and the redevelopment of 725 12th Street in Washington, DC, which is already 87% pre-leased. Additionally, BXP noted its joint venture at 343 Madison Avenue in Manhattan, strategically located atop Grand Central Terminal.
The following table details BXP’s active development pipeline:
Beyond the active pipeline, BXP has identified approximately 19 million square feet of future development opportunities across its markets, providing a long-term growth runway.
Financial Analysis and Outlook
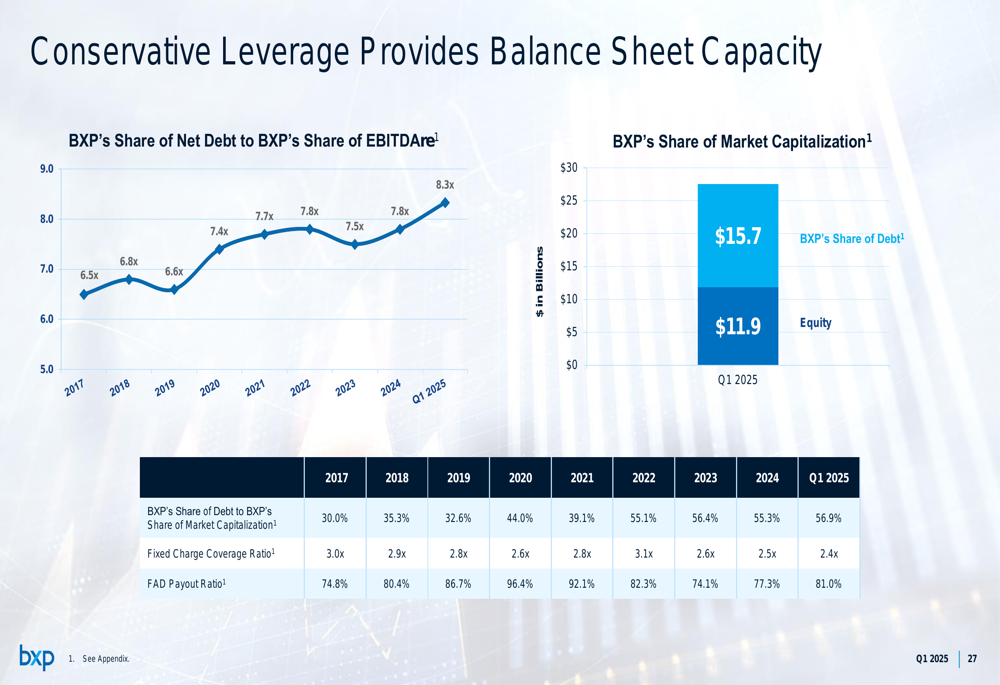
BXP maintains a conservative financial position with $1.9 billion in liquidity ($0.5 billion in cash and $1.4 billion available on its revolving credit facility). The company’s share of debt totals $15.7 billion, with 72.6% unsecured and 27.4% secured.
The company’s leverage metrics remain manageable, with BXP’s share of net debt to EBITDAre at approximately 7.8x and a fixed charge coverage ratio of 2.4x. During the quarter, BXP demonstrated consistent access to capital markets, completing significant financing activities including extending its revolving line of credit to $2.25 billion with maturity in 2030.
The following chart illustrates BXP’s conservative leverage and balance sheet capacity:
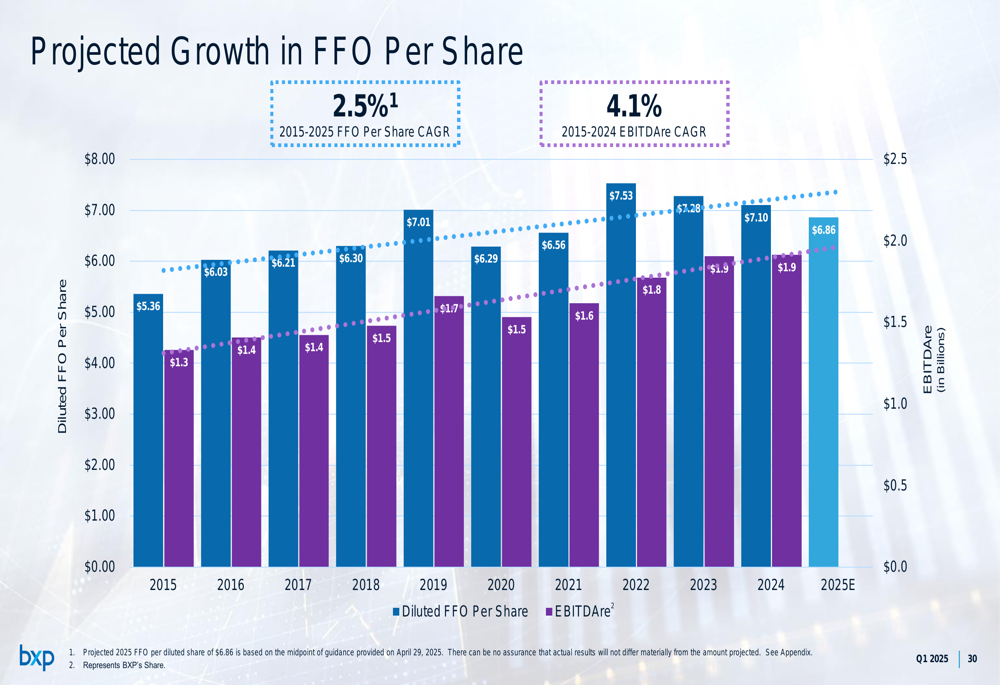
BXP projects continued growth in funds from operations (FFO) per share, with a 2.5% compound annual growth rate (CAGR) from 2015 to 2025. In its earnings call, the company narrowed its 2025 FFO guidance to a range of $6.80 to $6.92 per share.
The following chart shows BXP’s projected growth in FFO per share:
The company maintains a consistent dividend, with a current yield of 5.8%. BXP’s trailing four-quarter funds available for distribution (FAD) ratio of 76% provides strong support for the dividend, which has been paid for 29 consecutive years according to earnings reports.
Forward-Looking Statements
Looking ahead, BXP is positioned to benefit from several tailwinds, including the trend toward more stringent in-office work requirements being implemented by major companies. The company cited examples from JPMorgan, Amazon (NASDAQ:AMZN), Gap Inc (NYSE:GAP)., and others that are mandating increased office attendance.
BXP’s low lease rollover in 2026 (3.9% of portfolio) and 2027 (4.6% of portfolio) provides stability while offering opportunities to improve occupancy. The company is targeting 4 million square feet of leasing in 2025 and expects occupancy growth in 2026-2027.
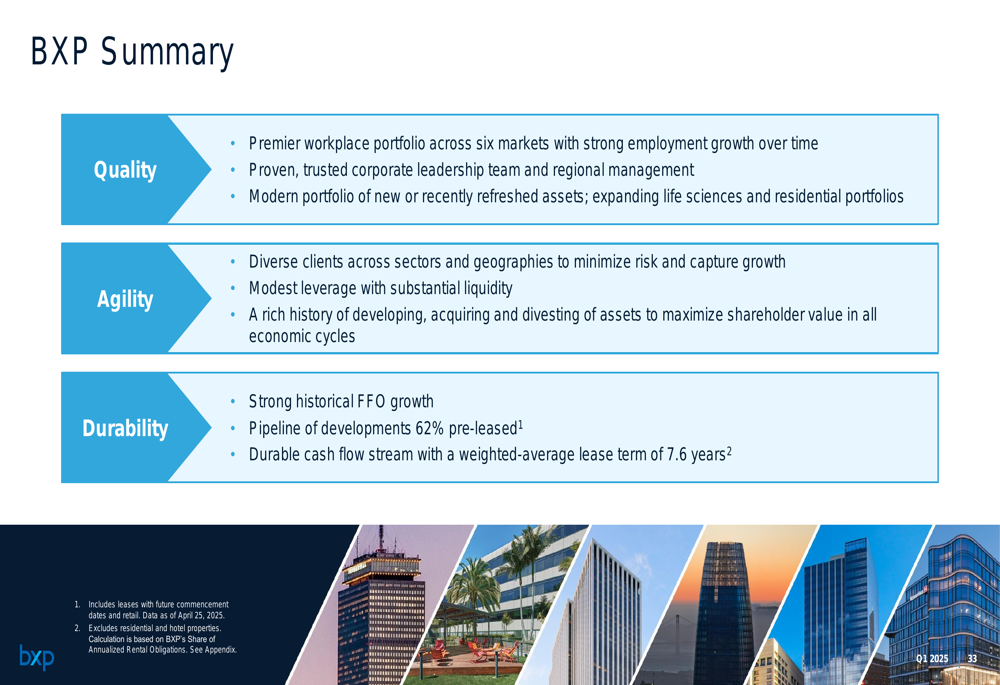
Management summarized BXP’s key strengths under three categories: quality (premier workplace portfolio across six markets), agility (diverse clients across sectors and geographies), and durability (strong historical FFO growth and durable cash flow stream):
Despite these positive indicators, investors should note that BXP’s stock declined following its earnings release, suggesting some market concerns about long-term guidance and broader economic conditions affecting the office sector. The company acknowledges challenges including economic uncertainty impacting leasing demand and potential shifts in the life sciences market.
Full presentation:
This article was generated with the support of AI and reviewed by an editor. For more information see our T&C.