D-Wave Quantum falls nearly 3% as earnings miss overshadows revenue beat

Introduction & Market Context
Caesars Entertainment (NASDAQ:CZR) released its second quarter 2025 investor presentation on July 29, revealing a company in transition with digital operations outperforming traditional casino segments. The stock closed at $29.42, down 3.33% for the day, with aftermarket trading showing further pressure with a 1.16% decline to $29.08.
The presentation highlighted a 2.9% year-over-year increase in net revenues, reaching $2.91 billion, while adjusted EBITDA declined by 4.1% to $955 million. This mixed performance follows a challenging first quarter where the company missed both EPS and revenue forecasts, posting an EPS of -$0.54 against expectations of -$0.17.
Quarterly Performance Highlights
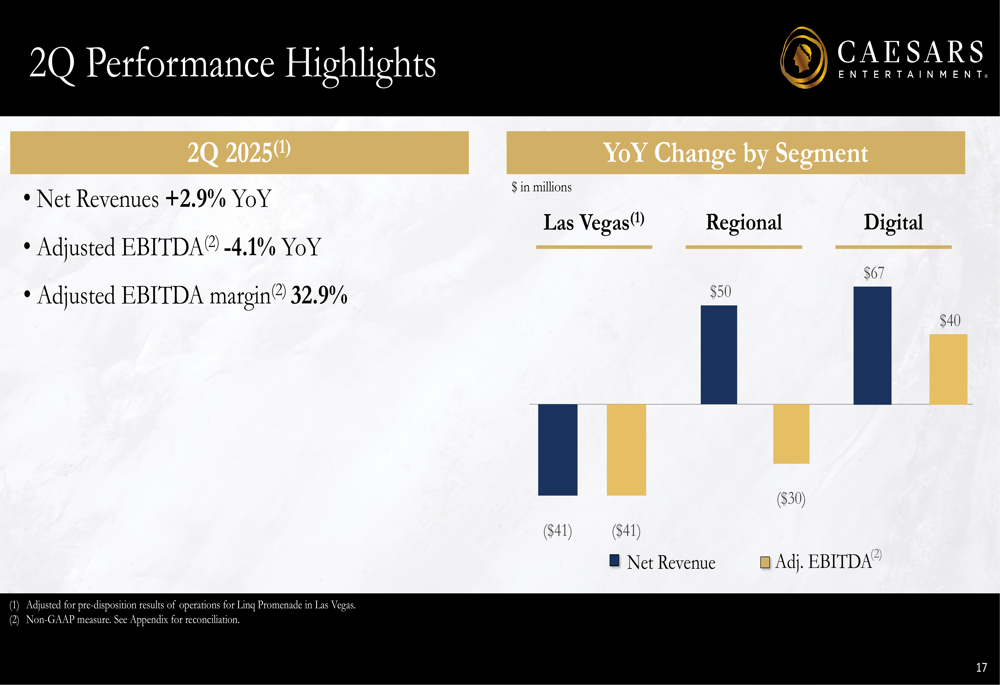
Caesars’ Q2 2025 results revealed divergent performance across its business segments. While overall net revenues increased by 2.9% year-over-year, adjusted EBITDA decreased by 4.1%, resulting in an adjusted EBITDA margin of 32.9%.
The company’s segmental performance shows the varying trajectories of its business units. Las Vegas properties experienced a $41 million year-over-year decline in both net revenue and adjusted EBITDA. Regional properties saw a $50 million increase in net revenue but a $30 million decrease in adjusted EBITDA. The digital segment was the standout performer with a $67 million increase in net revenue and a $40 million improvement in adjusted EBITDA.
As shown in the following chart detailing performance by segment:
Digital Segment Growth
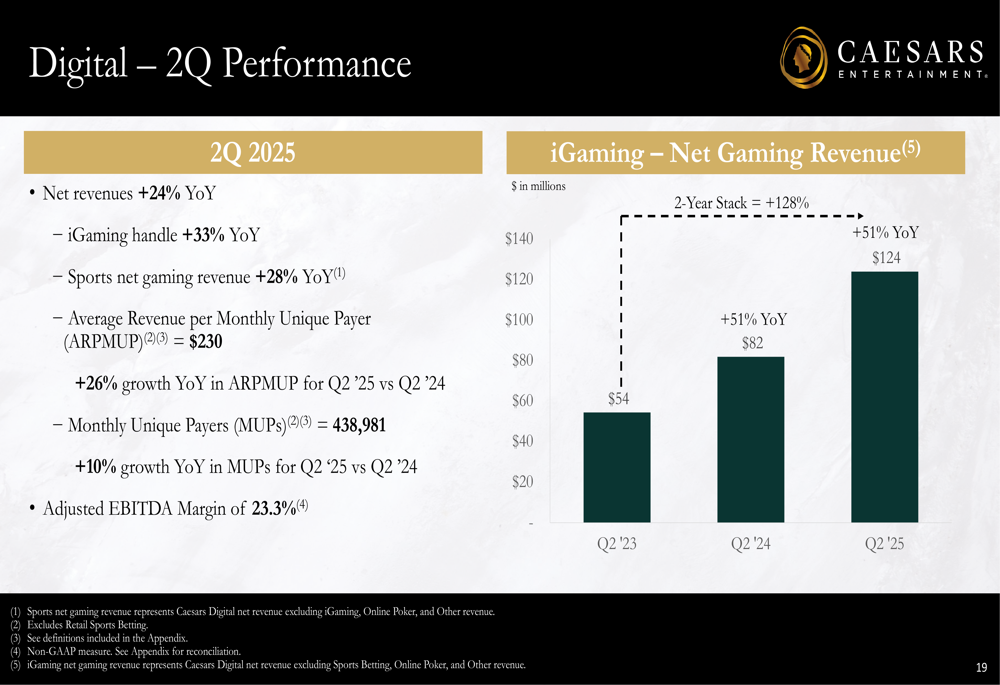
The digital segment emerged as Caesars’ growth engine in Q2 2025, with net revenues increasing by 24% year-over-year to $343 million. This impressive growth was driven by a 33% increase in iGaming handle and a 28% rise in sports net gaming revenue.
The segment’s profitability showed remarkable improvement, with adjusted EBITDA reaching $80 million, compared to just $4 million in Q2 2024. This resulted in an adjusted EBITDA margin of 23.3%, demonstrating the increasing efficiency of Caesars’ digital operations.
Customer engagement metrics were equally strong, with average revenue per monthly unique payer (ARPMUP) increasing by 26% year-over-year to $230, while monthly unique payers (MUPs) grew by 10% to 438,981.
The following chart illustrates the digital segment’s impressive performance:
This growth trajectory is part of a longer-term trend, with the digital segment showing consistent revenue and EBITDA improvements over multiple quarters:
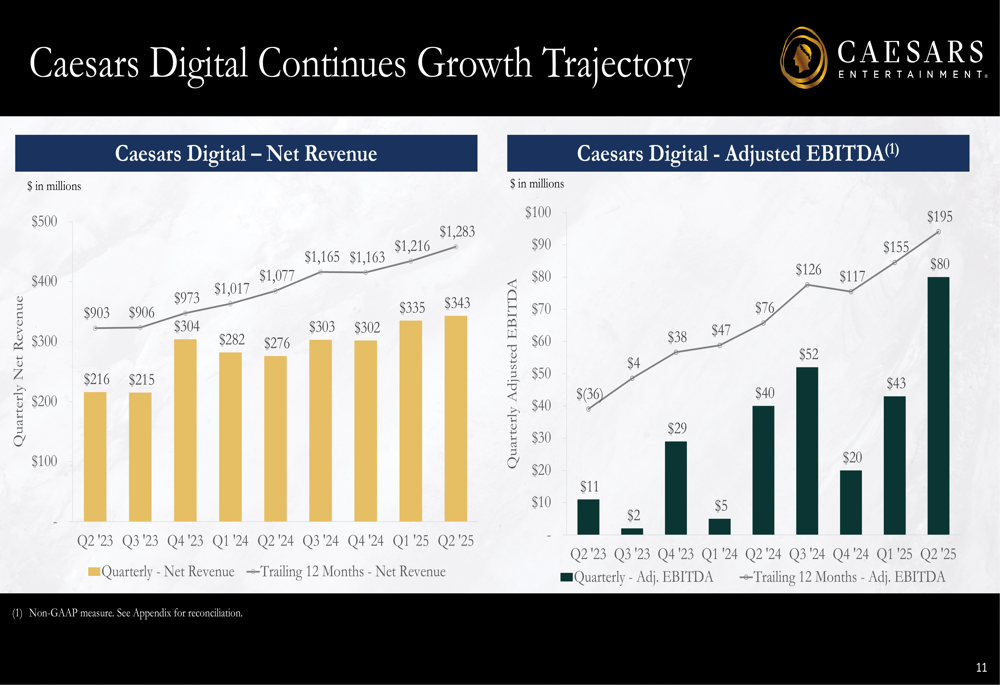
Key drivers behind this digital growth include improving sportsbetting hold rates, which increased from 4.30% in 2021 to 8.00% in Q2 2025 YTD, with a target of 10.0%. Additionally, iGaming handle has grown substantially from $2,504 million in Q2 2021 YTD to $9,193 million in Q2 2025 YTD.
Las Vegas and Regional Operations
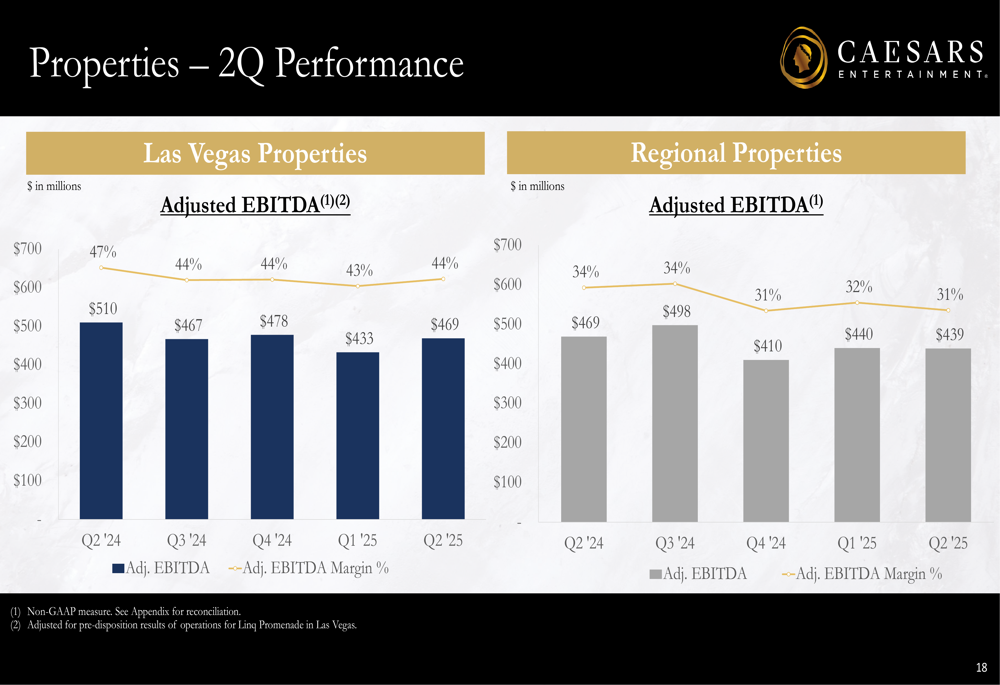
While digital operations thrived, Caesars’ traditional casino segments faced challenges. Las Vegas properties reported Q2 2025 adjusted EBITDA of $469 million with a 44% margin, down from $510 million with a 47% margin in Q2 2024. The presentation highlighted that Las Vegas properties have maintained relatively stable EBITDA margins in the 43-47% range over the past five quarters.
Regional properties showed similar pressure, with Q2 2025 adjusted EBITDA of $439 million and a 31% margin, compared to $469 million and a 34% margin in Q2 2024. The following chart illustrates the performance of both segments:
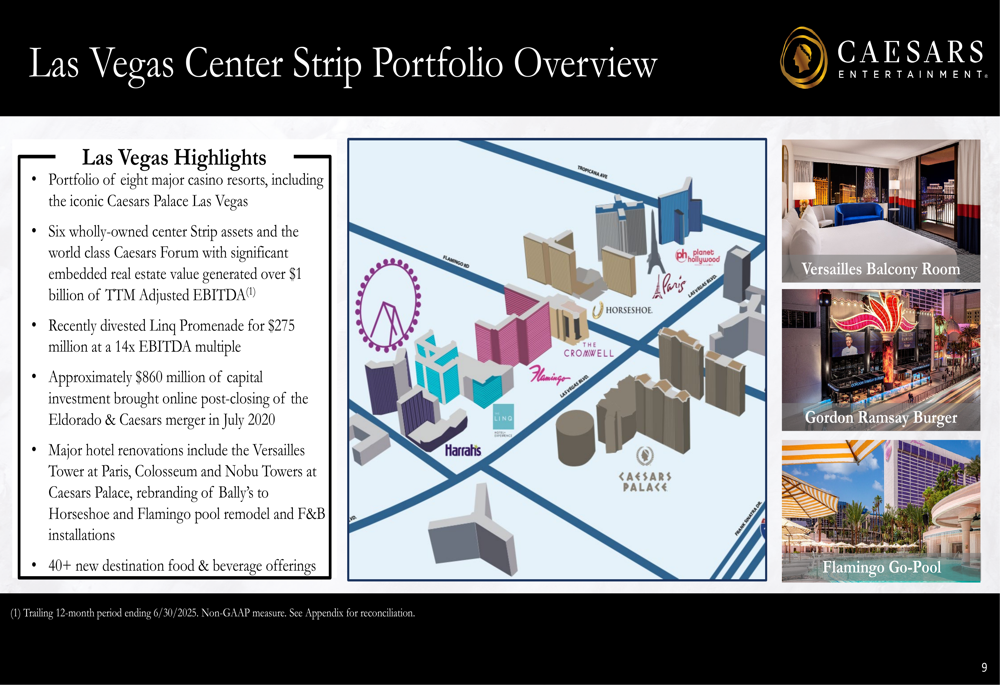
Despite these challenges, Caesars maintains a strong position in the Las Vegas market, with its Center Strip Portfolio generating over $1 billion in trailing twelve months adjusted EBITDA. The company recently divested the Linq Promenade for $275 million at a 14x EBITDA multiple, demonstrating its ability to optimize its property portfolio.
The Las Vegas Center Strip Portfolio includes eight major casino resorts, as illustrated below:
Strategic Initiatives
Caesars is pursuing several strategic initiatives to drive future growth, with digital transformation at the forefront. The company has launched a Universal Digital Wallet on its mobile sportsbook app, currently available in 19 jurisdictions, with plans for further expansion. This wallet streamlines the wagering experience by enabling users to manage funds and Caesars Rewards in one place.
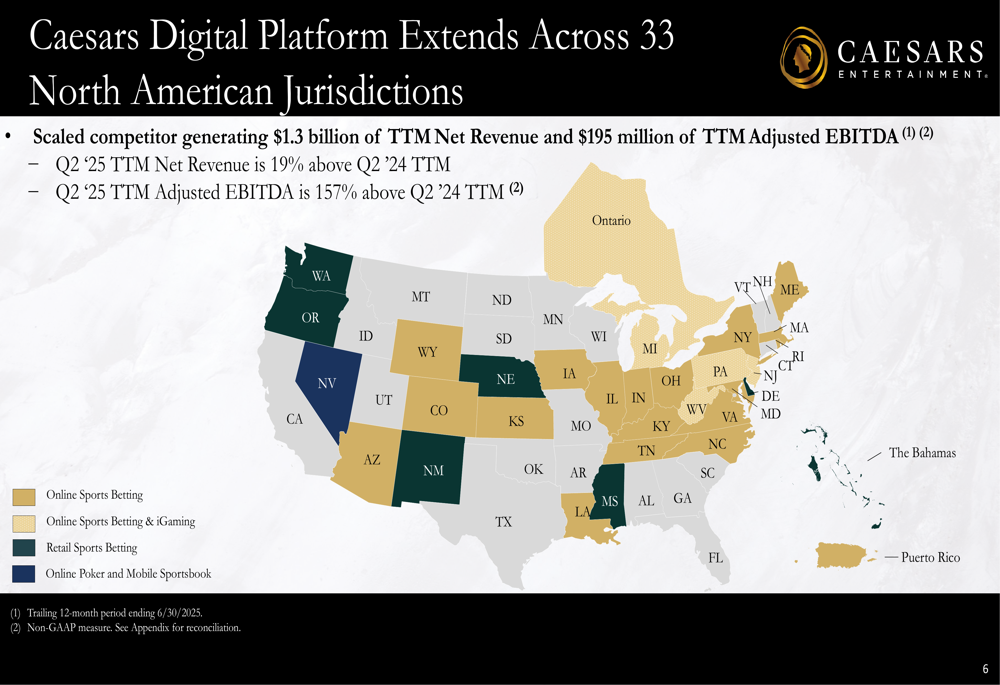
The company’s digital footprint now spans 33 North American jurisdictions, generating $1.3 billion in trailing twelve months net revenue and $195 million in adjusted EBITDA. This represents a 19% increase in net revenue and a 157% increase in adjusted EBITDA compared to the previous year.
As shown in the map below, Caesars has established a significant digital presence across North America:
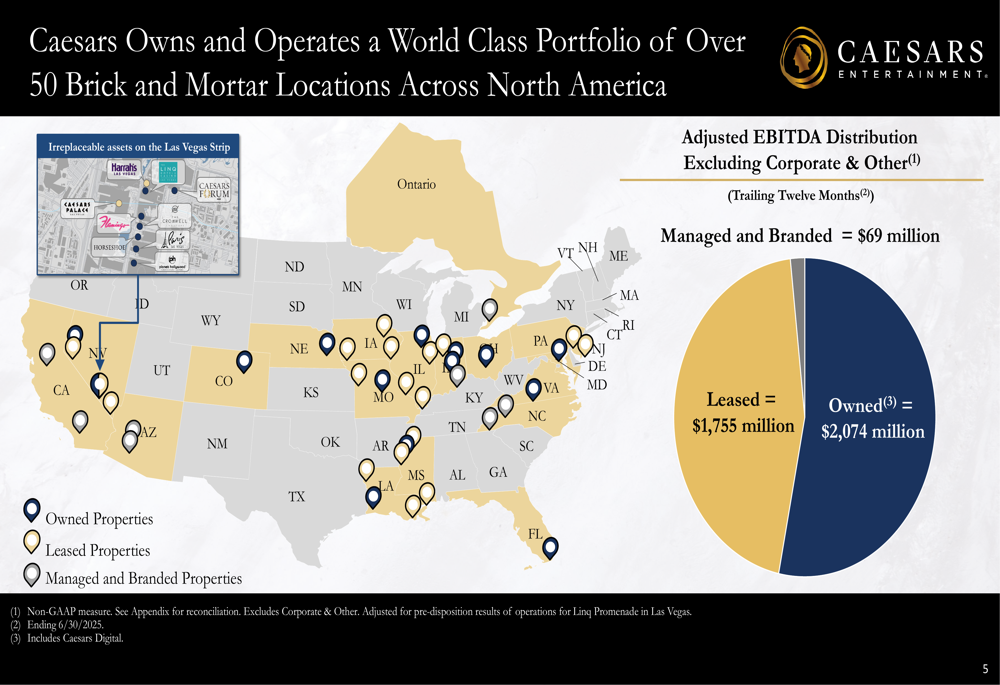
Another key strategic advantage is Caesars’ extensive physical footprint, with over 50 brick-and-mortar locations across North America. This network, combined with the company’s Caesars Rewards loyalty program, provides a competitive edge in customer acquisition and retention for both physical and digital operations.
The geographical distribution of Caesars’ properties and their contribution to adjusted EBITDA is illustrated below:
Forward-Looking Statements
Looking ahead to the remainder of 2025, Caesars provided financial guidance including Master Lease Rent of $1,350 million, Interest Expense of $775 million, and Capital Expenditures of $650 million (excluding the Caesars Virginia joint venture). The company expects Cash Income Taxes to be approximately 3-4% of Adjusted EBITDA.
Management emphasized that growing free cash flow will enable debt repayment and/or share repurchases, addressing one of the company’s key challenges—its debt load. The debt maturity schedule shows no major maturities until 2027, with significant amounts due between 2029 and 2032.
These forward-looking statements come as Caesars faces some financial headwinds. The trailing twelve months net income attributable to Caesars through Q2 2025 was negative $237 million, highlighting the importance of the company’s focus on EBITDA growth and debt management.
CEO Tom Reeg had previously expressed confidence in the company’s digital segment during the Q1 earnings call, stating, "Our digital segment is growing like we’ve never seen before in a prior downturn." The Q2 results appear to validate this optimism, with digital operations continuing to show strong growth despite challenges in traditional casino segments.
As Caesars navigates this transition period, the contrast between its thriving digital business and pressured traditional operations underscores the importance of its ongoing digital transformation strategy in securing long-term growth.
Full presentation:
This article was generated with the support of AI and reviewed by an editor. For more information see our T&C.