Raymond James raises Fulgent Genetics stock price target to $36 on strong performance

Introduction & Market Context
Carpenter Technology Corporation (NYSE:CRS) presented its first quarter fiscal year 2026 earnings results on October 23, 2025, showcasing record operating income and margins amid strong aerospace demand. The specialty alloy manufacturer’s stock surged 21.74% following the announcement, reflecting investor confidence in the company’s performance and outlook.
The results demonstrated Carpenter’s ability to capitalize on robust aerospace and defense market conditions, with particular strength in nickel-based superalloys where industry-wide supply constraints persist. The company’s strategic positioning in high-performance specialty materials continues to yield significant financial benefits in the current market environment.
Quarterly Performance Highlights
Carpenter Technology reported adjusted operating income of $153.3 million for Q1 FY26, representing a substantial 31% increase compared to $117.2 million in the same period last year. This performance translated to earnings per diluted share of $2.43, significantly outpacing analyst expectations of $2.12.
Net sales reached $733.7 million in the quarter, with net sales excluding surcharge revenue at $603.1 million. The company’s adjusted operating margin excluding surcharge revenue expanded to 25.4%, up from 20.3% in Q1 FY25, highlighting Carpenter’s effective pricing strategies and operational efficiency.
As shown in the following chart detailing the company’s operating income and margin expansion:
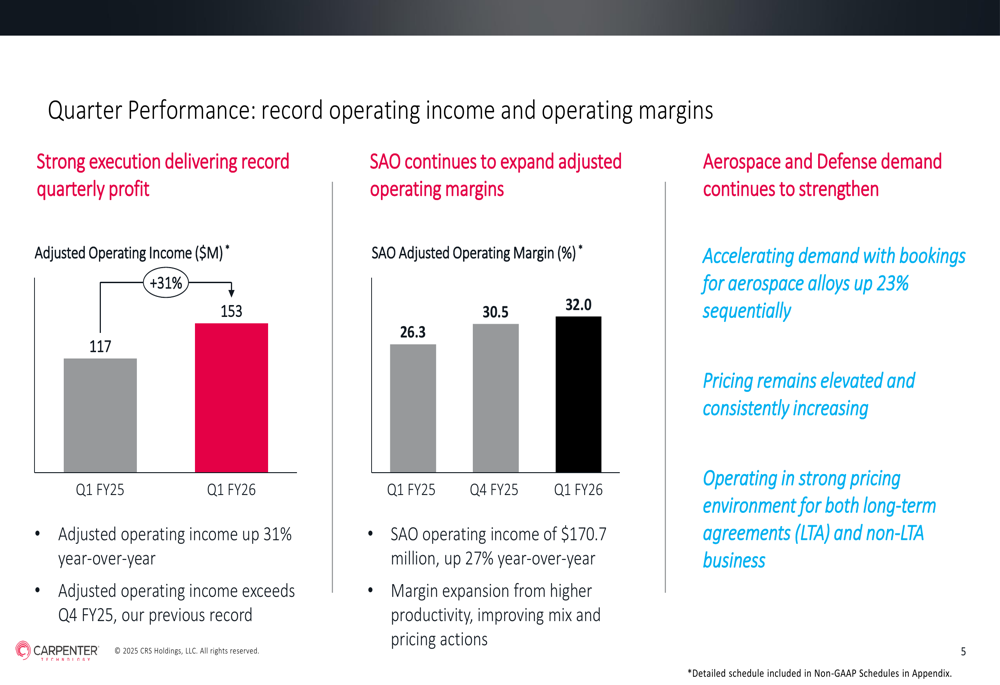
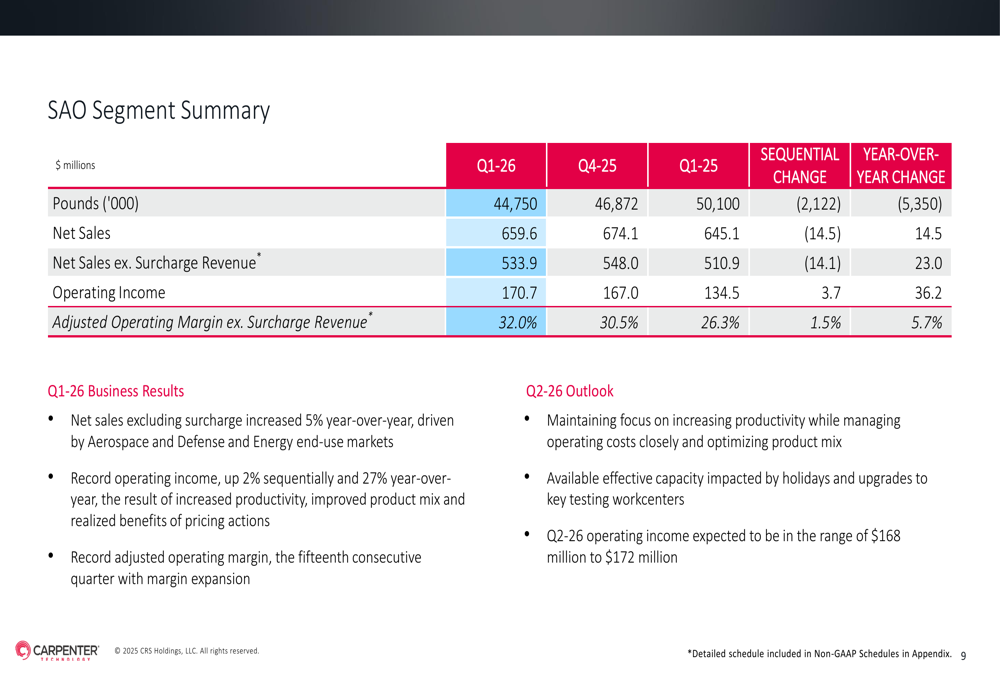
The Specialty Alloys Operations (SAO) segment, which represents Carpenter’s core business, delivered particularly impressive results with operating income of $170.7 million, up 27% year-over-year. The SAO adjusted operating margin reached 32.0% in Q1 FY26, compared to 26.3% in Q1 FY25 and 30.5% in Q4 FY25, marking the 15th consecutive quarter of margin expansion.
Segment Performance Analysis
Aerospace and defense remained Carpenter’s primary growth driver, accounting for 64% of total net sales at $388.3 million, an 11% increase year-over-year. The company reported that aerospace and defense bookings increased 23% sequentially, indicating continued momentum in this sector.
The following breakdown illustrates Carpenter’s sales performance across various market segments:
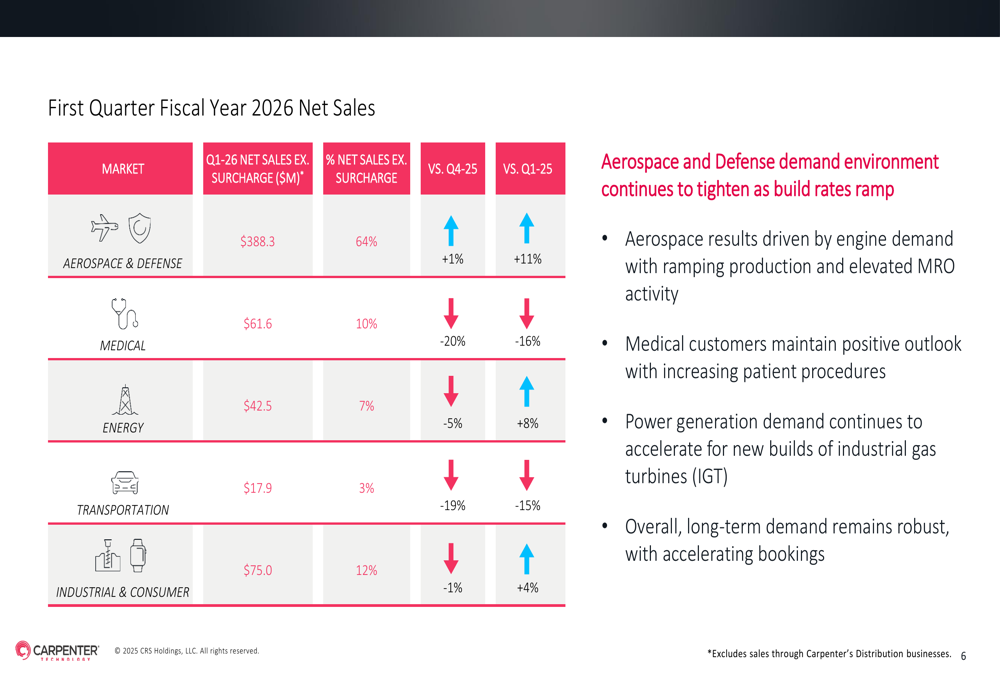
While aerospace and energy sectors showed growth, other segments experienced declines. Medical sales decreased 16% year-over-year to $61.6 million, representing 10% of total revenue. Transportation sales fell 15% compared to the previous year, while Industrial & Consumer sales increased modestly by 4%.
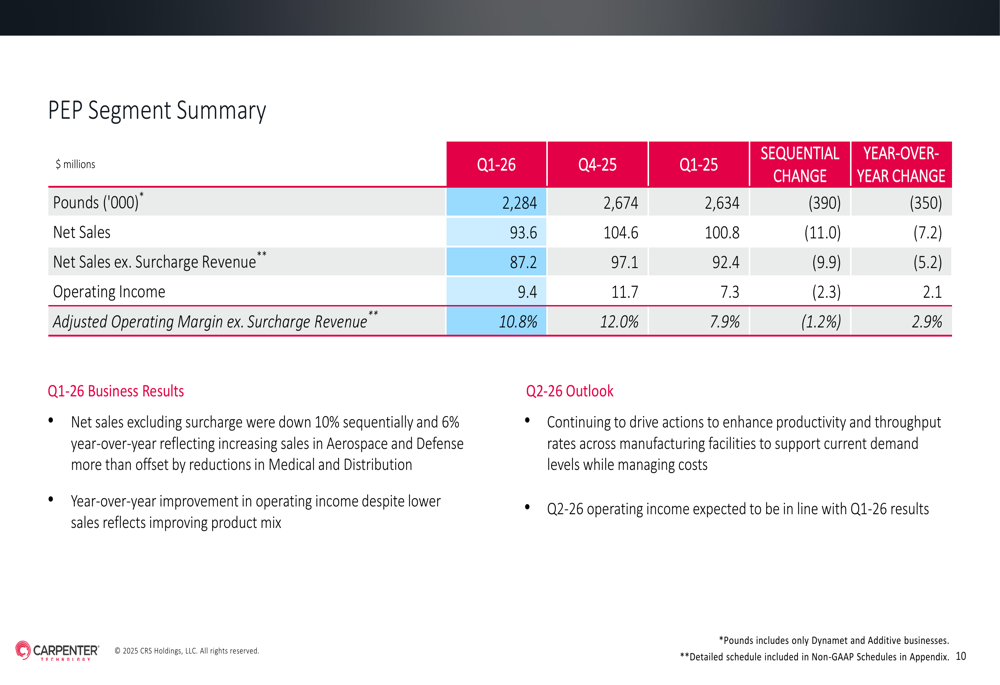
The Performance Engineered Products (PEP) segment generated $93.6 million in net sales, down 6% year-over-year, with an adjusted operating margin of 10.8%.
Capital Allocation and Cash Flow
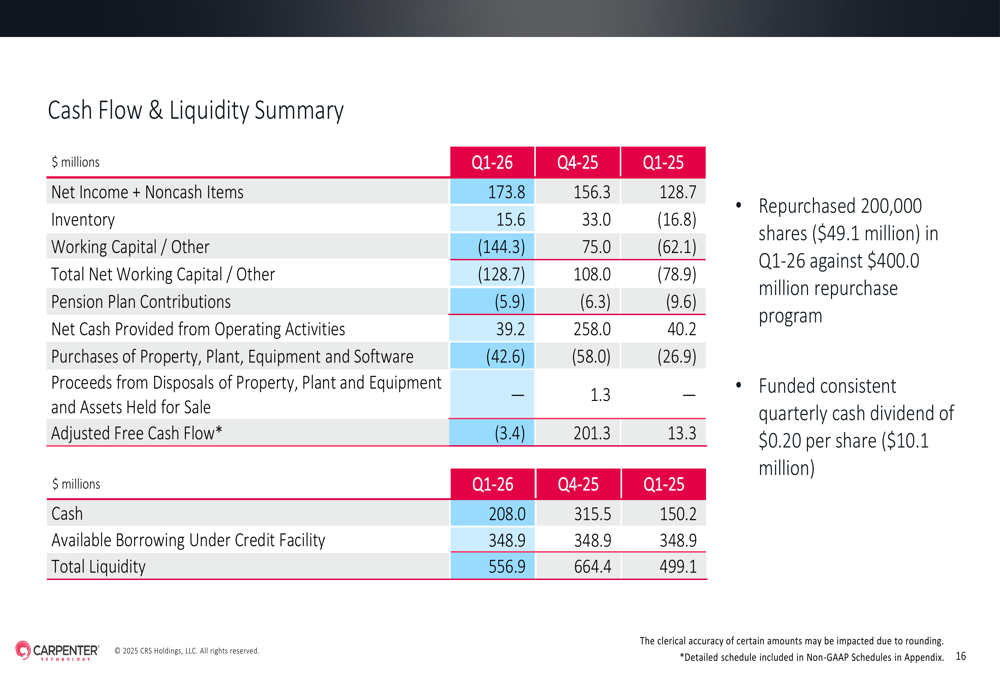
Carpenter Technology generated $39.2 million in cash from operating activities during Q1 FY26, while investing $42.6 million in capital expenditures. The company maintained a balanced capital allocation approach, returning value to shareholders through both dividends and share repurchases.
During the quarter, Carpenter repurchased $49.1 million in stock and maintained its quarterly cash dividend of $0.20 per share. The company’s financial position remains solid with total liquidity of $556.9 million, including $208 million in cash and $348.9 million in available borrowings. Notably, Carpenter’s net debt to EBITDA ratio remains below 1.0x, indicating a conservative leverage profile.
The following slide details the company’s capital allocation strategy:
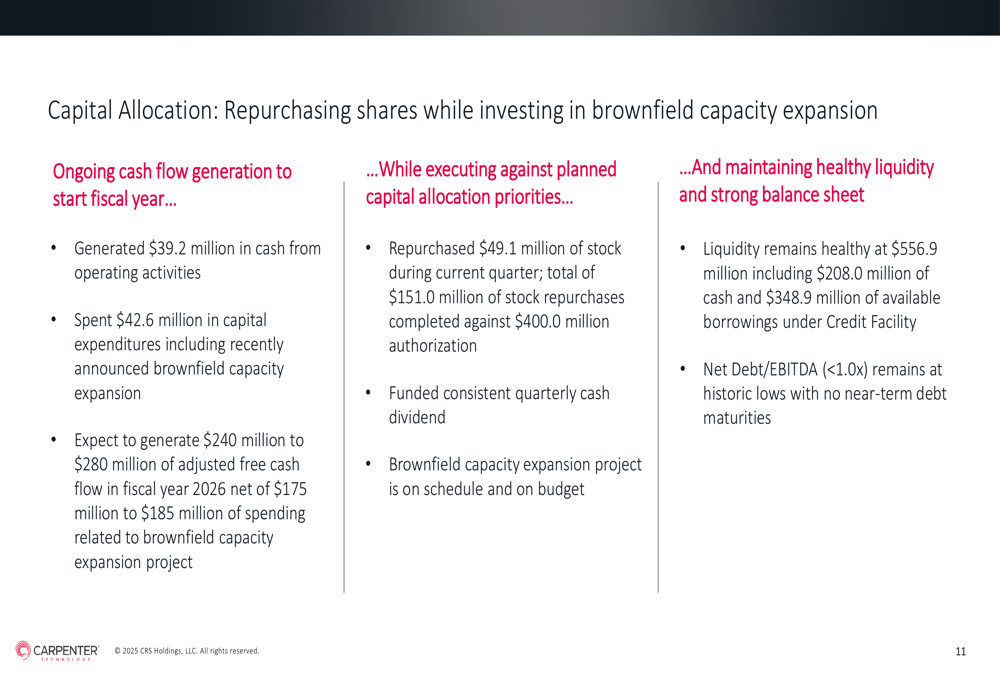
For the full fiscal year 2026, Carpenter projects adjusted free cash flow of $240 million to $280 million, providing substantial financial flexibility to fund growth initiatives while continuing shareholder returns.
Forward Guidance and Outlook
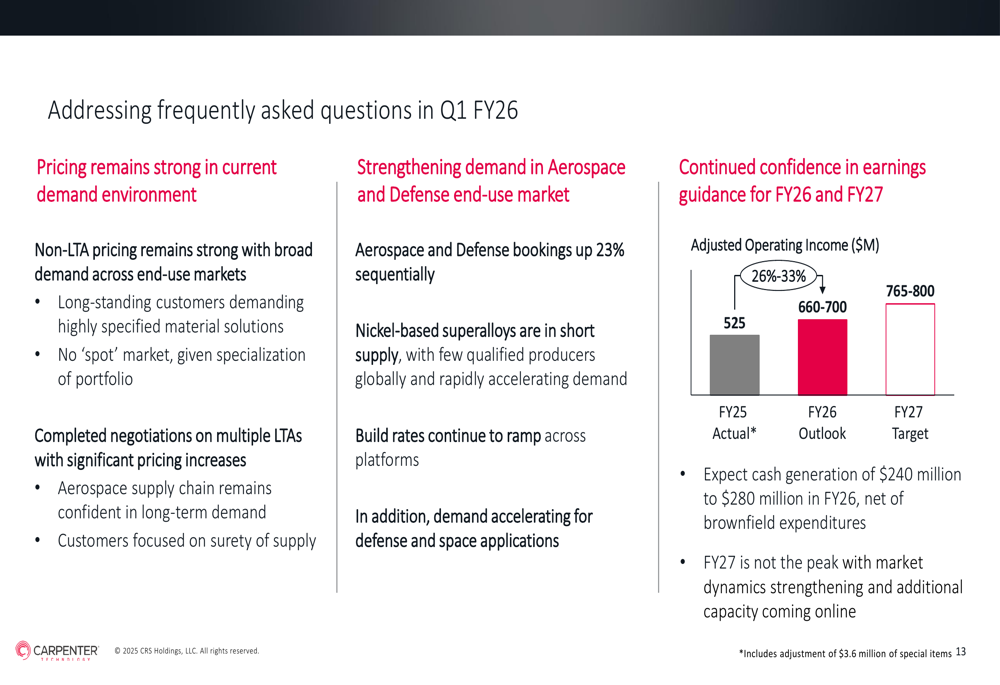
Carpenter Technology provided an optimistic outlook for both fiscal years 2026 and 2027, projecting adjusted operating income of $660-700 million for FY26 (representing 26-33% growth over FY25) and $765-800 million for FY27.
Management highlighted that aerospace and defense demand continues to strengthen, with nickel-based superalloys in short supply across the industry. The company expects to maintain its pricing power in both long-term agreements (LTA) and non-LTA business, supporting continued margin expansion.
The following slide illustrates Carpenter’s earnings trajectory and forward guidance:
CEO Tony Thene expressed confidence in the company’s outlook during the earnings call, stating: "We are only at the beginning of this growth journey. The best is still to come." He emphasized Carpenter’s unique position in the advanced materials market and the company’s focus on exceeding its fiscal year 2027 guidance.
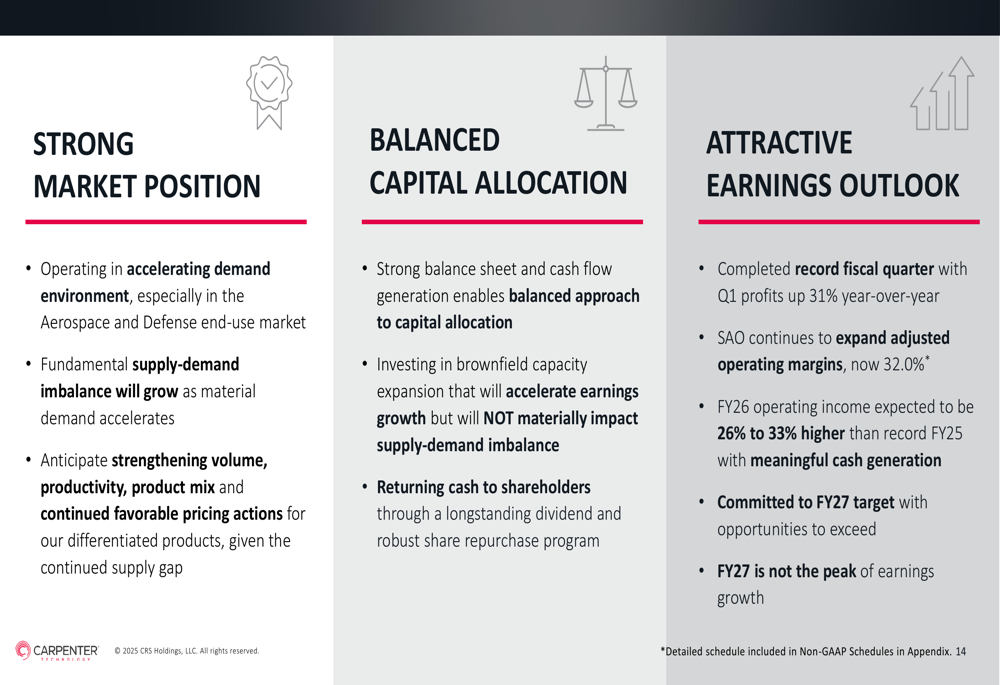
Carpenter’s strong Q1 FY26 performance and optimistic forward guidance suggest the company is well-positioned to capitalize on favorable industry dynamics, particularly in aerospace and defense markets. With consistent margin expansion, disciplined capital allocation, and robust demand for its specialty alloy products, Carpenter Technology appears poised for continued growth in the coming quarters.
Full presentation:
This article was generated with the support of AI and reviewed by an editor. For more information see our T&C.