Procore signs multi-year strategic collaboration agreement with AWS

Introduction & Market Context
Casey’s General Stores (NASDAQ:CASY) shares jumped 10.63% in premarket trading to $486 following the company’s investor presentation on June 10, 2025, and strong Q1 2025 earnings results. The convenience store operator reported Q1 earnings per share of $2.33, significantly beating analyst expectations of $2.03, while revenue reached $3.9 billion versus the forecasted $3.76 billion.
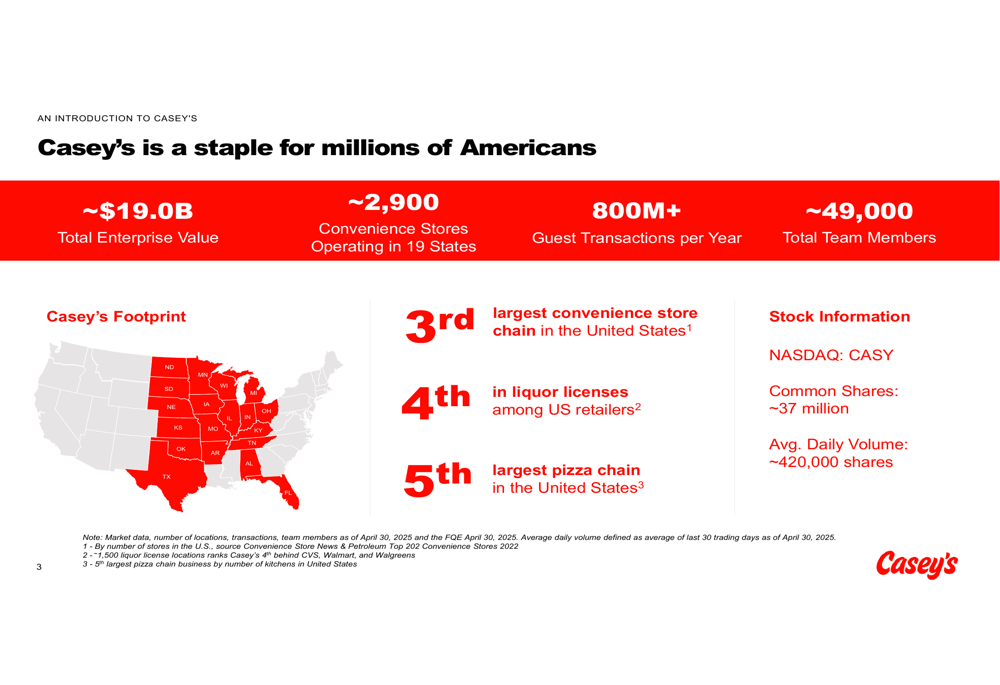
The presentation comes as Casey’s continues to strengthen its position as the third-largest convenience store chain in the United States, with approximately 2,900 stores across 19 states and a total enterprise value of around $19 billion.
Executive Summary
Casey’s outlined its strategic position as a unique player in the convenience store industry, highlighting its rural footprint advantage, prepared food business, and technological capabilities. The company processes over 800 million guest transactions annually and employs approximately 49,000 team members.
The investor presentation emphasized Casey’s competitive advantages, including that roughly two-thirds of its stores are located in towns with populations of 20,000 or fewer, providing stronger market positions in rural areas with lower operating costs.
As shown in the following overview of Casey’s market position:
Strategic Initiatives
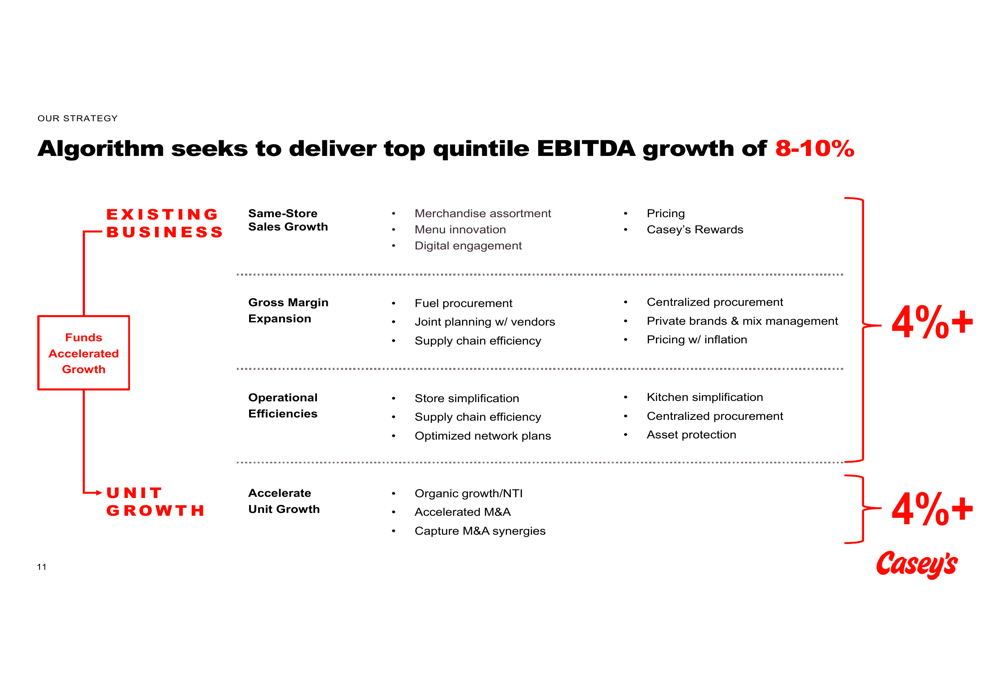
Casey’s detailed its FY24-FY26 strategic plan, targeting top-quintile EBITDA growth of 8-10% annually through fiscal 2026. The growth algorithm is split evenly between existing business optimization and unit growth, with each contributing approximately 4% to the overall target.
The company’s EBITDA growth strategy is illustrated in this detailed breakdown:
A key focus of Casey’s strategy is accelerating its food business, which has established the company as the fifth-largest pizza chain in the United States. Management emphasized that prepared food represents a larger percentage of inside sales mix compared to competitors, contributing to best-in-class margins.
Casey’s is also expanding its private label offerings, with over 300 SKUs that are margin accretive and approximately 120 SKUs unique to Casey’s. The company’s private label strategy focuses on beating national brands on quality, price, and profitability.
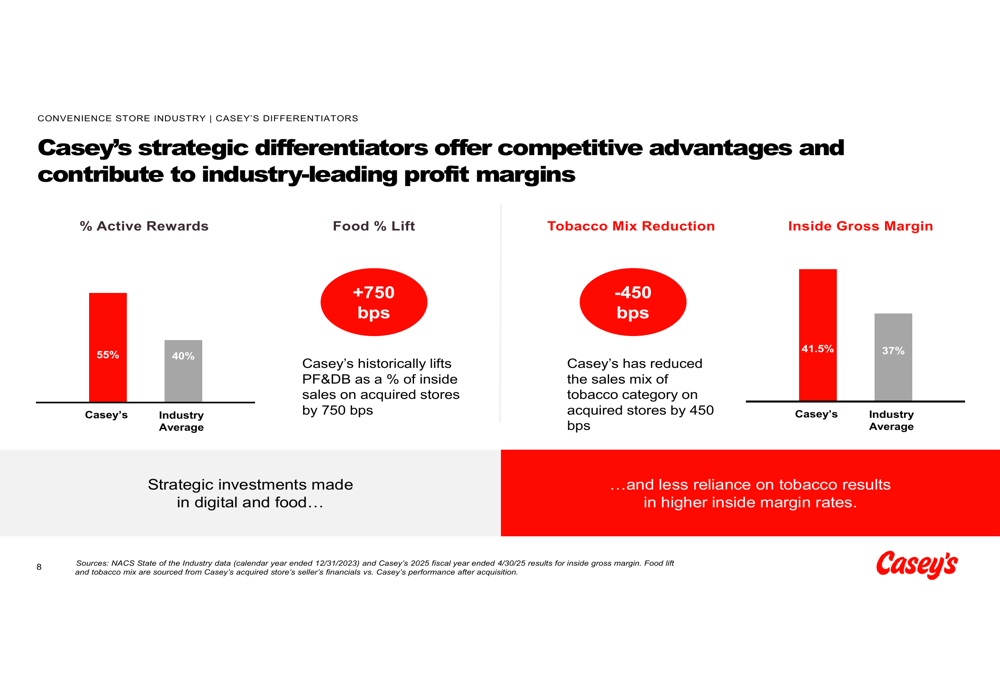
The following slide illustrates Casey’s strategic differentiators and their impact on profit margins:
Detailed Financial Analysis
Casey’s highlighted its track record of consistent financial performance, noting it is one of only three retailers out of 40 analyzed that have achieved 8%+ EBITDA growth over 1-year, 5-year, and 10-year periods. The company’s inside gross margin of 41.5% significantly outperforms the industry average of 37%.
The company reported substantial improvements in key financial metrics from FY19 to FY25, including:
- Operating expense management: 10.6% CAGR vs. EBITDA 13.4% CAGR
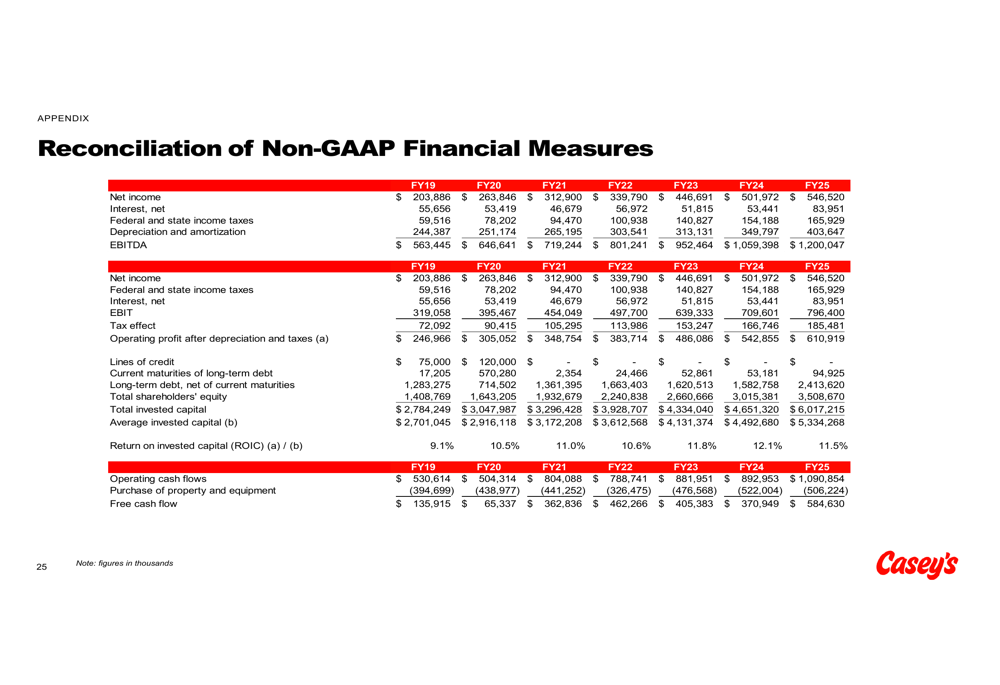
- Return on invested capital improvement: 11.5% in FY25, up approximately 240 basis points from FY19
- Free cash flow generation: $585 million in FY25 compared to $136 million in FY19
These financial improvements align with the Q1 2025 earnings report, which showed EBITDA of $242.4 million, up 11.4% year-over-year, and gross profit of $913 million, a 16% increase.
The reconciliation of non-GAAP financial measures provides a clear view of Casey’s financial progression:
Competitive Industry Position
Casey’s operates in a fragmented but consolidating convenience store industry. The presentation highlighted that while operators with 501+ stores represent 63% of the market, this segment grew by 12.4% from 2020 to 2023, while smaller operators generally declined.
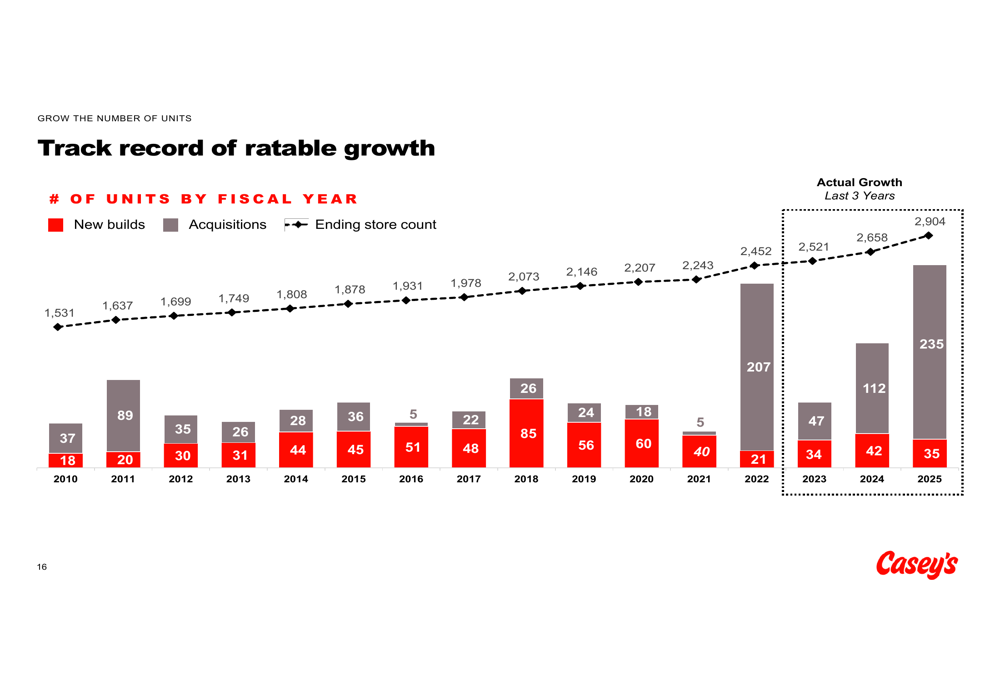
The company has been an active participant in industry consolidation, acquiring 701 stores over the past 10 years, with 394 of those acquisitions occurring in just the last three years. Casey’s emphasized its ability to improve acquired stores by historically lifting prepared food as a percentage of inside sales by 750 basis points while reducing tobacco mix by 450 basis points.
The company’s rewards program is another competitive advantage, with 55% active rewards members compared to the industry average of 40%. Casey’s has over 9 million rewards members, enabling personalized marketing and higher transaction values.
The following slide illustrates Casey’s growth track record through both new builds and acquisitions:
Forward-Looking Statements
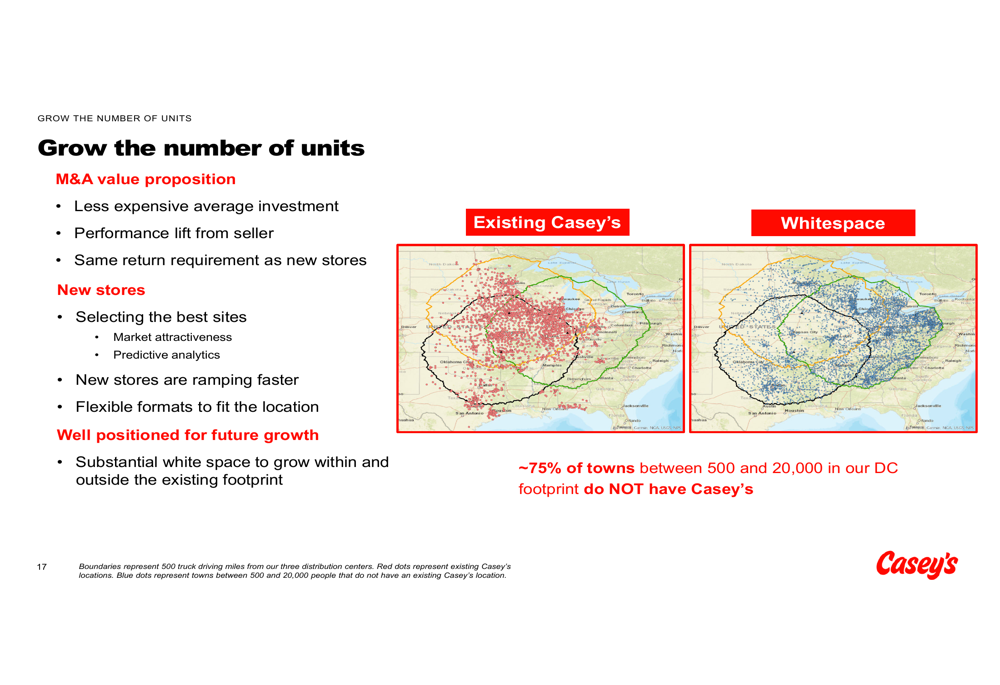
Casey’s outlined ambitious expansion plans, targeting approximately 500 additional stores through new builds and acquisitions by FY2026. The company identified substantial white space for growth, noting that approximately 75% of towns between 500 and 20,000 people within its distribution center footprint do not currently have a Casey’s location.
The company’s unit growth strategy is illustrated in this geographic expansion plan:
Additional forward-looking guidance includes:
- Inside sales growth in the mid-single digits
- Fuel gallons growth flat to low single digits
- Margin expansion inside the store
- Fuel margin in the mid-30s cents per gallon
- Operating expense growth less than EBITDA growth
- Free cash flow of approximately $1.25 billion through FY2026
During the recent earnings call, CEO Dan Rebellas highlighted the company’s ability to guide EBITDA growth above its standard algorithm, while CFO Steve Bramlich noted Casey’s resilience in various external environments. The company anticipates an 11% increase in EBITDA for the current fiscal year, aligning with the strategic plan’s targets.
The investment case for Casey’s is summarized in this comprehensive overview:
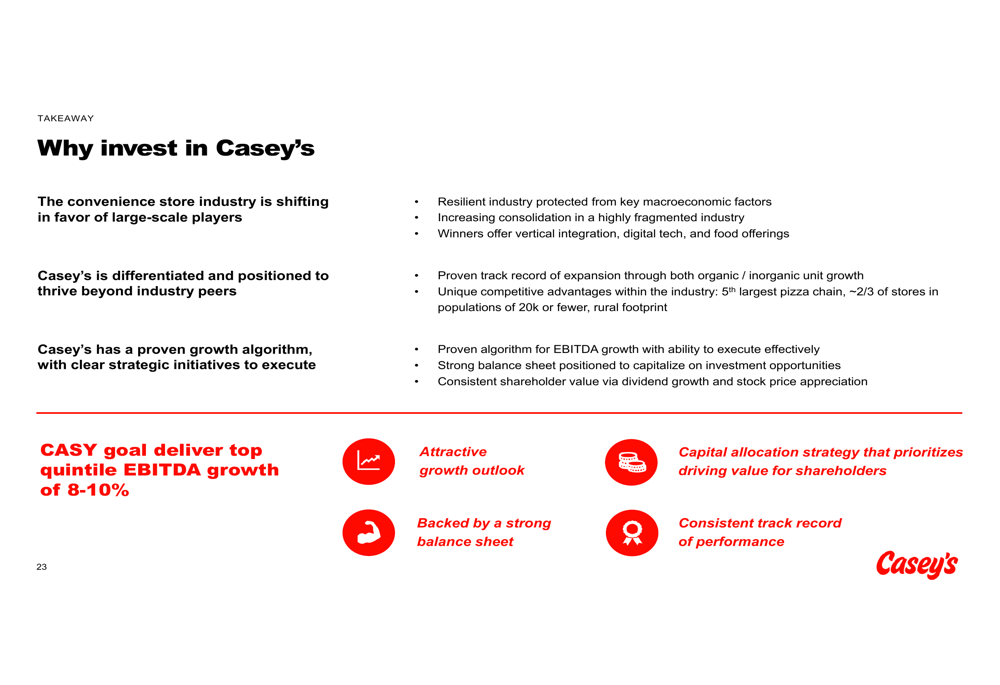
With its unique rural footprint, strong prepared food business, and clear expansion strategy, Casey’s is positioning itself to capitalize on industry consolidation while delivering consistent financial growth for investors.
Full presentation:
This article was generated with the support of AI and reviewed by an editor. For more information see our T&C.