Sprouts Farmers Market closes $600 million revolving credit facility

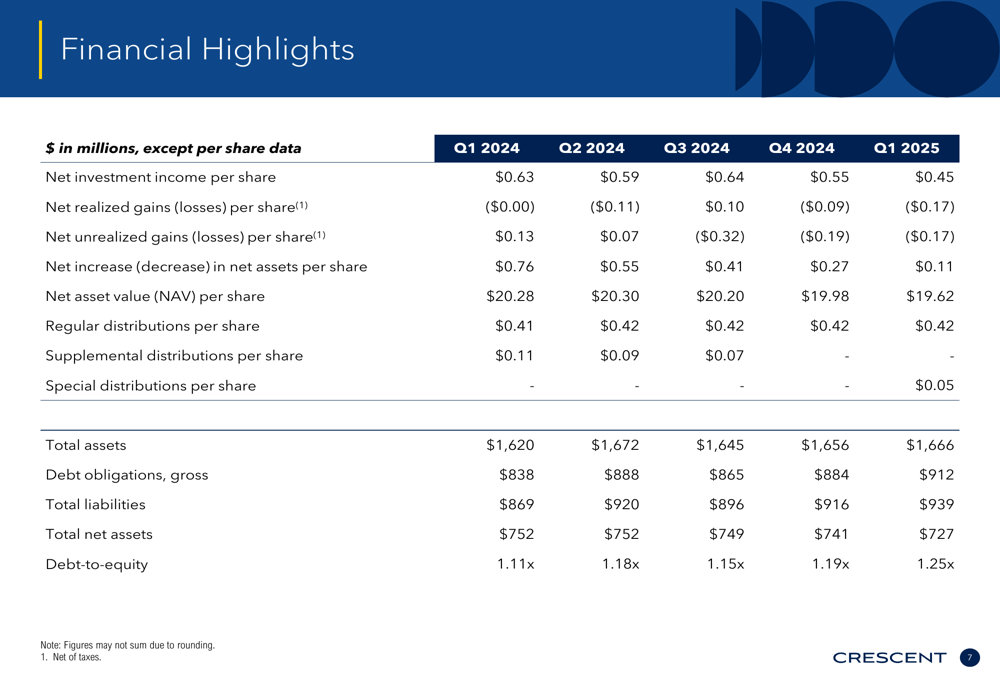
Crescent Capital BDC, Inc. (NASDAQ:CCAP) released its first quarter 2025 earnings presentation on May 15, revealing declining income metrics despite portfolio growth and maintained dividend payments. The business development company reported net investment income of $0.45 per share, down from $0.55 in the previous quarter, while expanding its investment portfolio to $1.62 billion across 191 companies.
Quarterly Performance Highlights
Crescent Capital BDC reported mixed financial results for Q1 2025. Net investment income per share fell to $0.45, compared to $0.55 in the prior quarter and $0.63 in the same quarter last year. Net income per share dropped to $0.11, less than half of the $0.27 reported in Q4 2024. The company’s net asset value (NAV) per share declined to $19.62, continuing a downward trend from $19.98 at the end of 2024.
Despite these challenges, CCAP maintained its regular quarterly dividend of $0.42 per share for Q2 2025, payable on July 15, 2025. The company also paid the first of three previously announced special dividends of $0.05 per share on March 14, 2025.
As shown in the following financial highlights table, CCAP has experienced a consistent decline in NAV per share and net investment income over the past year:
Detailed Financial Analysis
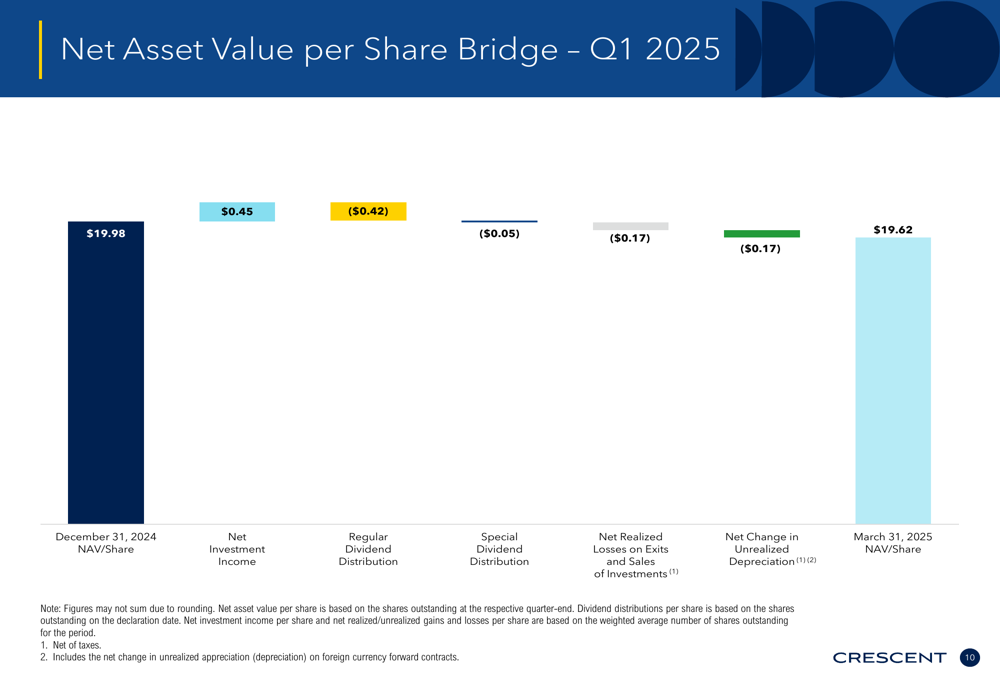
The company’s NAV per share bridge for Q1 2025 illustrates the factors contributing to the decline from $19.98 to $19.62. While net investment income contributed positively ($0.45), this was more than offset by dividend distributions ($0.47) and net realized and unrealized losses ($0.34).
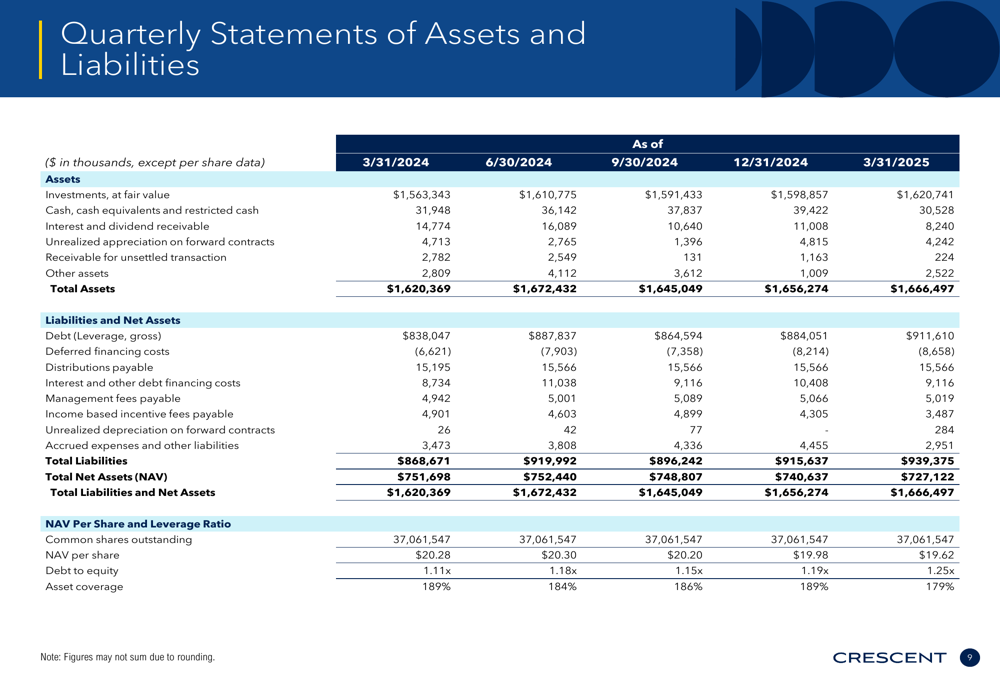
Total (EPA:TTEF) investment income decreased to $42.1 million in Q1 2025 from $46.4 million in the previous quarter. Interest and dividend income fell to $41.3 million from $45.8 million. Meanwhile, total expenses and taxes remained relatively stable at $25.5 million compared to $25.9 million in Q4 2024.
The company’s debt-to-equity ratio increased to 1.25x from 1.19x in the previous quarter, while asset coverage decreased to 179% from 189%. Total assets stood at $1.67 billion, with total net assets of $727 million.
Portfolio Composition and Strategy
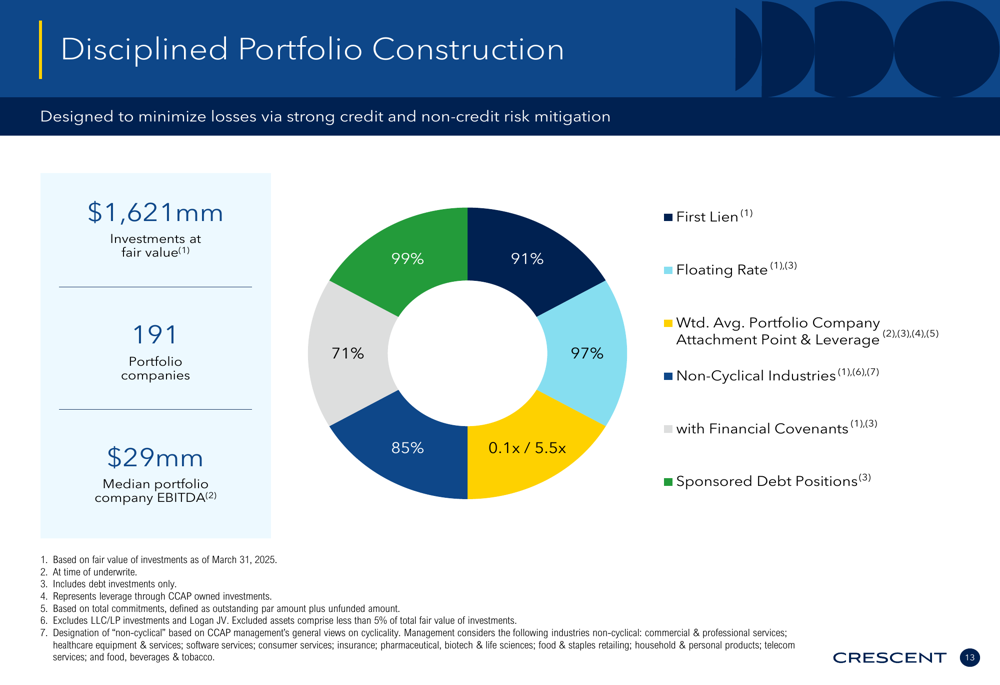
Despite financial headwinds, CCAP continued to expand its investment portfolio, which grew to $1.62 billion across 191 companies in 20 industries, up from 185 companies in the previous quarter. The company maintained its disciplined approach to portfolio construction, with 91% of investments in first lien loans and 99% in floating rate instruments.
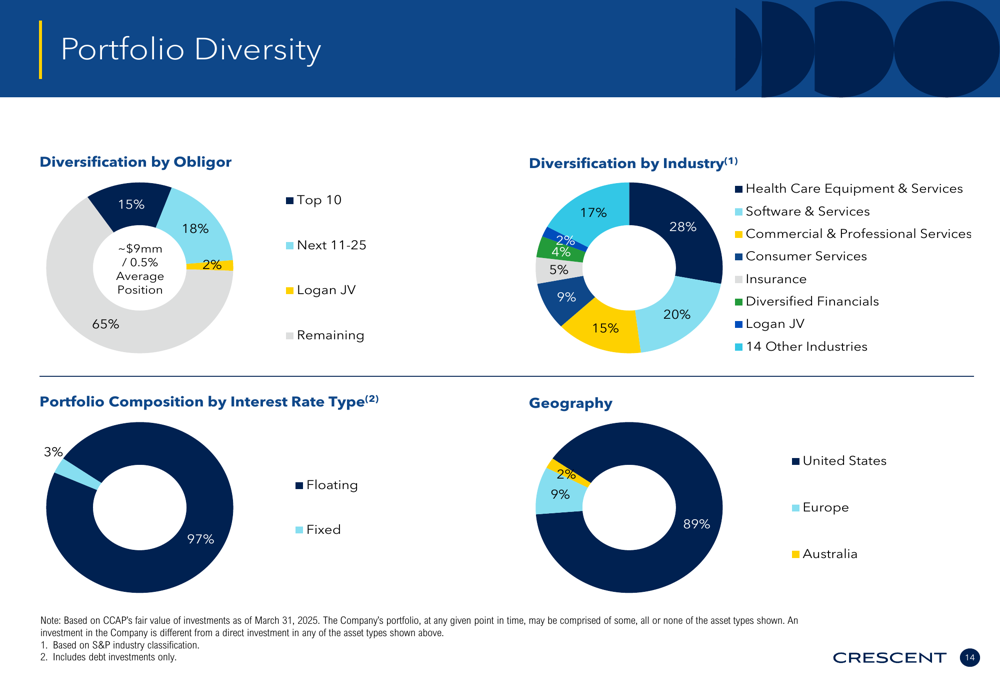
The portfolio remains well-diversified across industries, with the largest concentrations in Software (ETR:SOWGn) & Services (28%) and Healthcare Equipment & Services (17%). The median portfolio company EBITDA was $29 million, and 97% of investments were in non-cyclical industries.
The company’s portfolio diversity by obligor and industry shows a balanced approach to risk management. The top 10 obligors represent 15% of the portfolio, while the remaining 65% is spread across numerous smaller positions, with an average position size of approximately $9 million or 0.5% of the portfolio.
Credit Quality and Performance
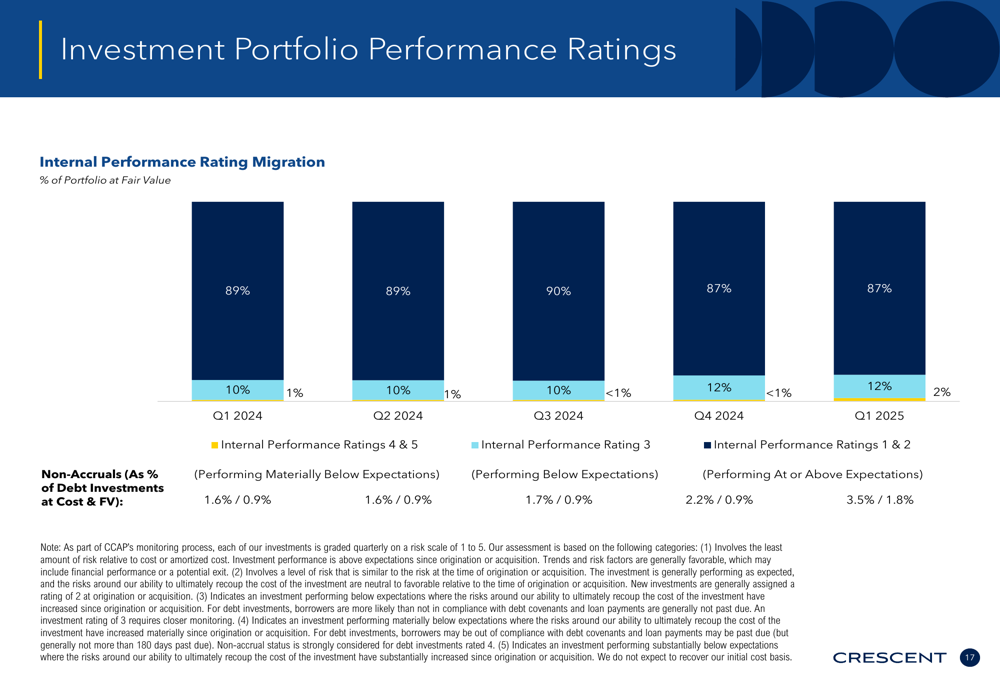
CCAP’s internal performance ratings showed some deterioration in Q1 2025. Investments rated as "Performing at or Above Expectations" (Ratings 1 & 2) decreased to 84.2% of the portfolio at fair value, down from 86.3% in the previous quarter. Meanwhile, investments rated as "Performing Materially Below Expectations" (Ratings 4 & 5) increased to 10.5% from 9.1%.
Non-accruals represented 3.5% of the portfolio at cost and 1.8% at fair value as of March 31, 2025, indicating some credit quality challenges.
Capital Structure and Liquidity
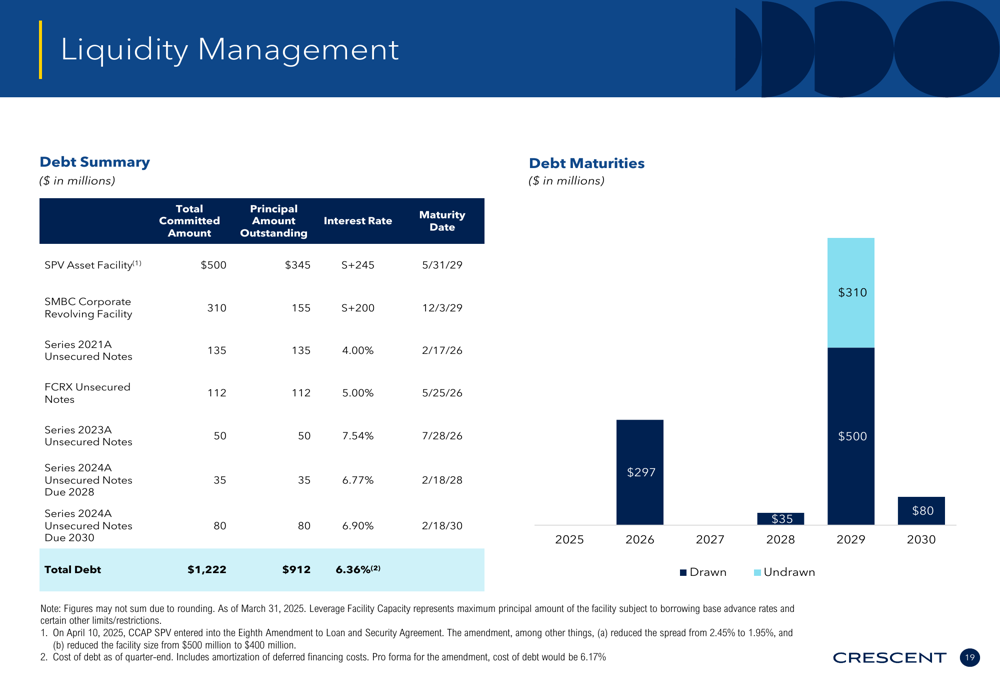
CCAP maintained a strong liquidity position with $30.5 million in cash and cash equivalents and $310.0 million of undrawn debt capacity as of March 31, 2025. The company’s debt maturity profile is well-structured, with no significant maturities until 2026.
The weighted average stated interest rate on debt outstanding was approximately 6.3% in Q1 2025, while the weighted average yield on income-producing securities was 10.4%, resulting in a net interest margin of approximately 4.1%.
Forward-Looking Statements
While CCAP’s presentation did not provide explicit forward guidance, the company’s investment activity suggests a continued focus on portfolio growth and diversification. In Q1 2025, CCAP reported $104.7 million in new investment activity and $26.6 million in net funded investment activity.
The company’s strategy remains centered on first lien loans to middle-market companies, with a preference for sponsored transactions in non-cyclical industries. This conservative approach may help navigate the challenging economic environment, though the declining NAV and net investment income trends bear watching in upcoming quarters.
Based on the extended session trading data, CCAP’s stock was down 3.96% to $16.00 after hours, reflecting investor concerns about the declining financial metrics despite the maintained dividend. The stock has traded between $13.54 and $20.13 over the past 52 weeks, with the current price representing a significant discount to the NAV of $19.62 per share.
Full presentation:
This article was generated with the support of AI and reviewed by an editor. For more information see our T&C.