Stock market today: S&P 500 climbs as health care, tech gain; Nvidia earnings loom

Introduction & Market Context
DOMS Industries Limited (NSE:DOMS), a leading child-centric stationery and art materials company, reported robust revenue growth in its Q1 FY26 investor presentation. The company’s stock closed at ₹2,493.10 on August 26, 2025, down 1.28% for the day, reflecting some market caution despite strong operational performance.
The company, which operates through established brands like DOMS, C3 (Joy of Creation), Amariz, and others, continues to expand its presence across India while growing its export business. With 18 manufacturing facilities across 5 locations and a workforce exceeding 13,000, DOMS has positioned itself as a significant player in the stationery and art materials sector.
Quarterly Performance Highlights
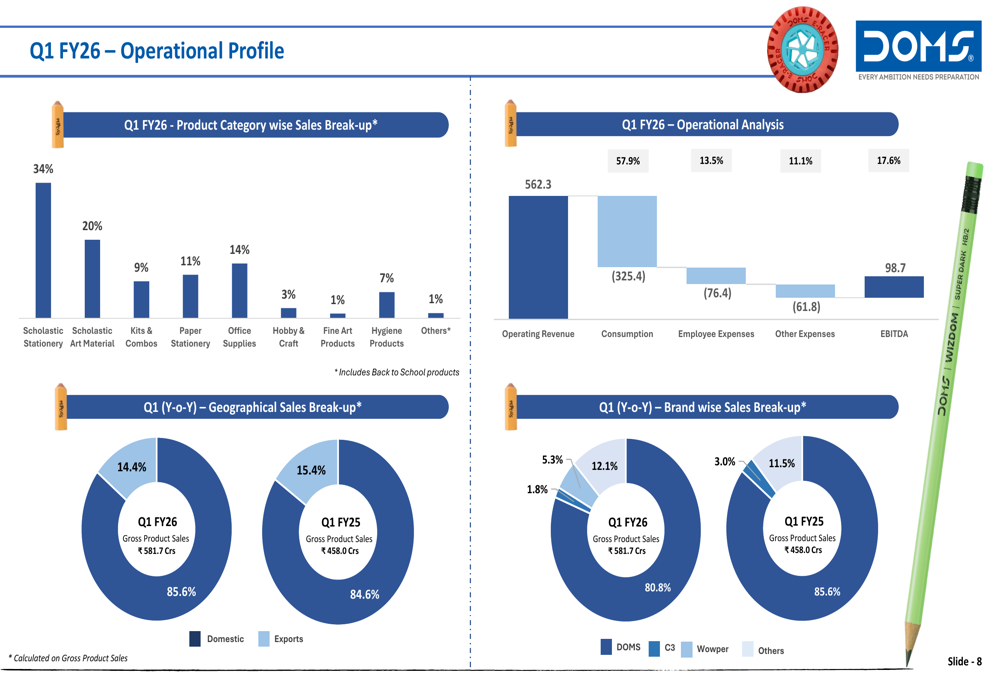
DOMS reported consolidated operating revenue of ₹562.3 crores for Q1 FY26, representing a substantial year-over-year growth of 26.4% compared to ₹445.0 crores in Q1 FY25. The company also achieved sequential growth of 10.5% from Q4 FY25.
As shown in the following chart of quarterly financial performance:
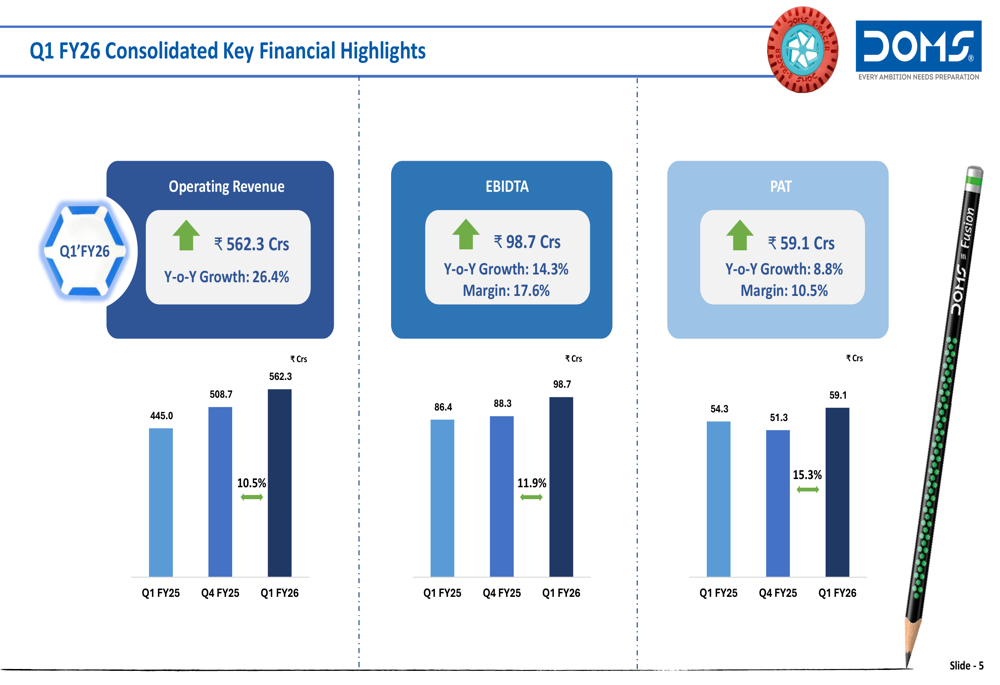
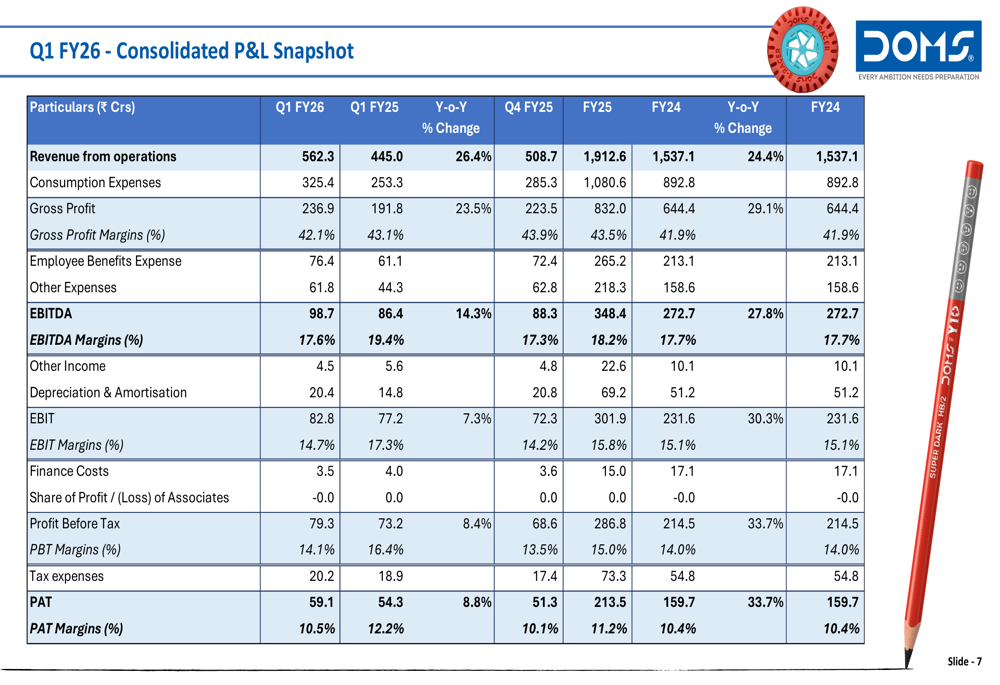
Despite the strong revenue growth, EBITDA margins faced some compression, declining to 17.6% in Q1 FY26 from 19.4% in the same quarter last year. EBITDA grew 14.3% year-over-year to ₹98.7 crores. Similarly, profit after tax (PAT) increased by 8.8% to ₹59.1 crores, though PAT margin contracted to 10.5% from 12.2% in Q1 FY25.
The detailed profit and loss statement reveals that while gross profit margin decreased slightly from 43.1% to 42.1%, the company maintained healthy profitability metrics:
Strategic Initiatives
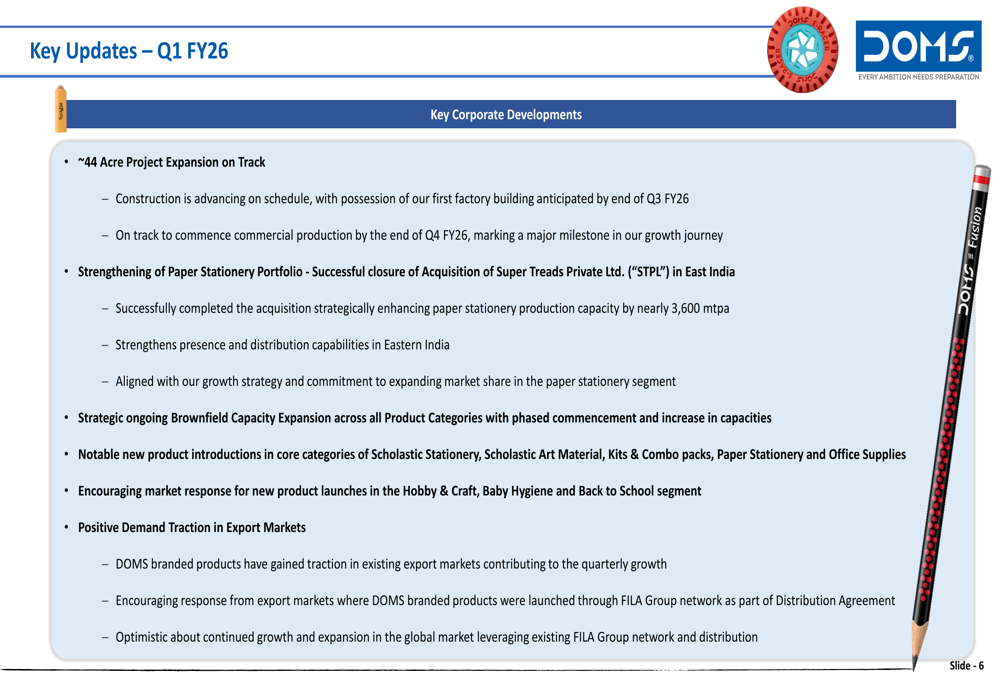
DOMS continues to execute its expansion strategy through both organic growth and strategic acquisitions. The company reported that construction of its 44-acre project expansion is proceeding on schedule, with commercial production expected to commence by the end of Q4 FY26.
A significant development during the quarter was the successful acquisition of Super Treads Private Ltd. in East India, which adds 3,600 metric tons per annum of paper production capacity, strengthening DOMS’ paper stationery portfolio.
The company highlighted these key updates in its presentation:
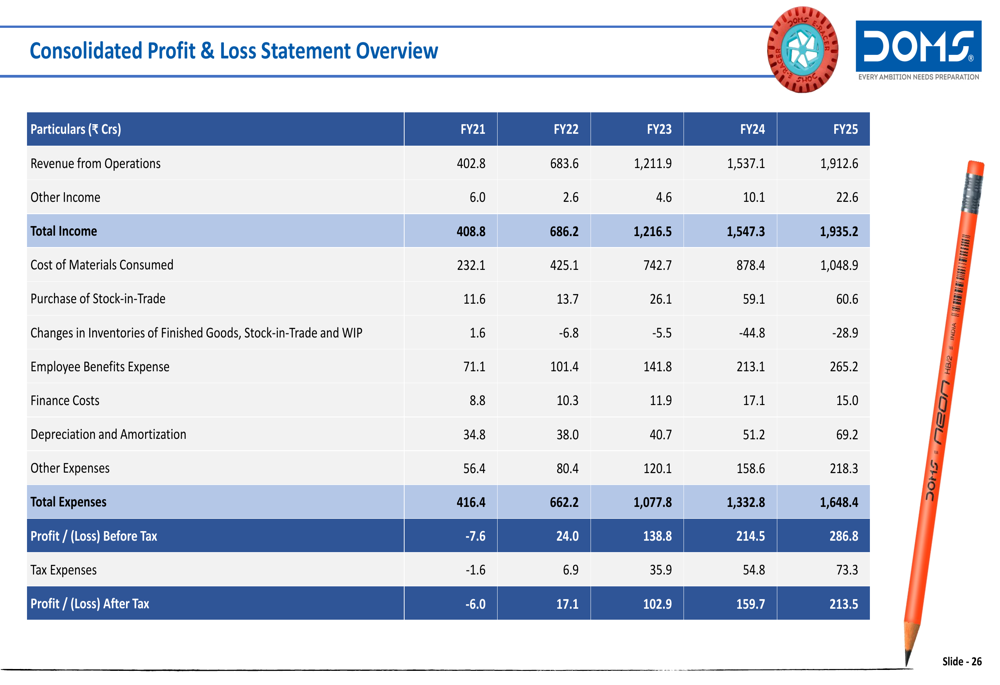
DOMS has demonstrated consistent growth over the past five years, transforming from a loss-making entity in FY21 to a highly profitable company by FY25. The consolidated profit and loss overview shows this remarkable trajectory:
Operational Overview
DOMS operates with a diversified product portfolio spanning eight categories, with Scholastic Stationery accounting for the largest share at 34% of sales, followed by Scholastic Art Material at 20%. The company’s operational profile for Q1 FY26 provides insights into its revenue distribution:
The company’s distribution network represents a key competitive advantage, with extensive reach across India through 130+ super stockists, 5,725+ distributors, and 145,000+ retail outlets. DOMS has achieved a balanced regional sales mix, with the western region contributing 33% of gross product sales, followed by the southern (28%), northern (22%), and eastern (17%) regions.
The following image illustrates DOMS’ extensive distribution network:
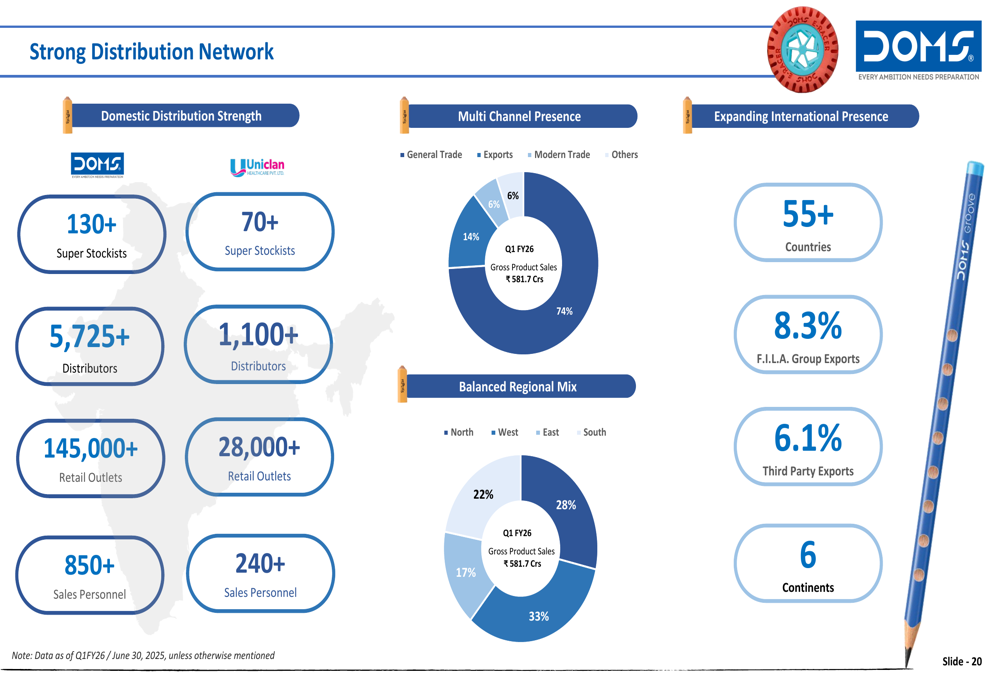
DOMS’ partnership with F.I.L.A. Group continues to be a strategic asset, providing access to global markets and product expertise. F.I.L.A., with its century of industry experience and presence in 150 countries, enables DOMS to leverage international distribution channels while benefiting from established product formulations.
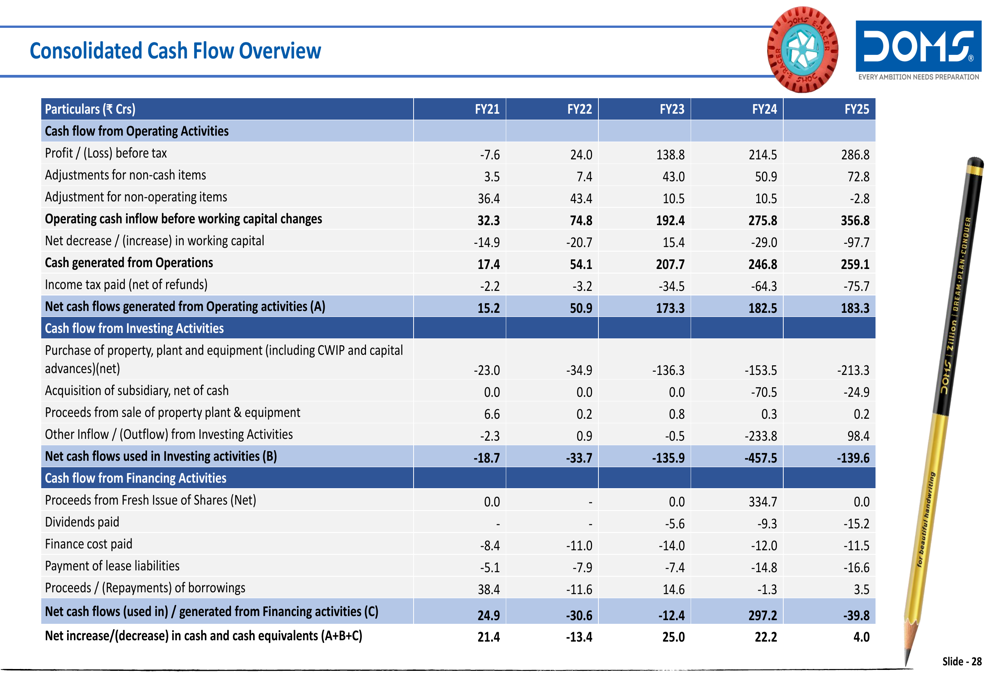
The company’s cash flow position has strengthened considerably over the years, supporting its expansion initiatives:
Forward-Looking Statements
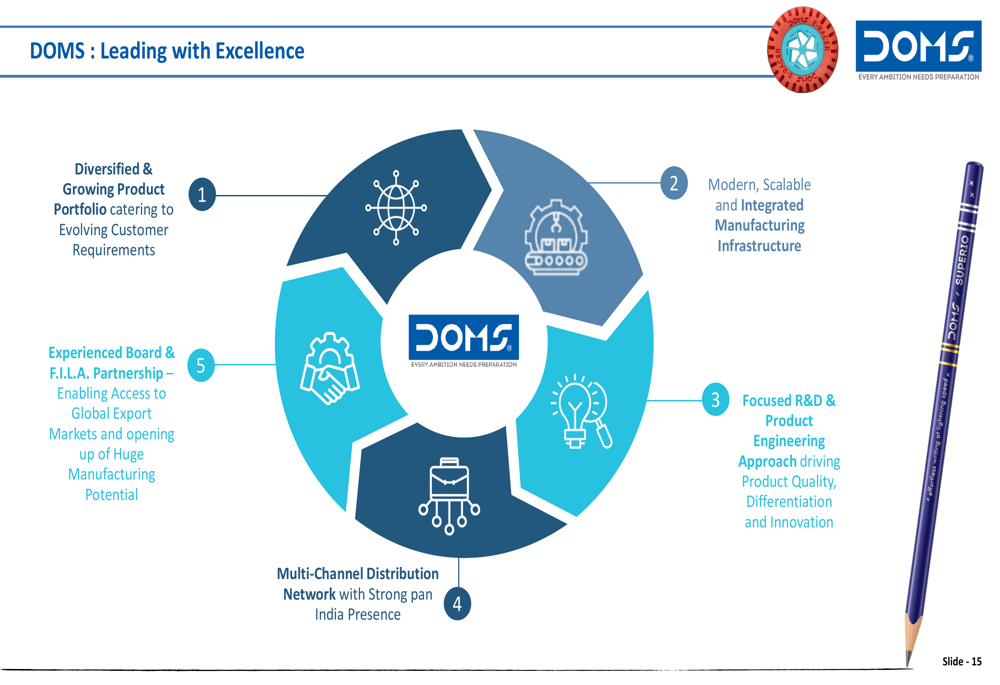
DOMS outlined a comprehensive growth strategy focused on five key pillars: expanding manufacturing capacity, capitalizing on inorganic growth opportunities, continuing product line expansion, strengthening distribution and market reach, and leveraging technology and data capabilities.
The company’s focus on research and development, with a dedicated team of 55+ employees and a quality assurance team of 145+ professionals, underscores its commitment to product innovation and differentiation. DOMS highlighted its backward-integrated manufacturing approach as a driver of operational efficiency, with in-house production of key components reducing reliance on external suppliers.
DOMS’ strategic positioning in the market is built around several core strengths:
With its strong revenue growth, strategic acquisitions, and ongoing capacity expansion, DOMS Industries appears well-positioned to continue its growth trajectory. However, investors will likely monitor margin developments closely in the coming quarters, as the slight compression in profitability metrics may warrant attention despite the impressive top-line performance.
Full presentation:
This article was generated with the support of AI and reviewed by an editor. For more information see our T&C.