Gold prices cool after hitting over 2-week high on Fed independence fears

Enpro Industries (NYSE:NPO) delivered strong first-quarter results for 2025, with significant growth in revenue, margins, and earnings per share, according to the company’s May 6 earnings presentation. The industrial technology company reported a 21% increase in adjusted diluted EPS, outpacing its 6.1% revenue growth, as both operating segments showed solid performance.
Quarterly Performance Highlights
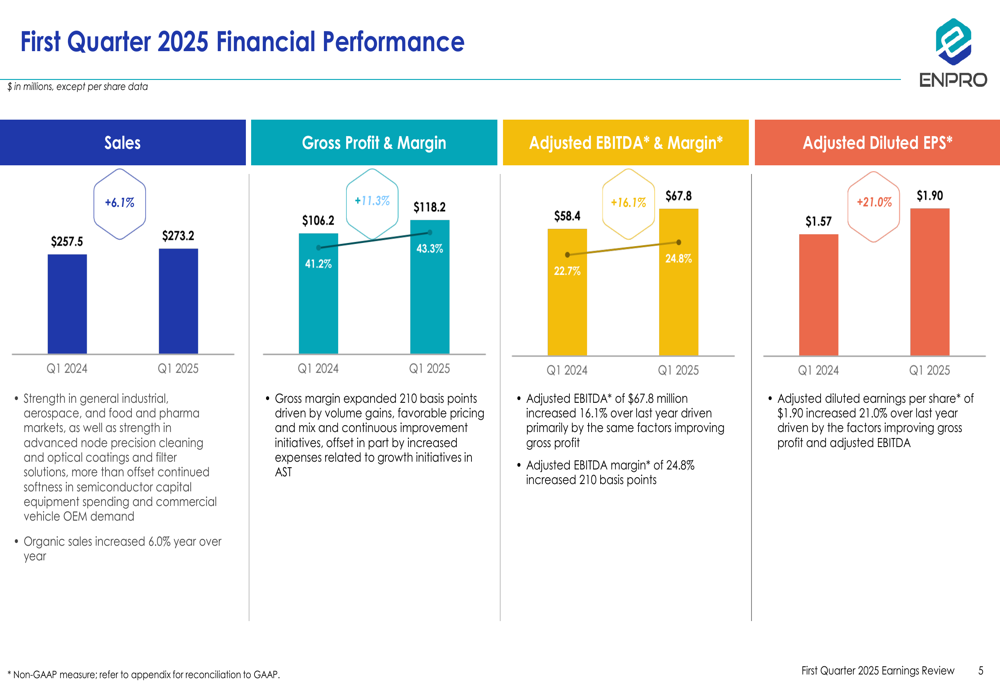
Enpro reported first-quarter sales of $273.2 million, representing a 6.1% increase from $257.5 million in the same period last year. Gross profit rose to $118.2 million with margin expansion to 43.3% from 41.2% in Q1 2024. Adjusted EBITDA grew by 16.1% to $67.8 million, with margins improving to 24.8% from 22.7% a year earlier.
The company’s adjusted diluted earnings per share reached $1.90, a 21.0% increase from $1.57 in Q1 2024, demonstrating Enpro’s ability to translate revenue growth into stronger bottom-line results.
According to the presentation, the strong performance was driven by "strengths in general industrial, aerospace, and food and pharma markets, as well as strength in advanced node precision cleaning," which more than offset softness in semiconductor capital spending.
As shown in the following chart of quarterly financial performance:
Segment Performance
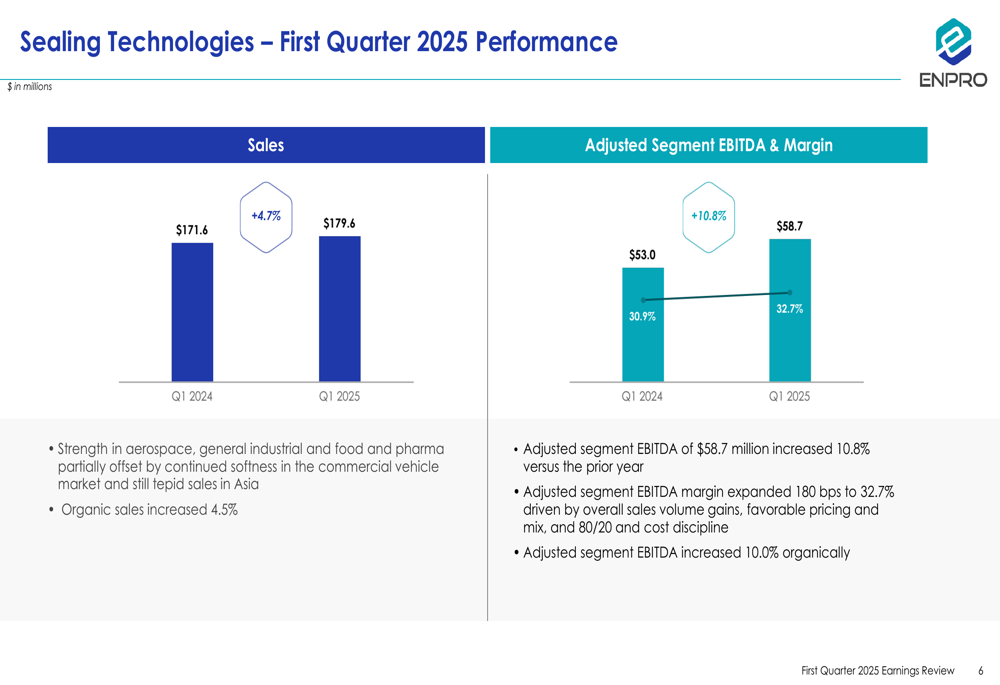
Enpro’s Sealing Technologies segment, which represents approximately 66% of total revenue, delivered sales of $179.6 million, up 4.7% from $171.6 million in Q1 2024. Organic sales for the segment increased by 4.5%. The segment’s adjusted EBITDA rose by 10.8% to $58.7 million, with margins expanding 180 basis points to 32.7%.
The company noted that strengths in aerospace, general industrial, and food and pharma markets partially offset continued softness in the commercial vehicle market and still tepid sales in Asia.
The segment’s performance is illustrated in the following chart:
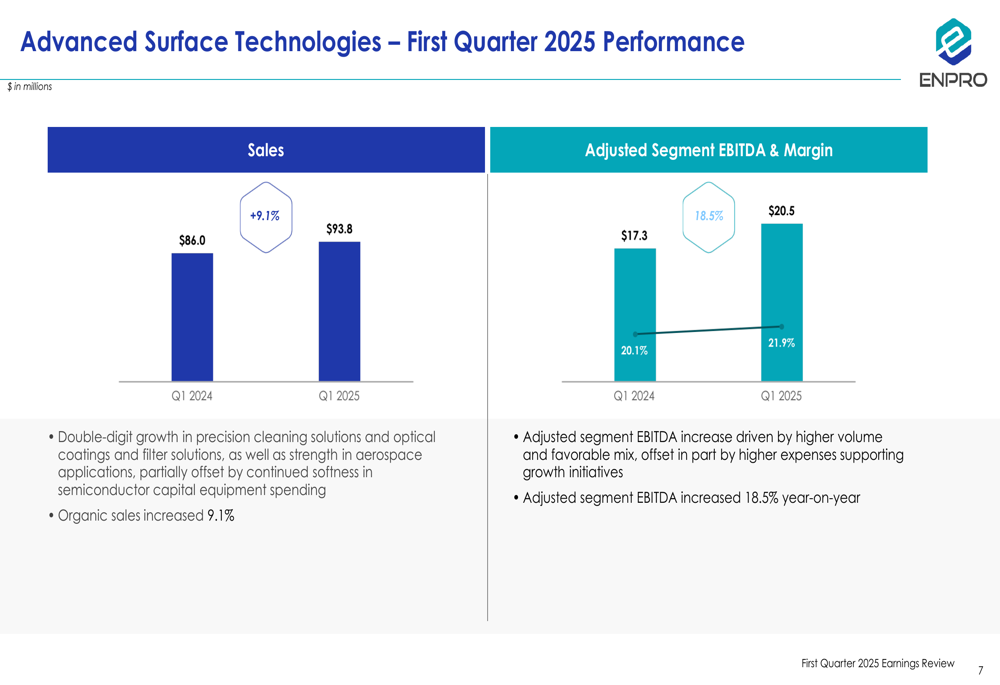
The Advanced Surface Technologies segment showed even stronger growth, with sales increasing 9.1% to $93.8 million compared to $86.0 million in Q1 2024. Adjusted segment EBITDA jumped 18.5% to $20.5 million, with margins improving to 21.9%.
This segment benefited from "double-digit growth in precision cleaning solutions and optical coatings and filter solutions, as well as strength in aerospace applications," which helped offset continued softness in semiconductor capital equipment spending.
The segment’s performance is detailed in the following chart:
Balance Sheet and Cash Flow
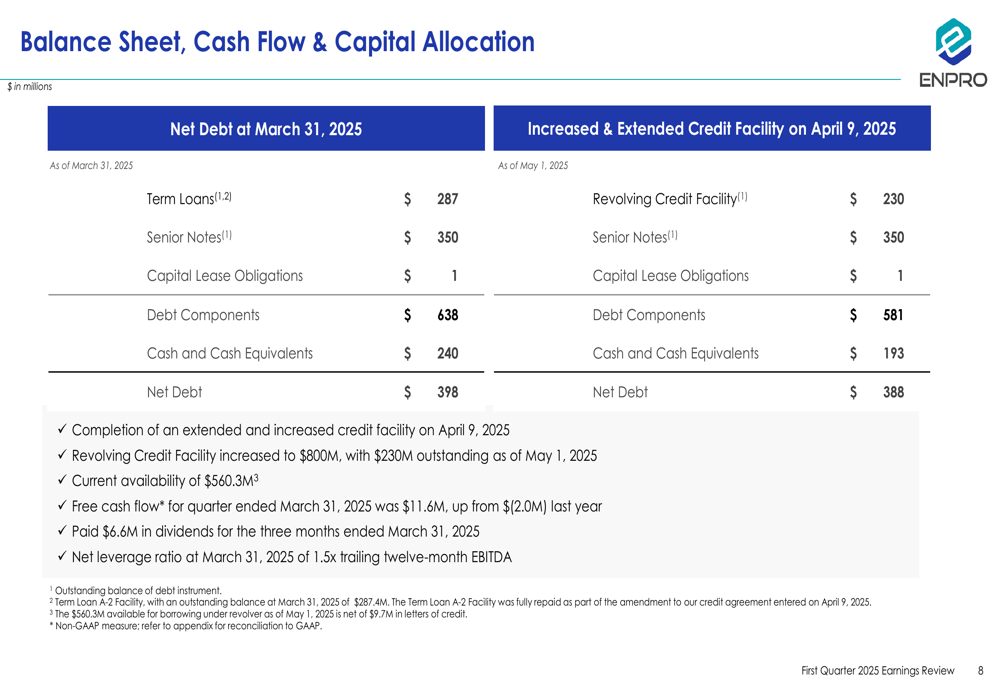
Enpro maintained a solid financial position with net debt of $398 million as of March 31, 2025, representing a net leverage ratio of 1.5x trailing twelve-month EBITDA. The company completed an extended and increased credit facility on April 9, 2025, which improved its financial flexibility.
Free cash flow for the quarter ended March 31, 2025, was $11.6 million, a significant improvement from $(2.0) million in the same period last year. The company paid $6.6 million in dividends during the quarter.
The following chart details Enpro’s balance sheet and capital allocation:
Outlook and Guidance
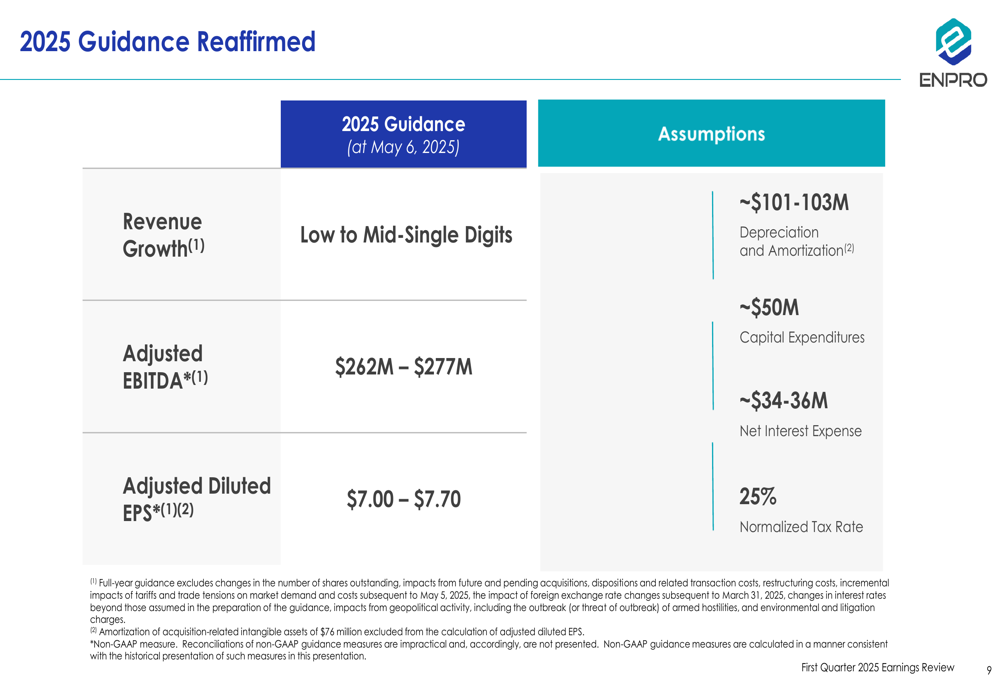
Enpro reaffirmed its full-year 2025 guidance, projecting low to mid-single-digit revenue growth, adjusted EBITDA of $262 million to $277 million, and adjusted diluted EPS of $7.00 to $7.70.
The guidance is based on assumptions including depreciation and amortization of approximately $101-103 million, capital expenditures of around $50 million, net interest expense of $34-36 million, and a normalized tax rate of 25%.
The company’s maintained guidance suggests confidence in its ability to continue delivering strong results throughout the year despite some market challenges.
The following chart outlines Enpro’s 2025 guidance:
Market Reaction and Company Profile
Enpro’s stock showed a positive reaction to the earnings results, with premarket trading indicating a 4.32% increase to $162.50. This follows a pattern similar to the previous quarter, where despite missing Q4 2024 EPS forecasts, the stock showed positive momentum.
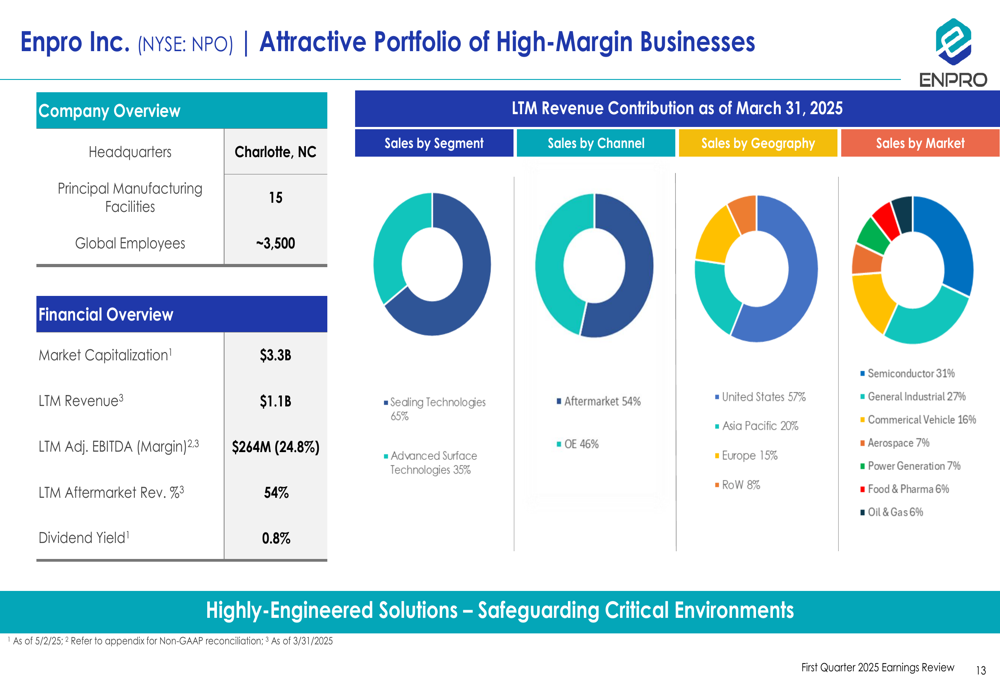
The company has a market capitalization of approximately $3.3 billion and employs around 3,500 people globally. Enpro operates 15 principal manufacturing facilities and generates approximately 54% of its revenue from aftermarket sales, providing a stable revenue stream.
The following overview highlights Enpro’s portfolio and market positioning:
The strong Q1 2025 results represent a significant improvement over the previous quarter, when Enpro missed both EPS and revenue forecasts. The current performance, coupled with reaffirmed guidance, suggests the company has successfully navigated recent challenges and is positioned for continued growth throughout 2025, particularly in its key industrial, aerospace, and food and pharma markets.
Full presentation:
This article was generated with the support of AI and reviewed by an editor. For more information see our T&C.