Interactive Brokers shares jump as it secures spot in S&P 500

Introduction & Market Context
First United Corporation (NASDAQ:FUNC) shares are trading higher in premarket activity, up 1.41% to $35.32, following the release of its Q1 2025 investor presentation. The Maryland-based bank, founded in 1900 and operating 22 branches across three core regions, has demonstrated strong performance metrics that outpace its regional banking peers.
The company’s stock has shown impressive momentum, trading within a 52-week range of $23.77 to $42.50, with the current price reflecting sustained investor confidence in the bank’s strategic direction and financial results.
Quarterly Performance Highlights
First United reported consolidated net income of $5.8 million for Q1 2025, representing a substantial 57% increase from $3.7 million in the same quarter last year. Diluted earnings per share reached $0.89, while return on average assets (ROAA) and return on average tangible common equity (ROATCE) stood at 1.19% and 13.70%, respectively.
As shown in the following financial highlights, the bank maintained a net interest margin of 3.56% while generating pre-provision net revenue of $8.4 million, compared to $6.4 million in Q1 2024:
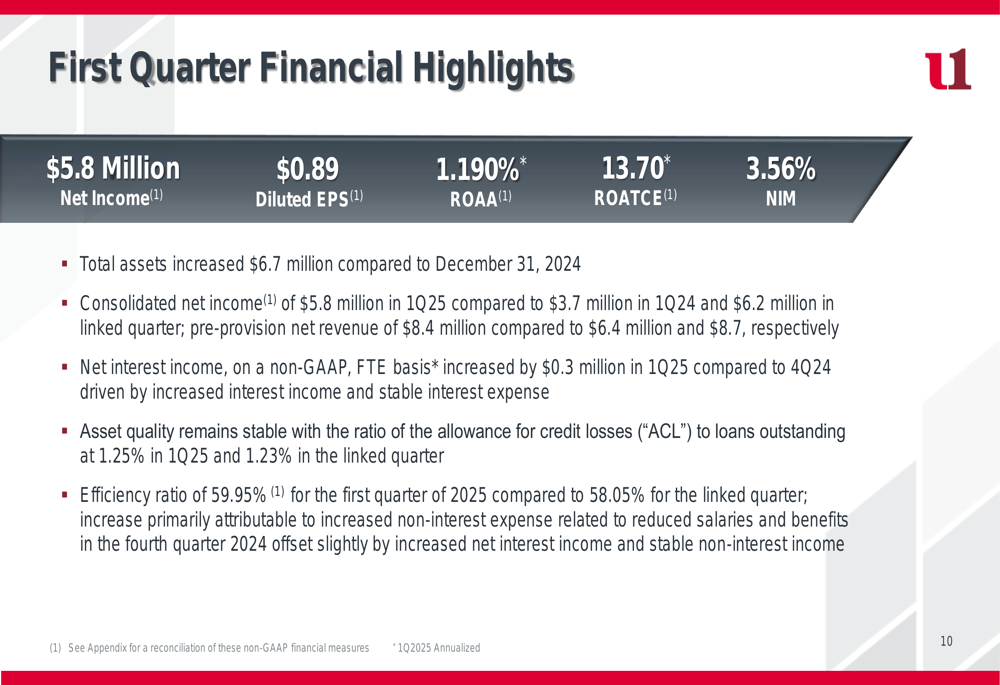
The efficiency ratio increased slightly to 59.95% in Q1 2025 from 58.05% in the linked quarter, primarily due to higher non-interest expenses related to salaries and benefits, partially offset by increased net interest income.
Total (EPA:TTEF) assets grew by $6.7 million compared to December 31, 2024, while the bank maintained strong asset quality with a stable allowance for credit losses (ACL) to loans ratio of 1.25%.
Long-Term Financial Trends
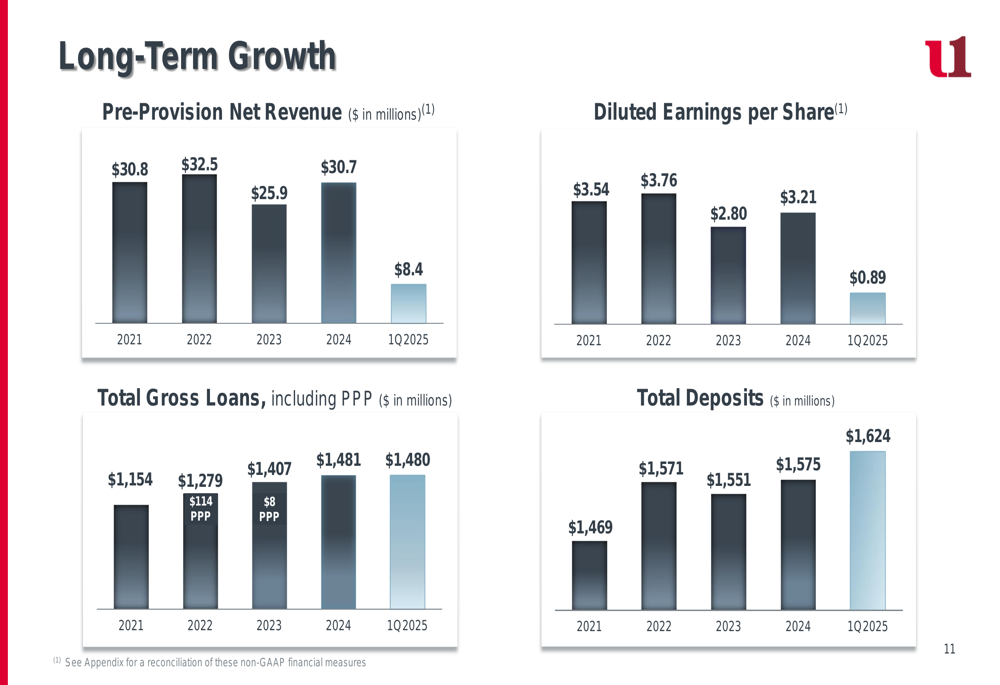
First United has demonstrated consistent growth across key financial metrics over recent years, with Q1 2025 results indicating continued positive momentum. The company’s pre-provision net revenue, diluted earnings per share, loan portfolio, and deposit base all show favorable long-term trends:
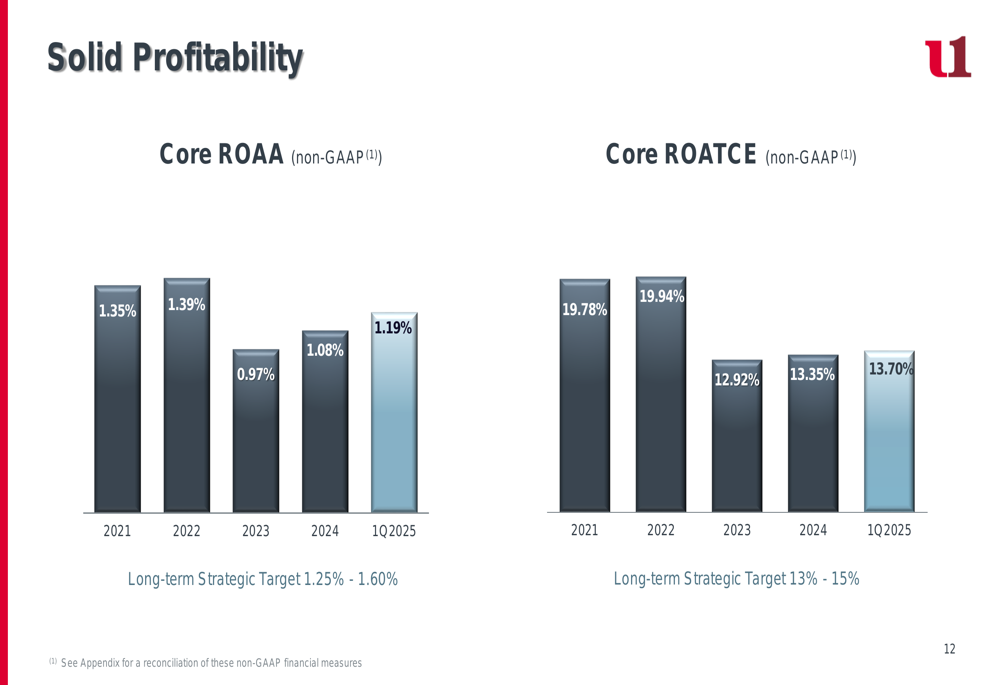
The bank’s profitability metrics have recovered from a dip in 2023, with Q1 2025 ROAA of 1.19% and ROATCE of 13.70% moving closer to the company’s long-term strategic targets of 1.25%-1.60% for ROAA and 13%-15% for ROATCE:
Strategic Positioning
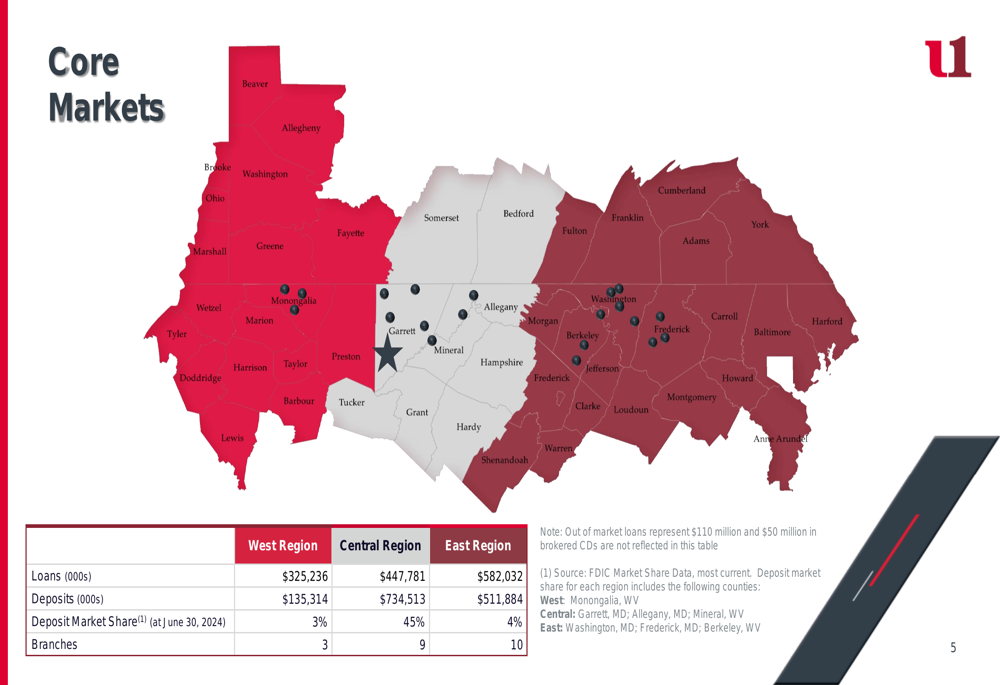
First United operates across three geographic regions—West, Central, and East—with its strongest market position in the Central region, where it commands a 45% deposit market share. The bank maintains 22 branches strategically distributed across these markets, with the majority in the Central and Eastern regions.
The following map illustrates the bank’s geographic footprint and market penetration:
A key strength of First United is its diversified loan portfolio, which helps mitigate concentration risk. Residential 1-4 family loans represent 35% of the total portfolio, followed by commercial real estate (non-owner occupied) at 21% and commercial and industrial loans at 19%:
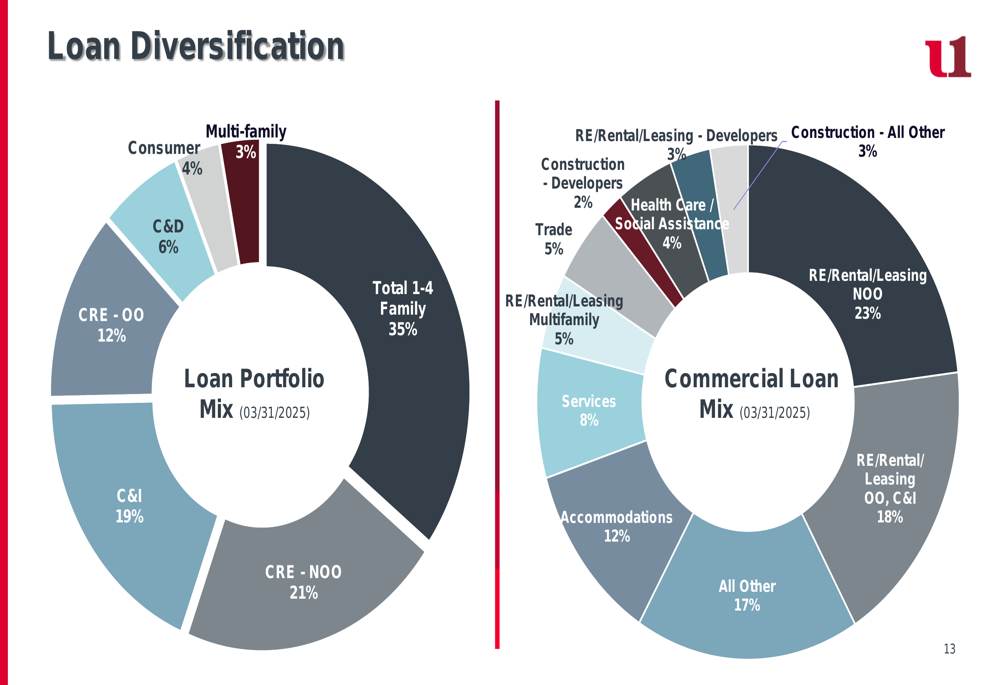
This diversification extends to the commercial loan segment, where real estate, rental, and leasing properties (both owner-occupied and non-owner occupied) constitute a significant portion, balanced with exposure to accommodations, services, healthcare, and other sectors.
Risk Management & Credit Quality
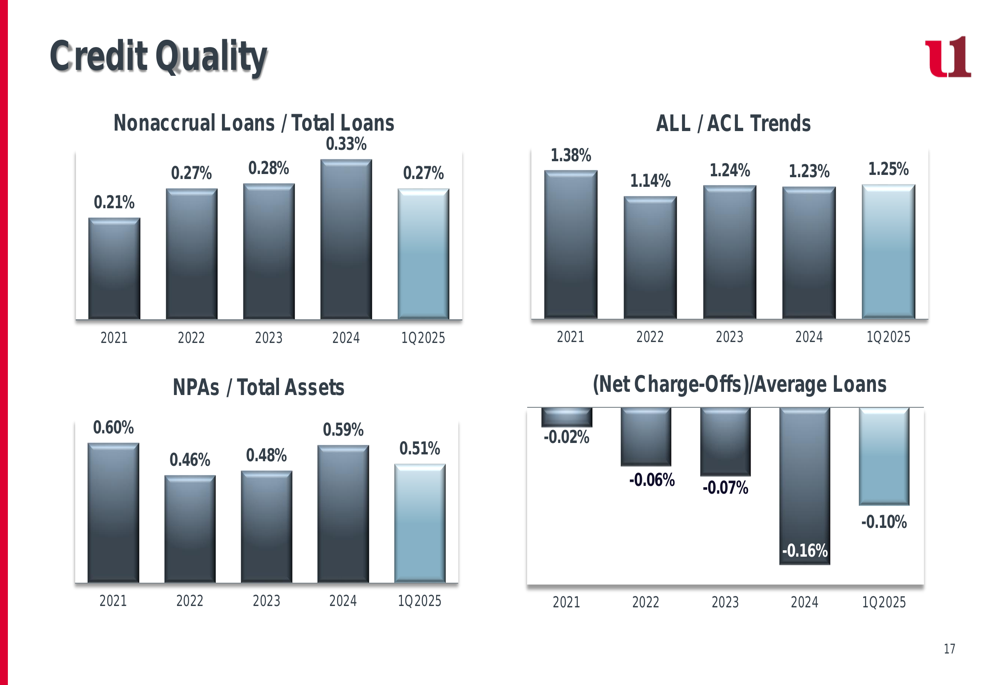
First United maintains strong credit quality metrics, with non-accrual loans representing just 0.27% of total loans in Q1 2025, down from 0.33% at year-end 2024. The allowance for credit losses stands at 1.25% of outstanding loans, providing adequate coverage for potential losses.
The bank’s credit quality trends over time demonstrate consistent risk management practices:
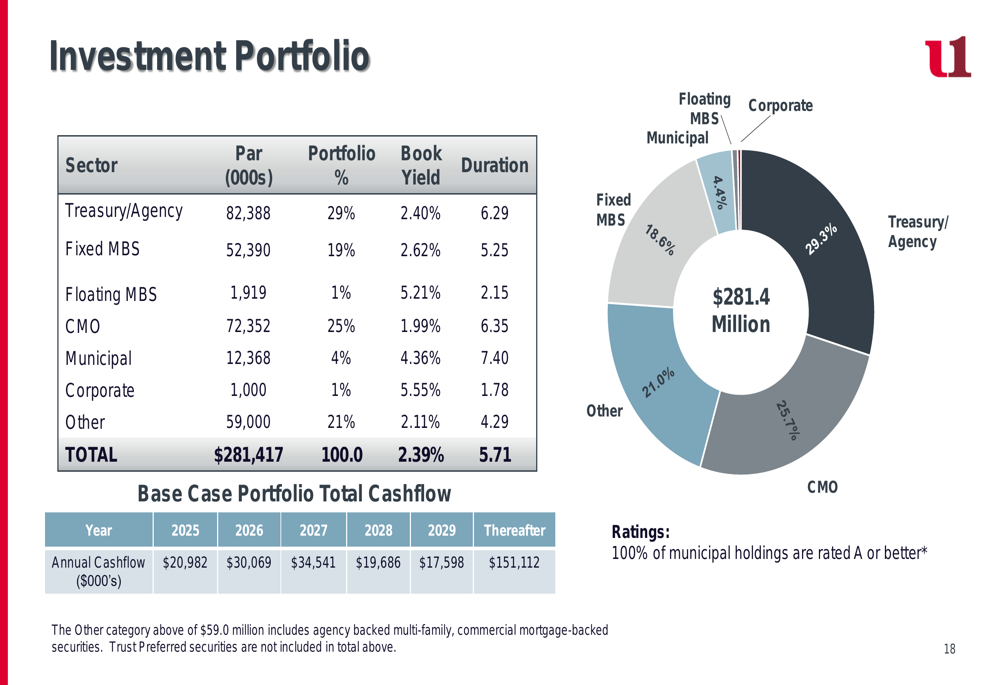
The company’s investment portfolio is predominantly comprised of Treasury/Agency securities (29%), CMOs (25%), and fixed MBS (19%), with a weighted average duration of 5.71 years and a book yield of 2.39%:
Competitive Performance & Shareholder Value
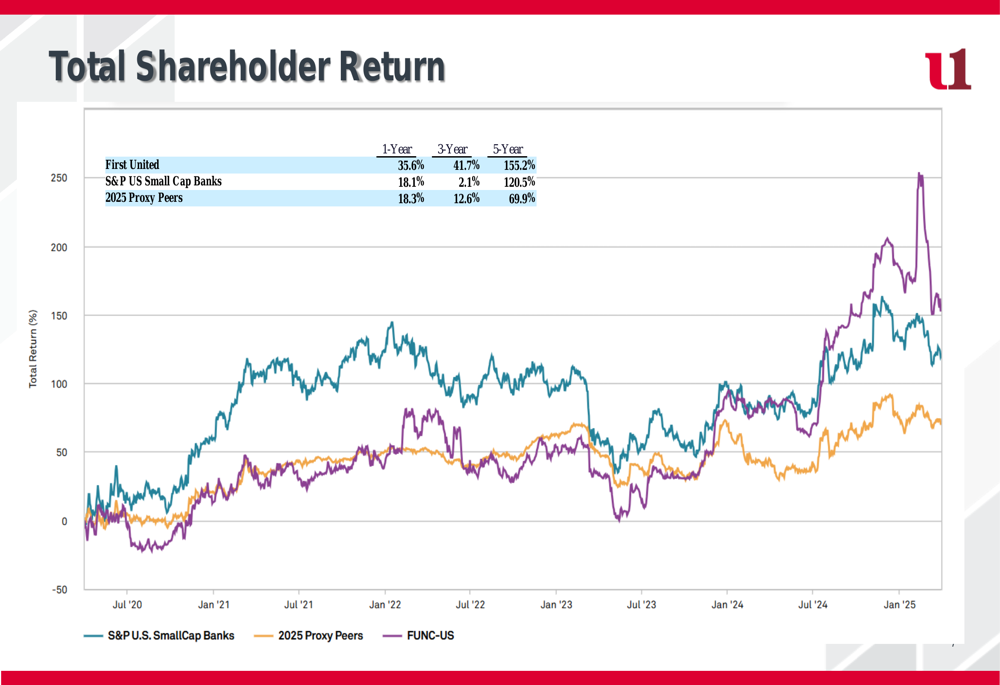
First United has consistently outperformed both the S&P U.S. SmallCap Banks index and its proxy peer group in terms of total shareholder return. Over a one-year period, the bank delivered a 35.6% return compared to 18.1% for the index and 18.3% for peers. This outperformance extends across three-year and five-year timeframes as well:
Strategic Initiatives
The bank’s forward strategy is built around three key pillars: Culture & Human Capital, Product & Service Revenue Diversification, and Resource Optimization. These strategic priorities are supported by effective use of technology, marketing, and environmental focus:
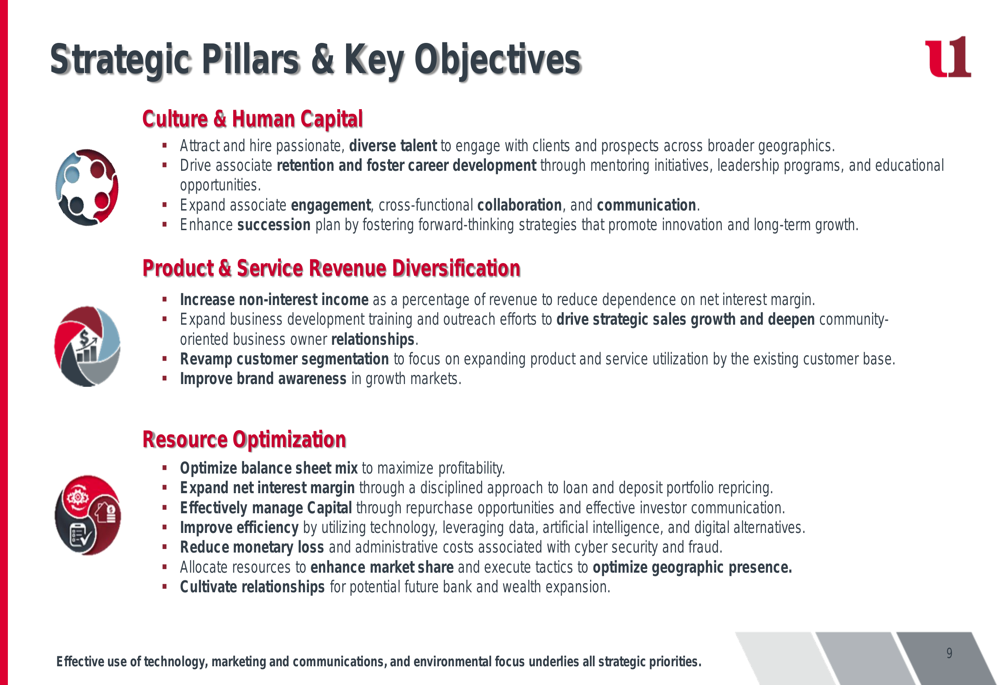
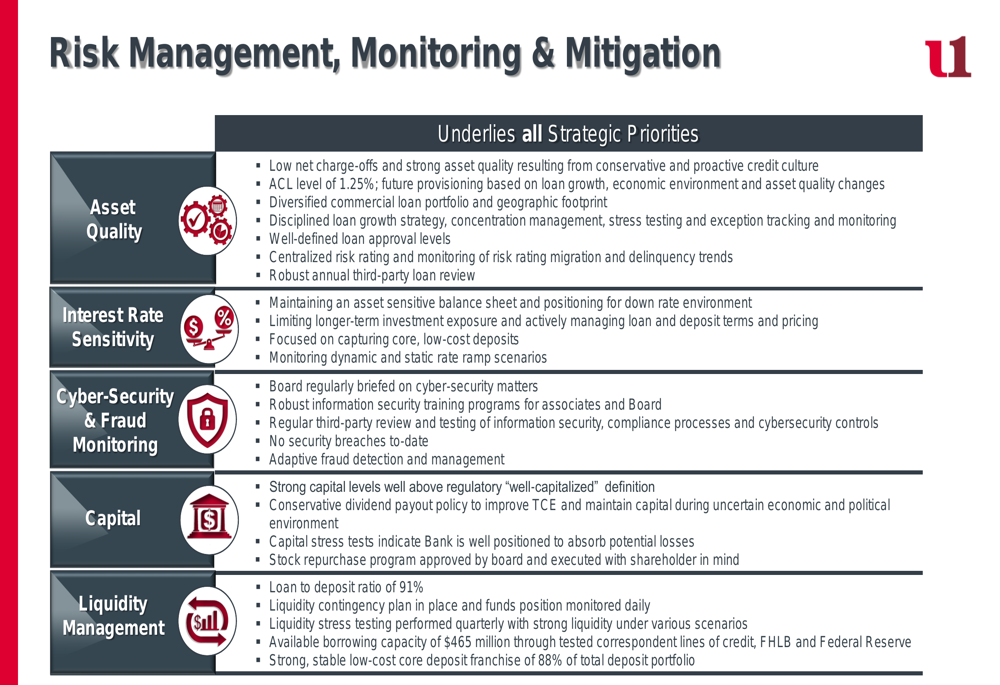
First United’s core strengths include its financial stability, diversified revenue streams, strong deposit franchise, and robust risk management framework. The bank maintains significant capital and liquidity buffers, with regulatory capital ratios well above requirements and available borrowing capacity of $465 million:
Forward Outlook
First United appears well-positioned for continued growth, with its diversified business model, strong market presence in core regions, and solid capital position. The bank’s asset-sensitive balance sheet should benefit from the current interest rate environment, while its focus on expense management and technology investments aims to drive further operational efficiencies.
The company’s strategic targets for ROAA (1.25%-1.60%) and ROATCE (13%-15%) provide clear benchmarks for measuring future performance, with Q1 2025 results already approaching these goals. With its balanced approach to growth and risk management, First United demonstrates a solid foundation for sustainable performance in the competitive regional banking landscape.
Full presentation:
This article was generated with the support of AI and reviewed by an editor. For more information see our T&C.