Interactive Brokers shares jump as it secures spot in S&P 500

Introduction & Market Context
F.N.B. Corporation (NYSE:FNB) released its second quarter 2025 earnings presentation on July 18, 2025, revealing strong financial performance with significant growth in key metrics. The company reported net income available to common shareholders of $130.7 million, up 12.1% from the previous quarter, with earnings per diluted share of $0.36 compared to $0.32 in Q1 2025.
Following the announcement, F.N.B.’s stock closed at $15.87, up 2.32% for the day, continuing the positive momentum seen after the company’s Q1 results when shares rose 3.92%. The stock is currently trading well above its 52-week low of $10.88, though still below its 52-week high of $17.70.
Quarterly Performance Highlights
F.N.B. reported impressive growth across multiple financial metrics in Q2 2025. Revenue increased 6.5% quarter-over-quarter to $438.2 million, driven by record levels of both net interest income and non-interest income. Pre-provision net revenue totaled $192.0 million, representing a substantial 16.5% increase from the prior quarter.
As shown in the following comprehensive overview of the quarter’s performance:
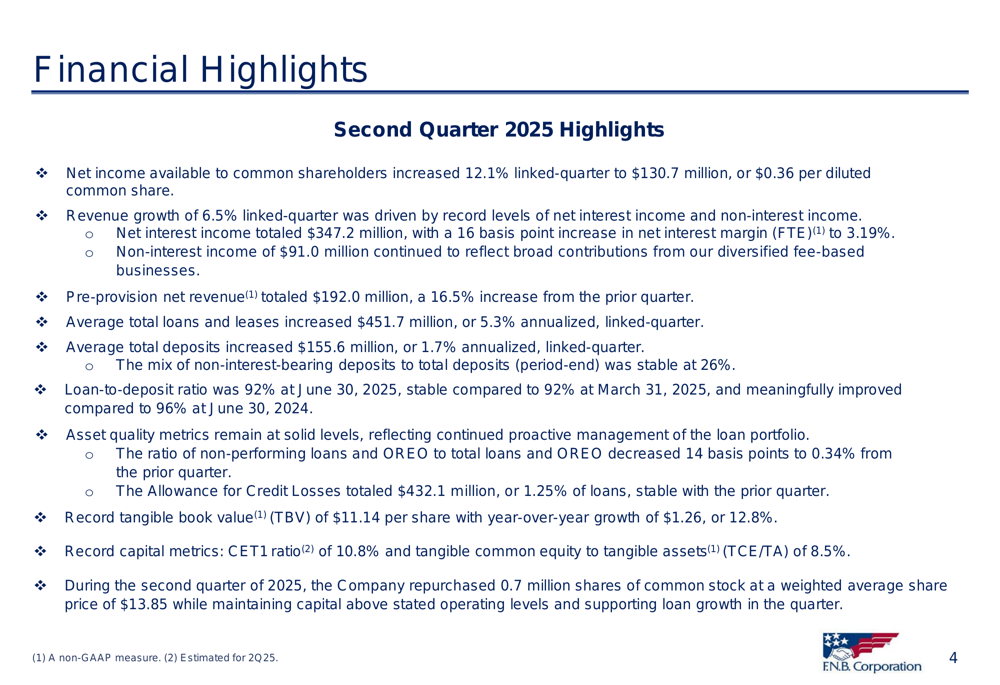
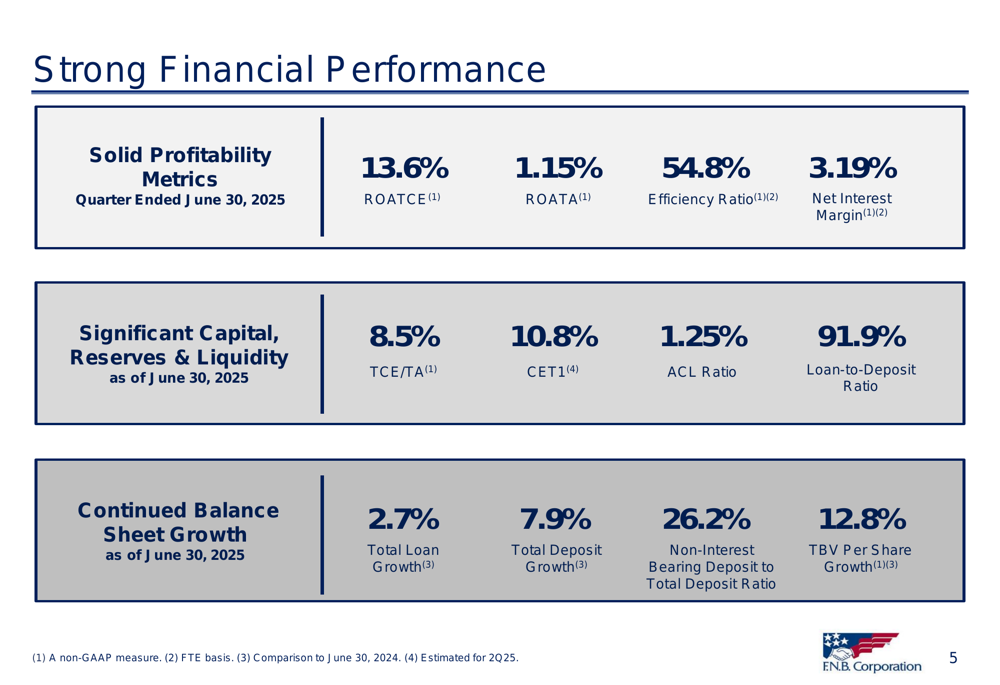
The company’s net interest margin (FTE) improved by 16 basis points to 3.19%, while the efficiency ratio decreased to 54.8% from 58.5% in the previous quarter, demonstrating enhanced operational efficiency. These improvements contributed to the company’s strong profitability metrics, with return on average tangible common equity (ROATCE) reaching 13.6%.
F.N.B.’s key performance metrics illustrate the company’s solid financial position:
Detailed Financial Analysis
F.N.B.’s balance sheet showed continued growth, with average total loans and leases increasing $451.7 million (5.3% annualized) quarter-over-quarter. Average total deposits grew by $155.6 million (1.7% annualized) during the same period. The loan-to-deposit ratio remained stable at 92%, a meaningful improvement from 96% a year earlier.
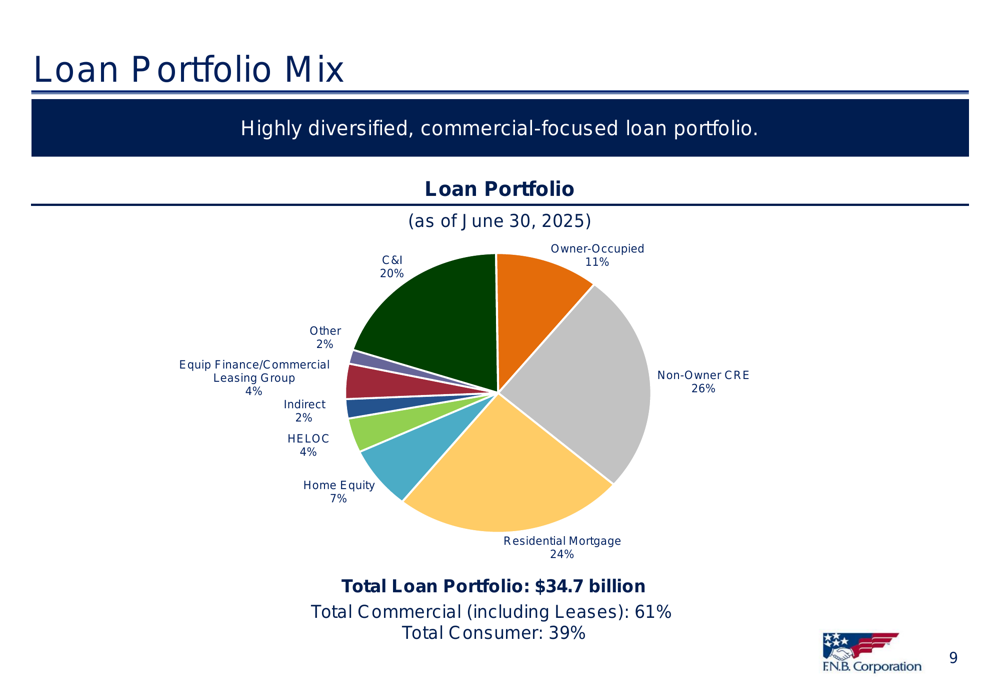
The company’s loan portfolio maintains a balanced mix between commercial (61%) and consumer (39%) segments, providing diversification and stability:
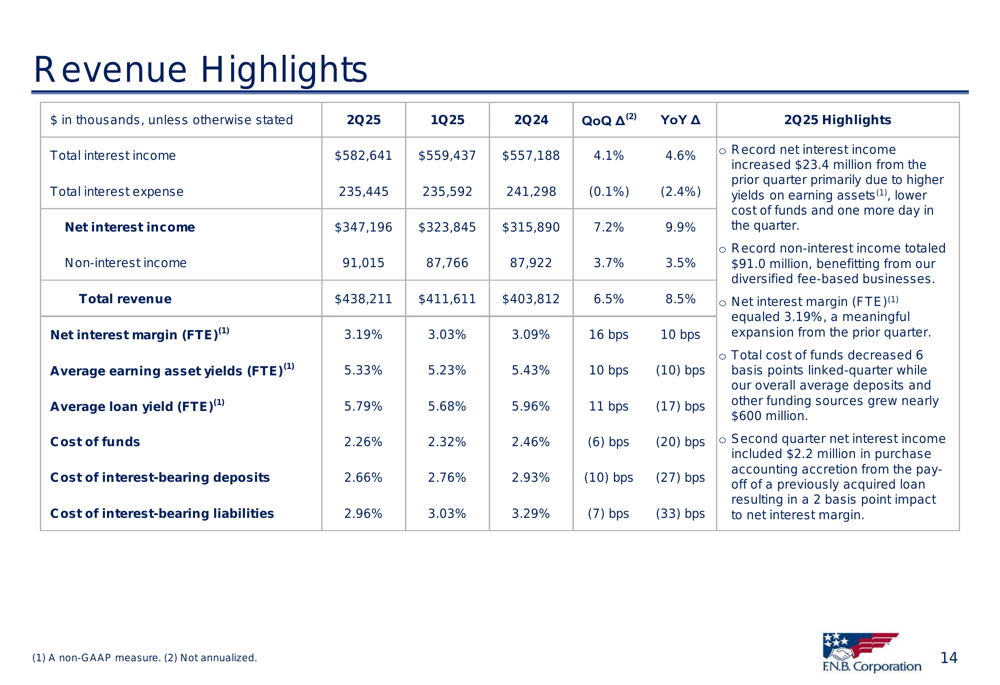
Revenue performance was particularly strong, with total interest income increasing 4.1% quarter-over-quarter to $582.6 million, while interest expense remained essentially flat. This resulted in net interest income of $347.2 million, up 7.2% from the previous quarter. Non-interest income also showed solid growth of 3.7% to $91.0 million.
The following table details the company’s revenue performance:
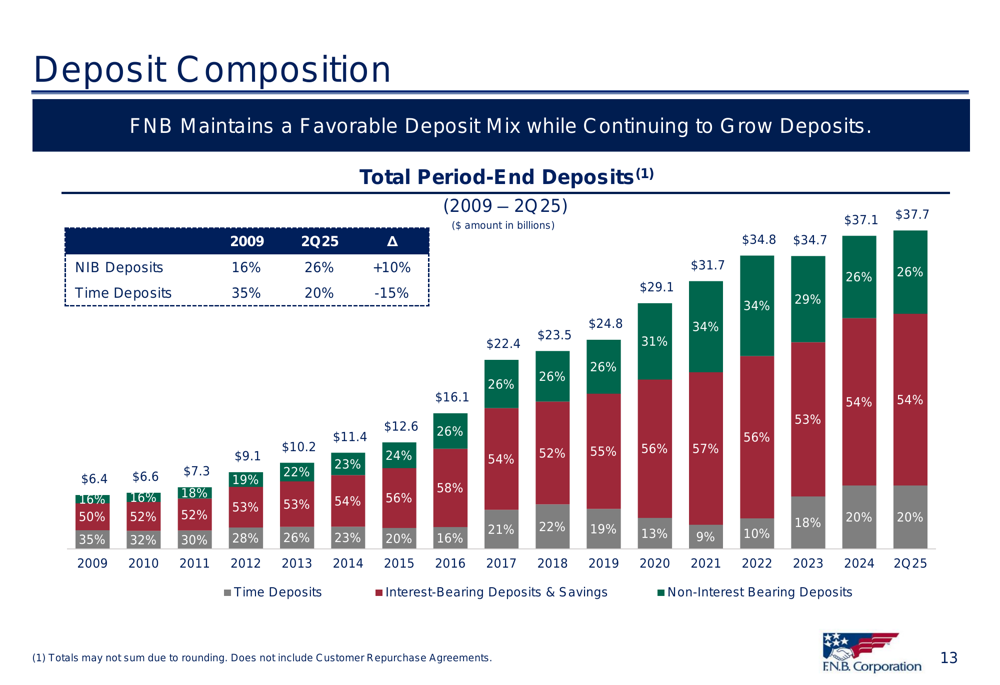
F.N.B.’s deposit composition has continued to improve over time, with non-interest-bearing deposits now representing 26% of total deposits, up from 16% in 2009:
Asset Quality & Capital Position
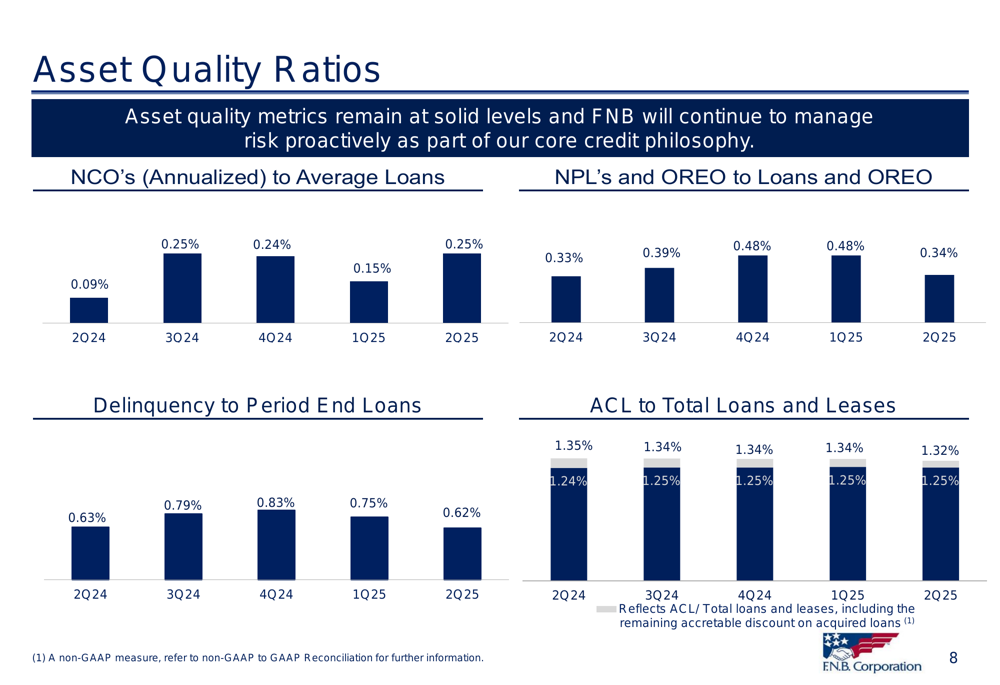
Asset quality metrics remained strong in Q2 2025, with the ratio of non-performing loans and OREO to total loans and OREO decreasing 14 basis points to 0.34%. The Allowance for Credit Losses totaled $432.1 million, or 1.25% of loans, stable compared to the previous quarter.
The following chart illustrates the company’s asset quality trends over the past five quarters:
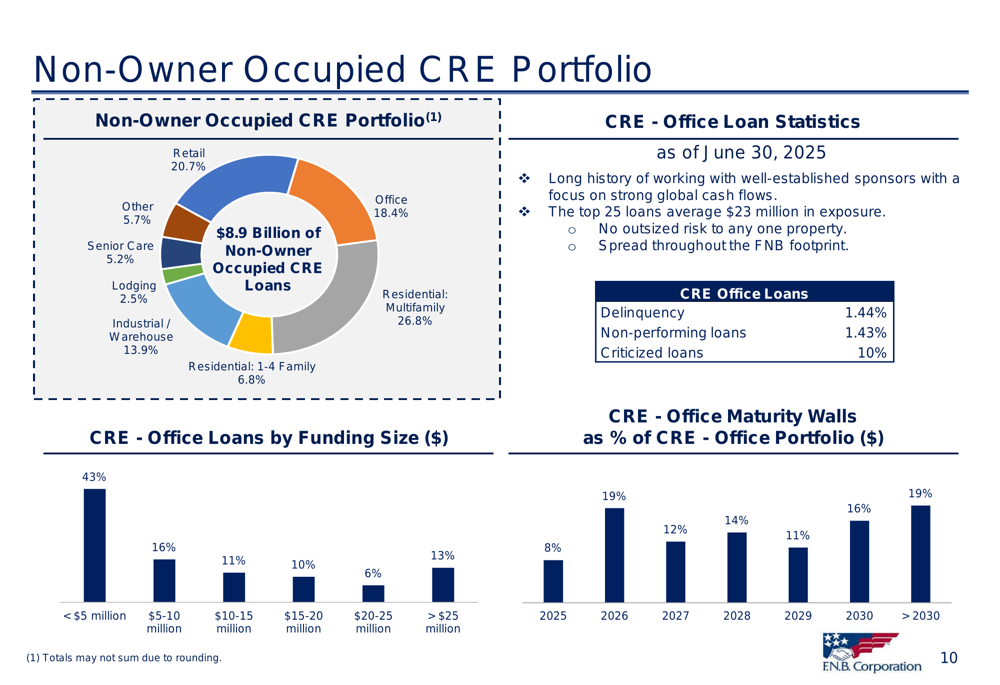
F.N.B. has maintained a proactive approach to managing its Non-Owner Occupied Commercial Real Estate (NOO-CRE) portfolio, which represents 26% of the total loan portfolio. The company provided a detailed breakdown of this segment:
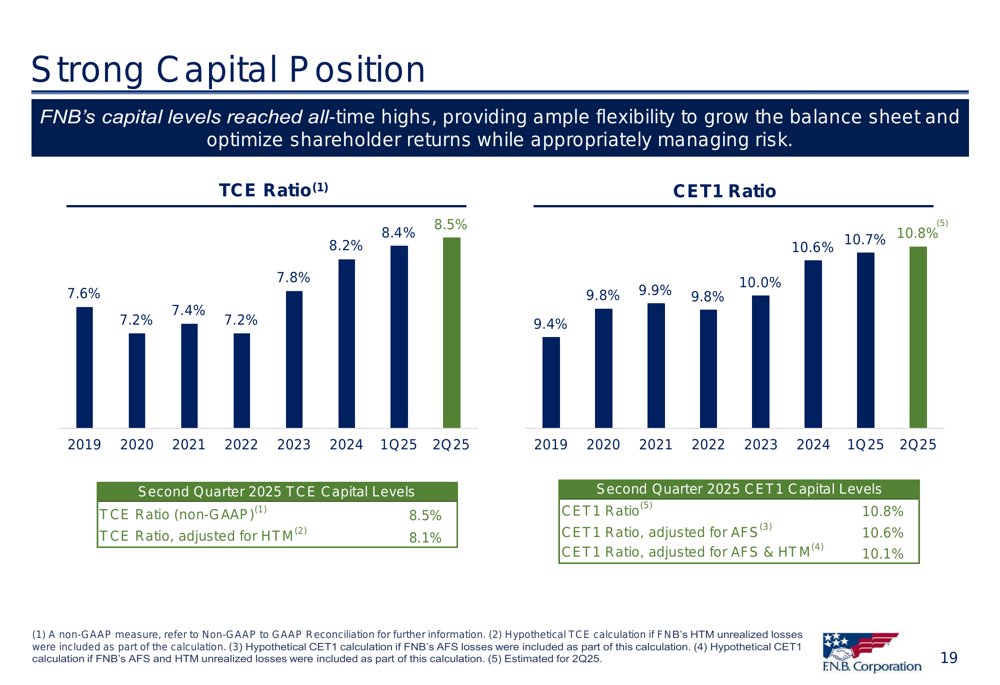
Capital levels reached record highs in Q2 2025, with the CET1 ratio increasing to 10.8% and the tangible common equity to tangible assets ratio improving to 8.5%. These strong capital metrics provide the company with flexibility for continued growth and shareholder returns.
The following chart shows F.N.B.’s improving capital position over time:
During the quarter, the company repurchased 0.7 million shares of common stock at a weighted average price of $13.85, demonstrating its commitment to returning capital to shareholders while maintaining strong capital levels.
Forward-Looking Statements
Looking ahead, F.N.B. provided guidance for the third quarter and full year 2025. The company expects continued loan and deposit growth in the mid-single digit range, with net interest income projected between $345-355 million for Q3 and $1.37-1.39 billion for the full year.
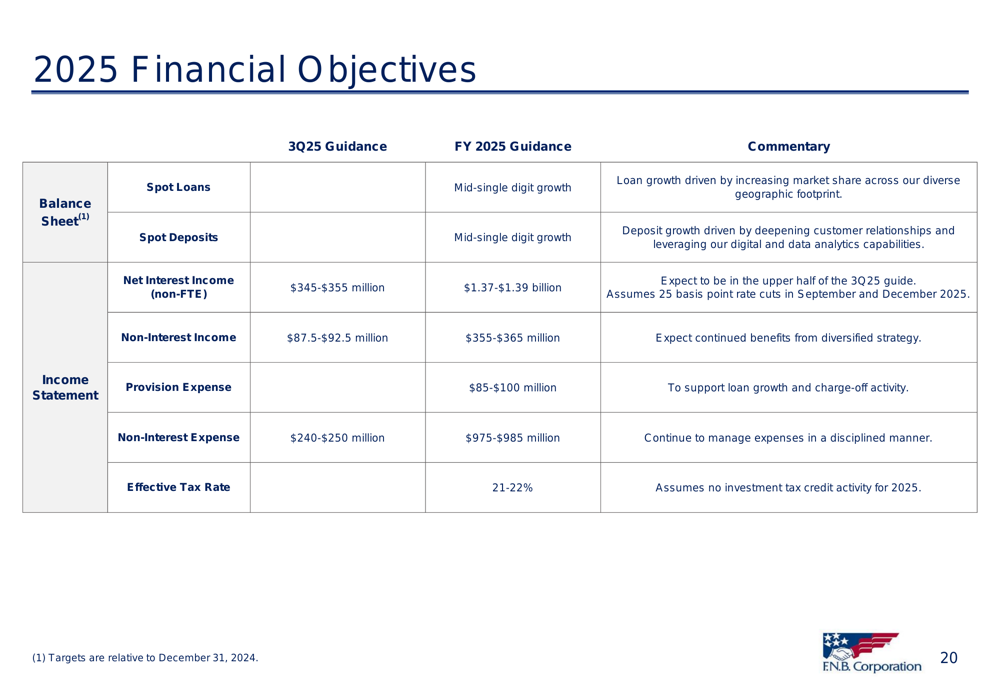
Management anticipates continued benefits from its diversified fee income strategy, with non-interest income projected at $87.5-92.5 million for Q3 and $355-365 million for the full year. The company’s provision expense is expected to be between $85-100 million for the full year, supporting loan growth and charge-off activity.
F.N.B.’s guidance assumes 25 basis point interest rate cuts in both September and December 2025, reflecting the company’s preparation for a changing rate environment. Management emphasized its commitment to disciplined expense management, with non-interest expense projected at $240-250 million for Q3 and $975-985 million for the full year.
Conclusion
F.N.B. Corporation’s Q2 2025 results demonstrate strong financial performance across multiple metrics, with significant growth in net income, revenue, and earnings per share. The company’s solid asset quality, record capital levels, and balanced loan portfolio position it well for continued growth in the remainder of 2025.
The company’s ability to grow both loans and deposits while maintaining a favorable deposit mix and improving efficiency reflects effective execution of its strategic initiatives. With clear guidance for the remainder of the year and a strong capital position, F.N.B. appears well-positioned to navigate the anticipated changes in the interest rate environment while continuing to deliver value to shareholders.
Full presentation:
This article was generated with the support of AI and reviewed by an editor. For more information see our T&C.