S&P 500 rises as health care, tech gain to overshadow Fed independence concerns

Introduction & Market Context
F.N.B. Corporation (NYSE:FNB) released its first quarter 2025 earnings presentation on April 17, 2025, showcasing stable financial performance and continued balance sheet growth. The regional bank reported net income available to common shareholders of $116.5 million, or $0.32 per diluted common share, maintaining its earnings momentum from the previous quarter while strengthening its capital position.
The results come as the banking sector navigates a changing interest rate environment, with expectations of potential rate cuts later in the year. FNB’s presentation highlighted its strategic positioning to manage through these changes while continuing to grow its loan portfolio and deposit base.
Quarterly Performance Highlights
FNB reported solid profitability metrics for Q1 2025, with return on average tangible common equity (ROATCE) at 12.6% and return on average tangible assets (ROATA) at 1.06%. The company maintained an efficiency ratio of 58.5%, slightly higher than the 56.0% reported in Q1 2024, while net interest margin stood at 3.03%, down from 3.18% in the same period last year.
As shown in the following chart of key financial performance metrics, FNB has maintained strong profitability while building capital and liquidity:
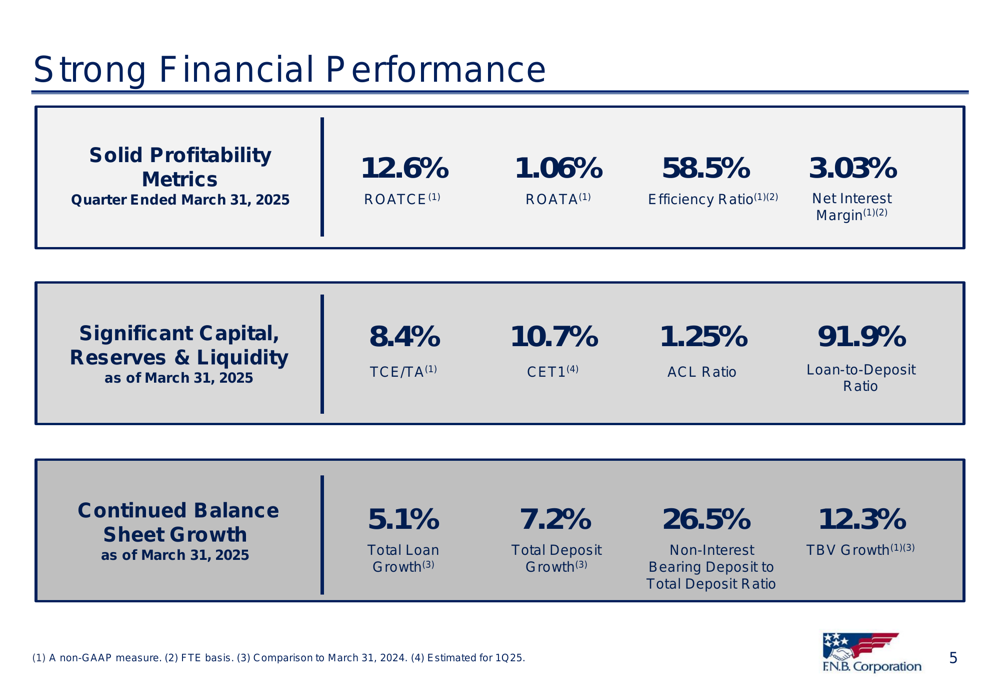
Total (EPA:TTEF) revenue for the quarter reached $411.6 million, with net interest income of $323.8 million and non-interest income of $87.8 million. The company’s provision for credit losses was $17.5 million, up from $13.9 million in Q1 2024 but down from $22.3 million in Q4 2024, reflecting stable credit conditions.
Balance Sheet and Credit Quality
FNB’s balance sheet continued to show growth, with total loans and leases increasing by $296.4 million (3.5% annualized) during the quarter. Consumer loans grew by $224.3 million, while commercial loans and leases increased by $72.1 million. Total deposits rose by $131.7 million (1.4% annualized), with non-interest-bearing deposits remaining stable at 26% of total deposits.
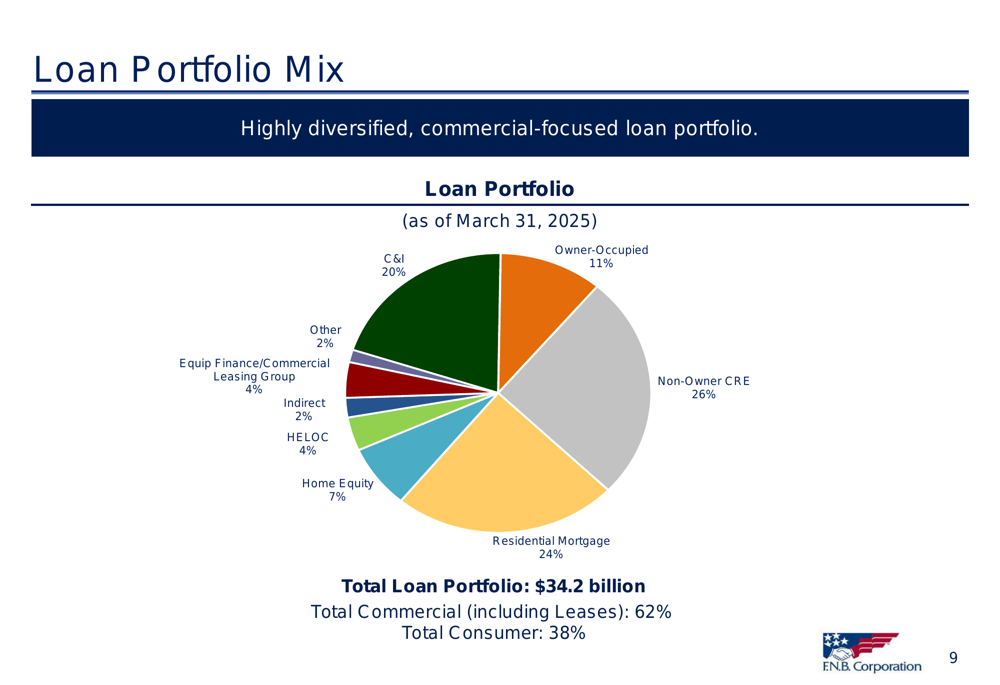
The company’s loan portfolio maintains a balanced mix between commercial and consumer lending, as illustrated in the following breakdown:
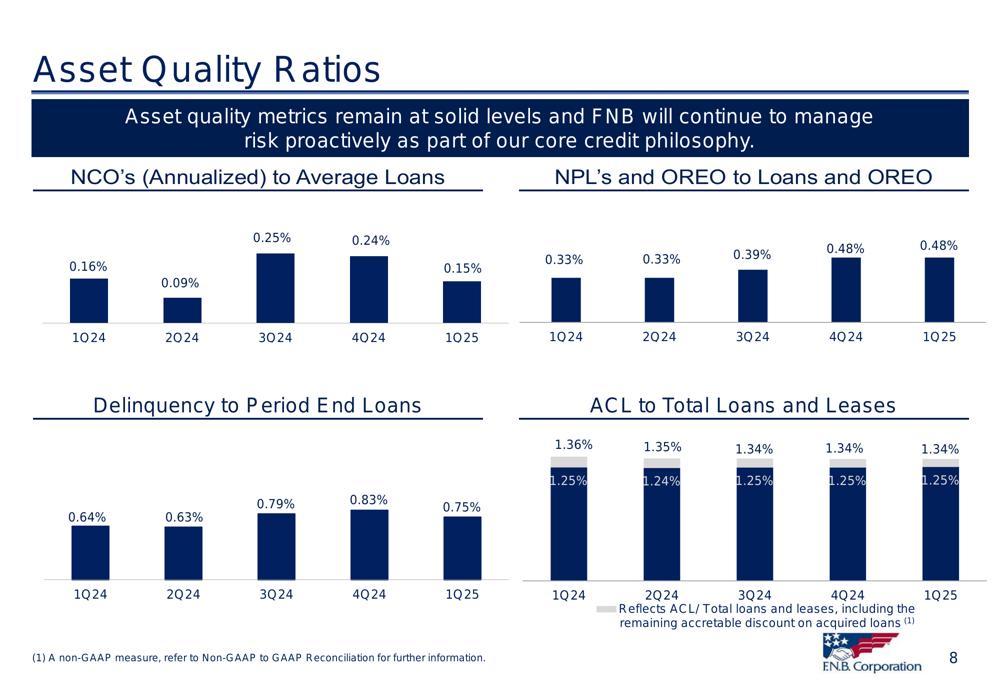
Credit quality metrics remained solid, with net charge-offs of $12.5 million (0.15% annualized), down from $20.6 million (0.24%) in the previous quarter. The allowance for credit losses stood at 1.25% of total loans and leases, unchanged from the previous quarter. Non-performing loans plus OREO to total loans and leases plus OREO remained stable at 0.48%.
The following chart shows the trend in asset quality ratios over the past five quarters:
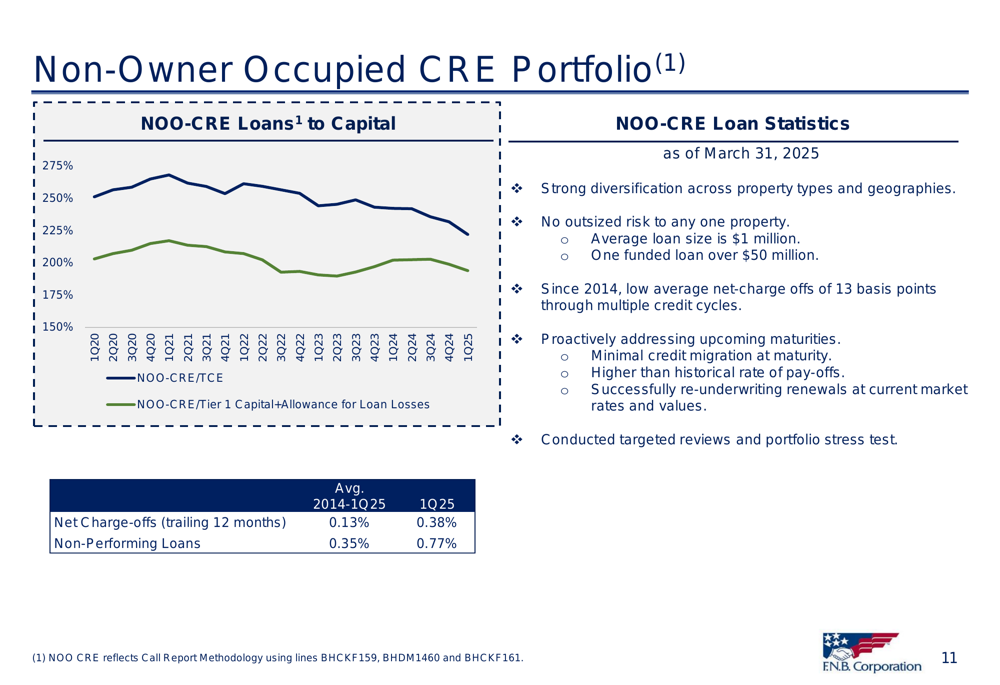
FNB has maintained a particular focus on its non-owner occupied commercial real estate (CRE) portfolio, which represents 26% of total loans. The company highlighted its proactive management approach to this segment, noting strong diversification across property types and geographies.
The following slide details the performance of the non-owner occupied CRE portfolio:
Revenue and Fee Income Diversification
A key strategic focus for FNB has been diversifying its fee income streams. The company reported that it has established or significantly expanded eight business lines that are now multi-million-dollar revenue generators, leading to a 9% 10-year compounded annual growth rate for non-interest income.
The following chart illustrates FNB’s success in growing and diversifying its fee income sources:
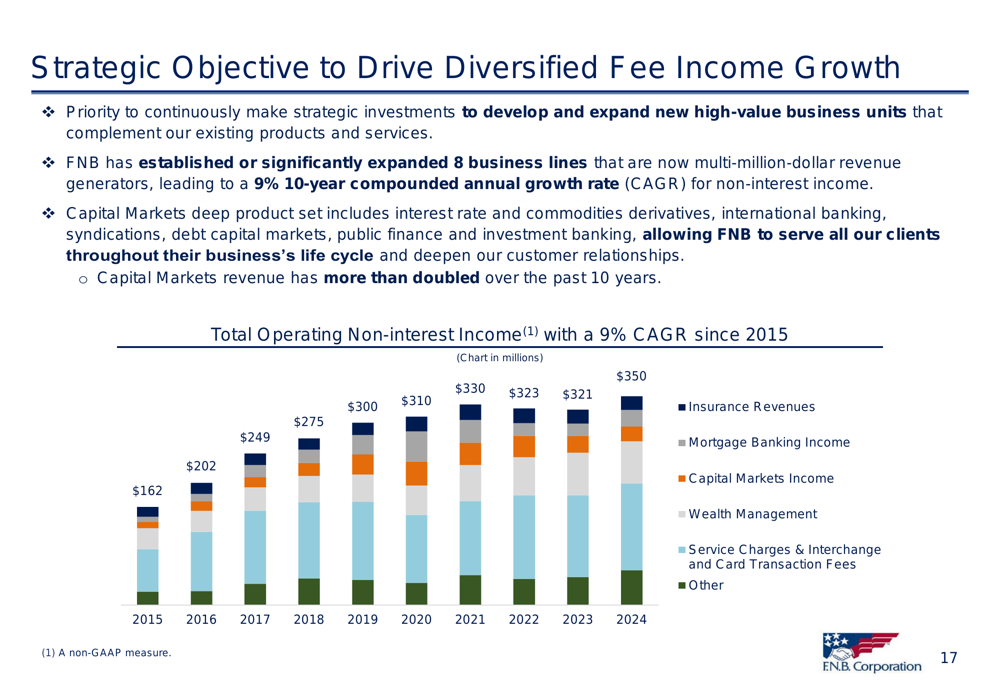
For Q1 2025, wealth management revenues reached a record $21.2 million, while insurance commissions and fees increased $1.3 million compared to the previous quarter. The company also noted that capital markets income declined quarter-over-quarter, while service charges showed a year-over-year increase of $1.8 million.
Capital Position and Shareholder Returns
FNB’s capital levels reached all-time highs during the quarter, with the tangible common equity (TCE) ratio at 8.4% and the Common Equity Tier 1 (CET1) ratio at 10.7%. The company’s tangible book value per share grew to a record $10.83, representing a 12.3% increase compared to Q1 2024.
The following chart shows the steady improvement in FNB’s capital ratios over recent years:
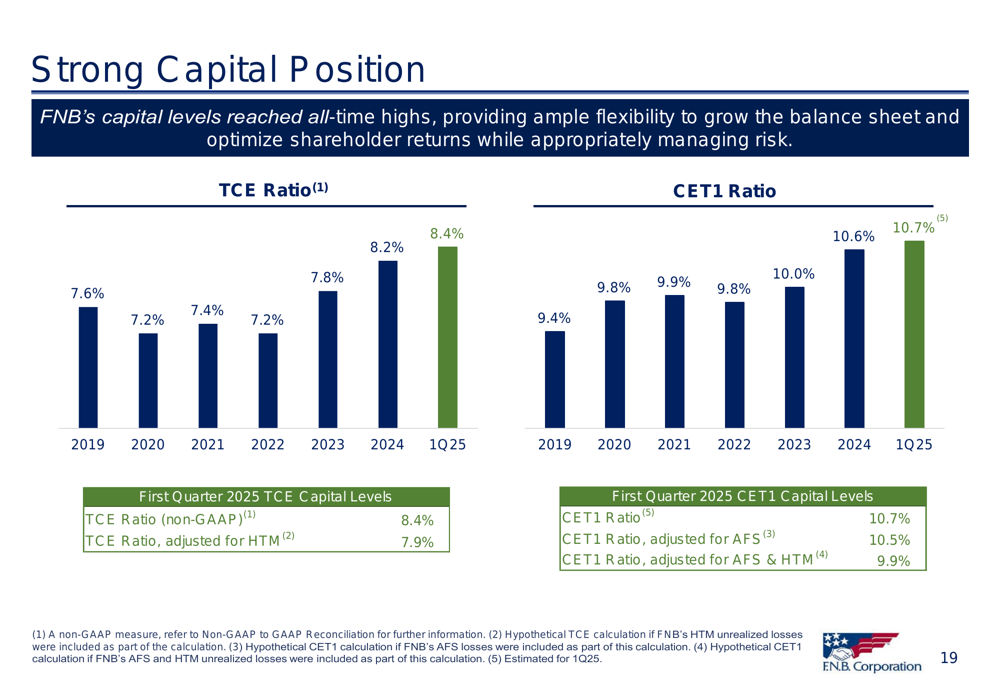
During the quarter, FNB repurchased 0.7 million shares of common stock at a weighted average price of $13.48, demonstrating its commitment to returning capital to shareholders while maintaining strong capital levels.
Balance Sheet Positioning and Interest Rate Management
With expectations of potential interest rate cuts later in 2025, FNB highlighted its balance sheet positioning to manage through the changing rate environment. Approximately 47% of the company’s loans reprice within three months, providing flexibility as rates change.
The company’s deposit strategy and balance sheet positioning are illustrated in the following slide:
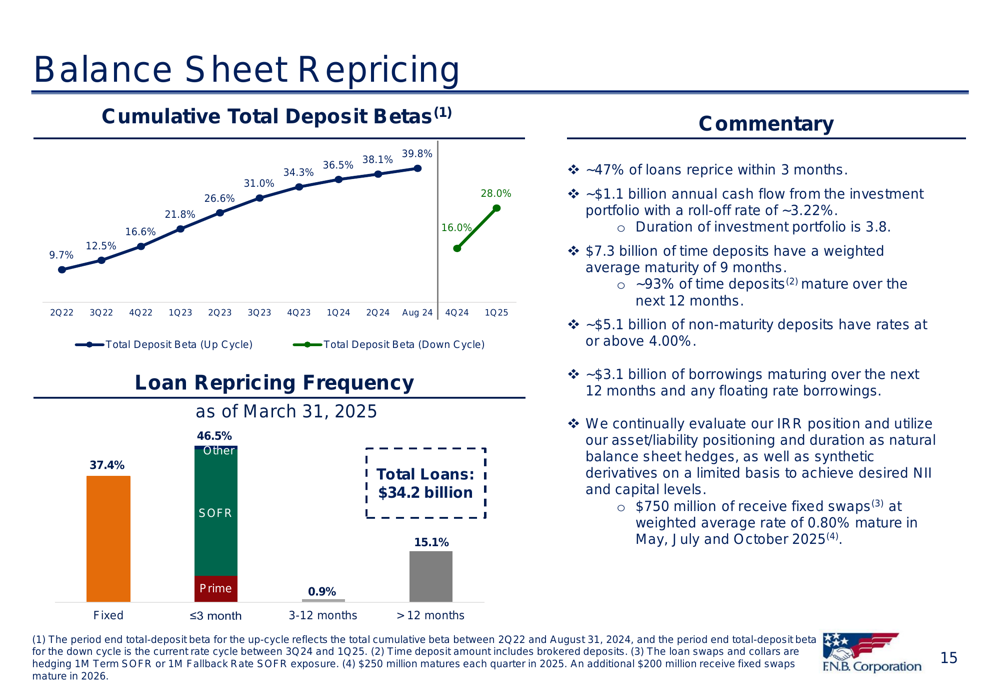
FNB noted that $7.3 billion of time deposits have a weighted average maturity of 9 months, while $5.1 billion of non-maturity deposits have rates at or above 4.00%. Additionally, $750 million of receive-fixed swaps at a weighted average rate of 0.80% are set to mature in May, July, and October 2025.
Forward Guidance and Outlook
Looking ahead, FNB provided financial objectives for Q2 2025 and the full year. The company expects mid-single digit growth in both loans and deposits for 2025. Net interest income is projected to be between $325-335 million for Q2 and $1.345-1.385 billion for the full year, assuming 25 basis point rate cuts in both June and September.
The company’s detailed financial objectives are outlined in this guidance slide:
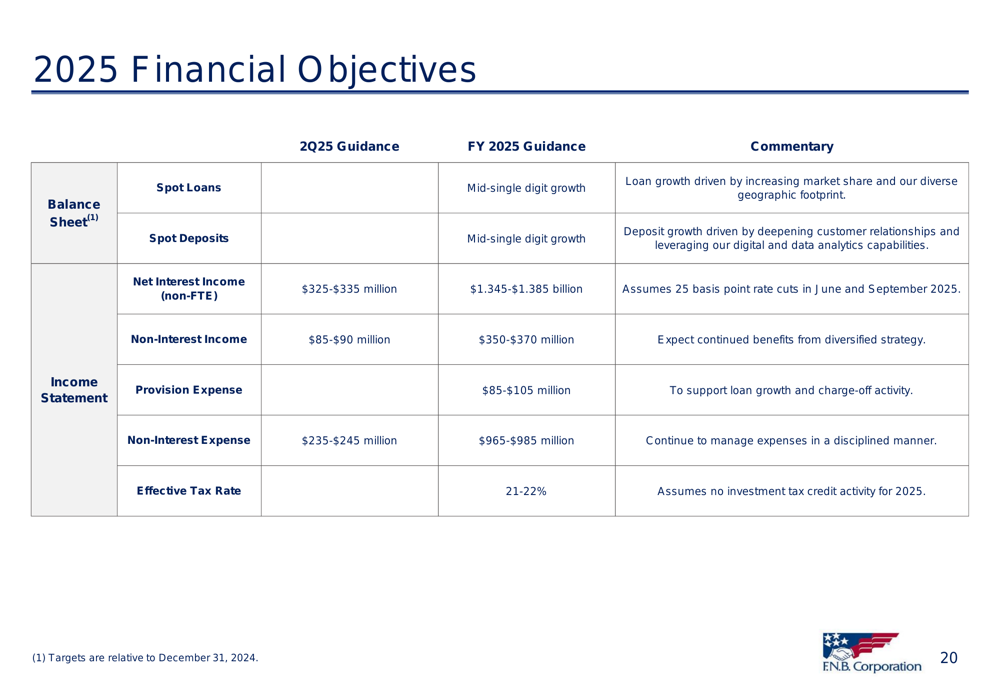
Non-interest income is expected to be $85-90 million in Q2 and $350-370 million for the full year, reflecting continued benefits from FNB’s diversified fee income strategy. The provision expense for the full year is projected at $85-105 million to support loan growth and charge-off activity.
FNB’s management emphasized their continued focus on disciplined expense management, with non-interest expense projected at $235-245 million for Q2 and $965-985 million for the full year.
Overall, FNB’s Q1 2025 presentation portrays a bank with stable earnings, strong capital and liquidity positions, and a strategic focus on diversified growth while maintaining conservative risk management practices. The company appears well-positioned to navigate the anticipated changes in the interest rate environment while continuing to grow its balance sheet and fee income streams.
Full presentation:
This article was generated with the support of AI and reviewed by an editor. For more information see our T&C.