Raymond James raises Fulgent Genetics stock price target to $36 on strong performance

Graco Inc. (NYSE:GGG) reported its second-quarter 2025 financial results on July 24, showing a 3% year-over-year increase in sales primarily driven by acquisitions, while organic growth faced headwinds across several segments and regions.
Executive Summary
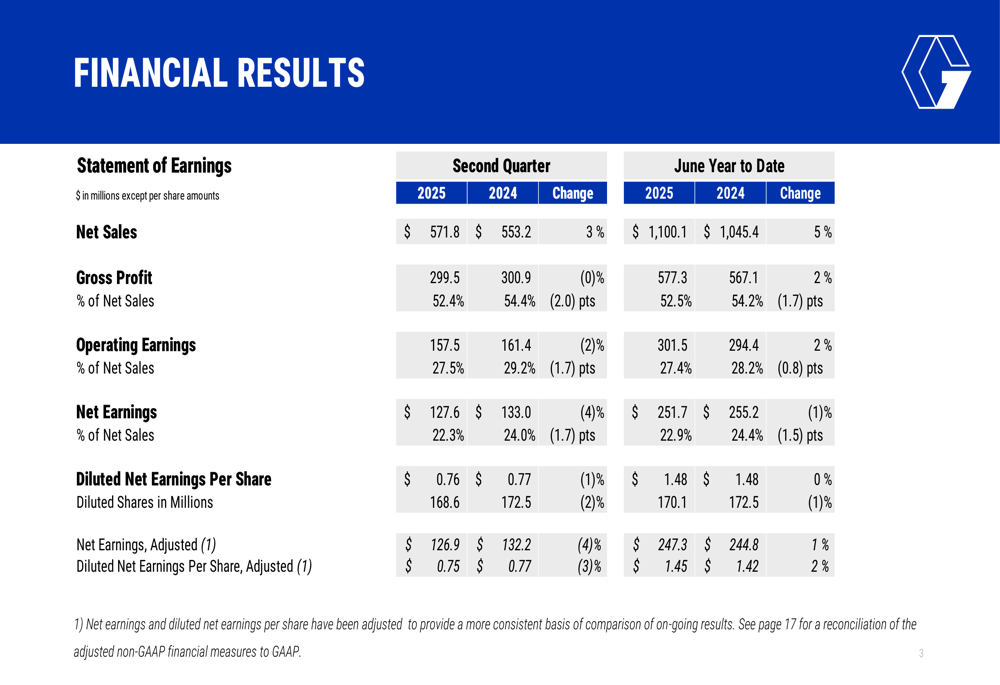
The manufacturer of fluid-handling equipment posted Q2 2025 net sales of $571.8 million, up 3% from $553.2 million in the same period last year. Acquisitions contributed 6 percentage points to this growth, effectively masking underlying organic sales challenges. Net earnings decreased 4% to $127.6 million, with diluted earnings per share of $0.76, down 1% from $0.77 in Q2 2024.
"Acquisitions continue to be a key growth driver for Graco in the second quarter, contributing 6 percentage points to our overall sales growth," the company noted in its presentation. "However, we’re seeing pressure on gross margins due to higher product costs and the impact of acquired operations."
As shown in the comprehensive financial results table below, the company’s year-to-date performance showed similar patterns, with 5% sales growth but a 1% decline in net earnings:
Quarterly Performance Highlights
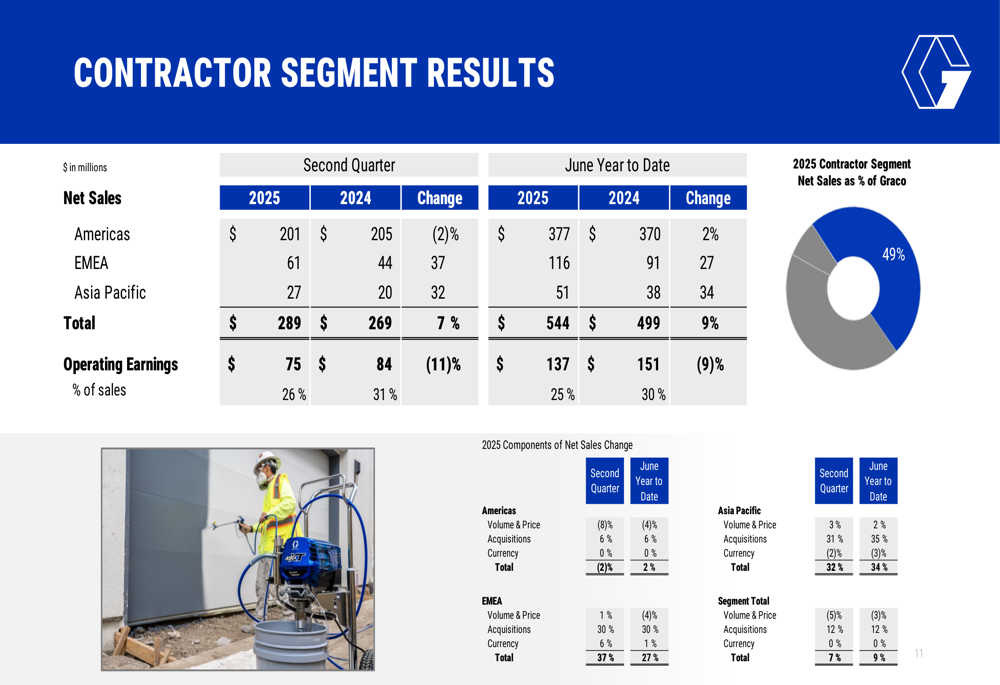
Graco’s performance varied significantly across its three business segments. The Contractor segment, which represents 49% of total sales, saw a 7% increase in revenue to $289 million, but an 11% decrease in operating earnings to $75 million, with margins declining from 31% to 26%.
The detailed breakdown of the Contractor segment reveals the significant impact of acquisitions on sales growth:
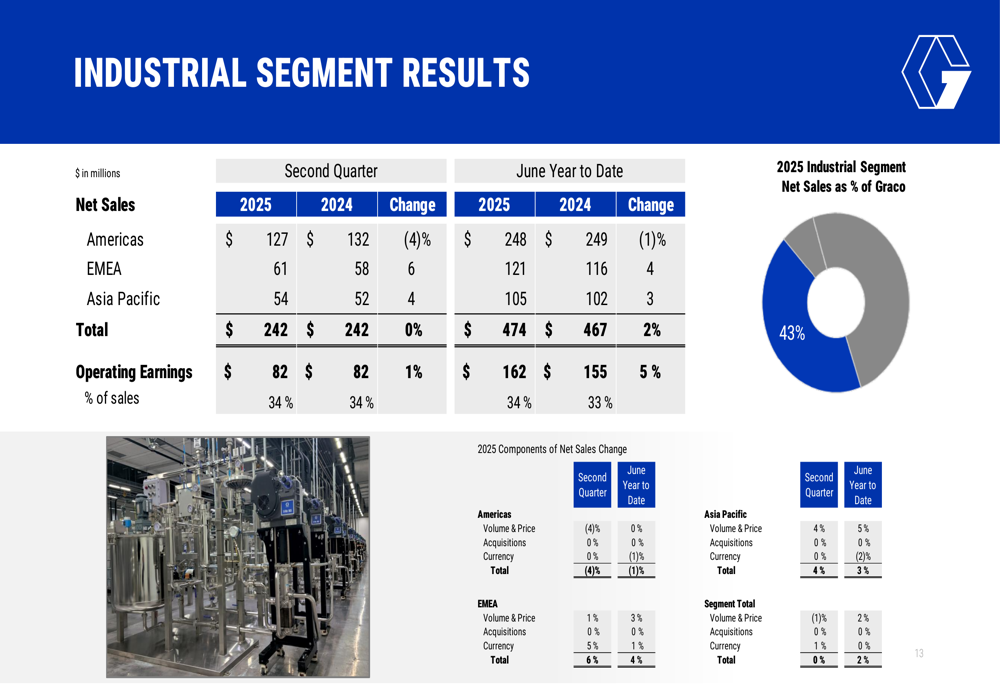
The Industrial segment, accounting for 43% of total sales, reported flat revenue at $242 million year-over-year, while operating earnings increased slightly by 1% to $82 million, maintaining a strong 34% operating margin.
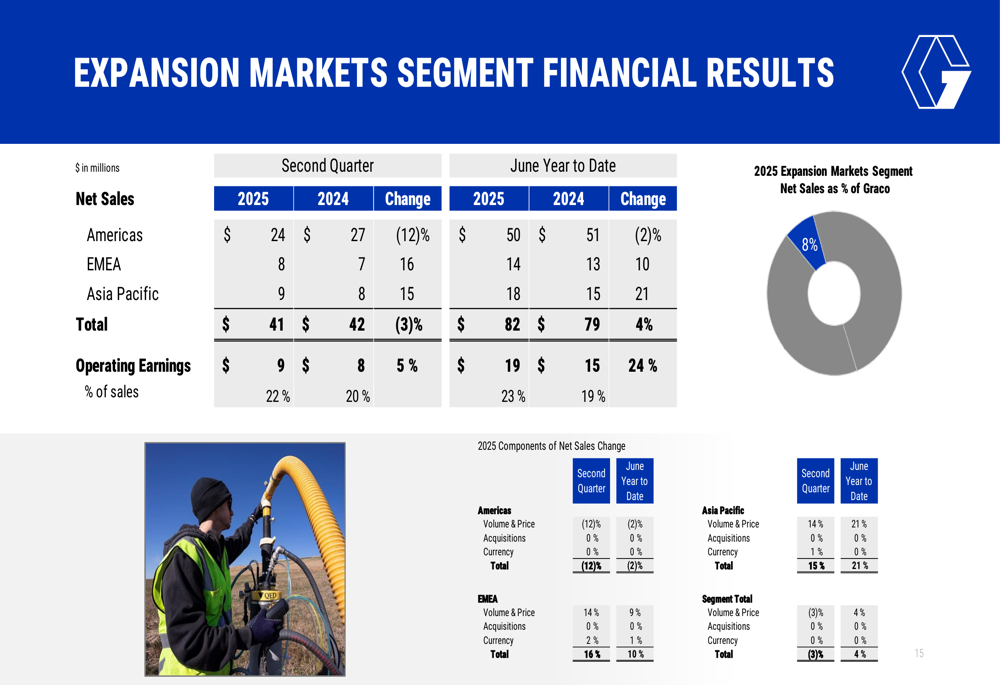
The smallest segment, Expansion Markets at 8% of total sales, experienced a 3% decline in revenue to $41 million, but a 5% increase in operating earnings to $9 million, improving margins from 20% to 22%.
Detailed Financial Analysis
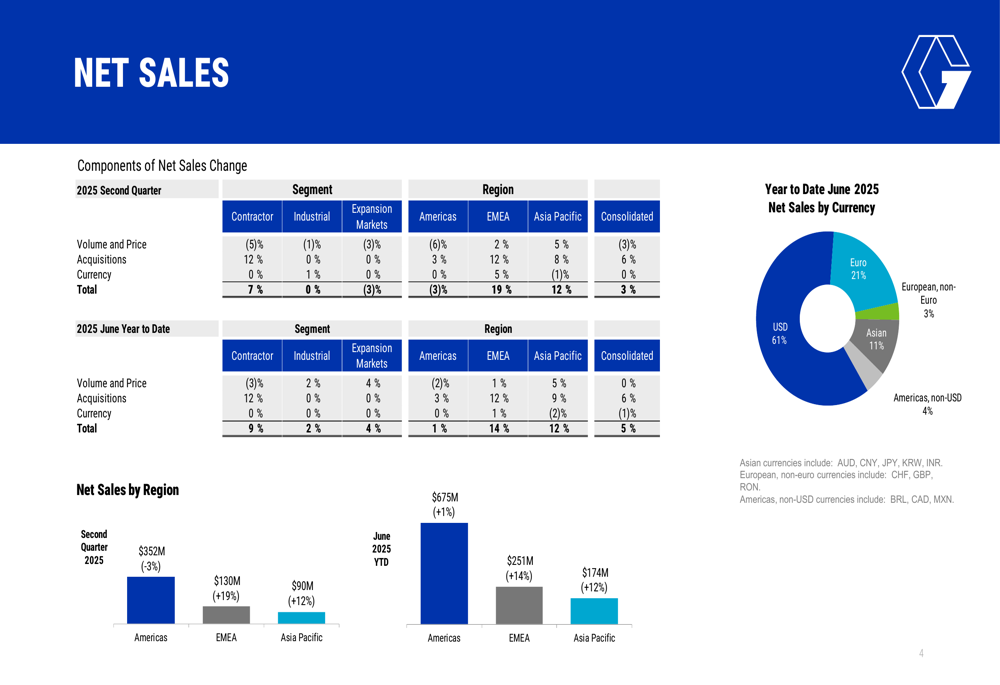
A closer examination of Graco’s sales performance reveals significant regional disparities. While the Americas region struggled with a 3% decline in Q2 sales, EMEA (Europe, Middle East, and Africa) delivered impressive 19% growth, and Asia Pacific grew by 12%.
The net sales analysis below highlights these regional differences and the critical role of acquisitions in driving overall growth:
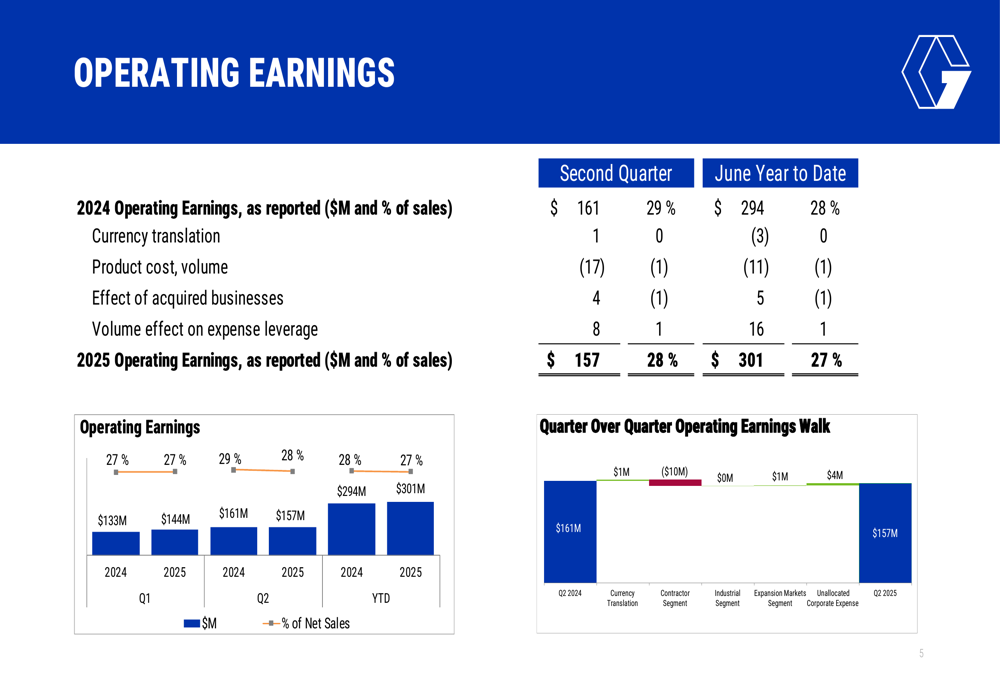
Operating earnings decreased by $4 million compared to Q2 2024, primarily due to higher product costs, including the unfavorable impact of tariffs. This was partially offset by the $4 million contribution from acquired businesses.
The following chart illustrates the key factors affecting operating earnings performance:
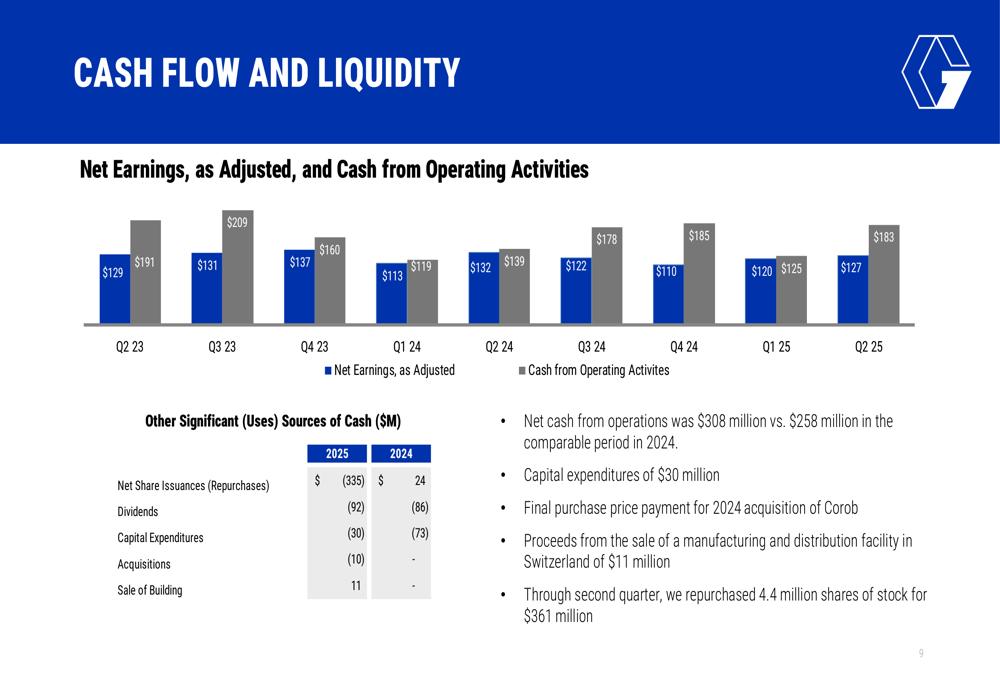
Graco’s cash position remains strong, with net cash from operations reaching $308 million compared to $258 million in the comparable period of 2024. The company continued its share repurchase program, buying back 4.4 million shares for $361 million through the second quarter.
Strategic Initiatives
Acquisitions remain central to Graco’s growth strategy, with recently acquired businesses contributing significantly to top-line growth while presenting short-term margin challenges. The company completed the final purchase price payment for its 2024 acquisition of Corob during the quarter.
Capital expenditures totaled $30 million in the first half of 2025, with expectations of approximately $60-70 million for the full year. The company also realized $11 million in proceeds from the sale of a manufacturing and distribution facility in Switzerland.
Regionally, Graco continues to focus on expanding its presence in EMEA and Asia Pacific, where growth remains robust, while addressing challenges in the Americas market.
Forward-Looking Statements
Looking ahead, Graco provided insights into expected performance for the remainder of 2025. The company anticipates unallocated corporate expenses to be approximately $37-40 million for the year and projects an effective tax rate between 19.5% and 20.5% for both the third quarter and full year 2025.
The following table shows the constant currency net sales change outlook by region and segment:
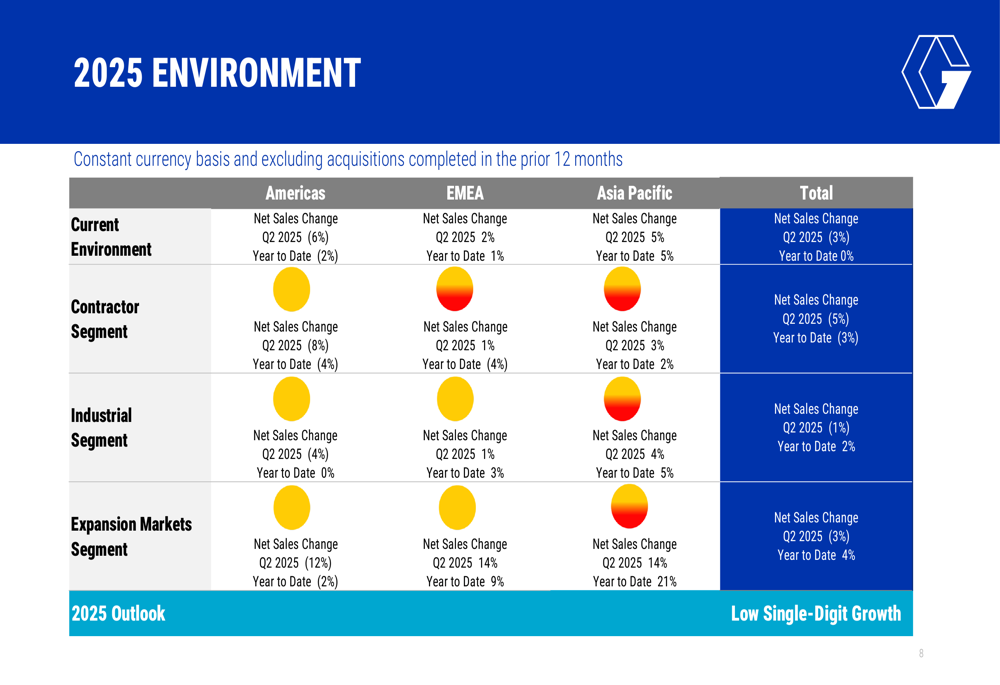
This forward-looking data suggests continued challenges in organic growth, particularly in the Americas region, while EMEA and Asia Pacific are expected to maintain positive momentum.
It’s worth noting that subsequent events have partially confirmed these trends. In its recently released Q3 2025 results, Graco reported revenue of $543 million, up 5% year-over-year but below analyst expectations of $563.11 million. Q3 adjusted EPS came in at $0.73, slightly below the forecasted $0.74, causing the stock to dip by 1.55% following the announcement.
Despite these challenges, Graco maintains its full-year revenue guidance of low single-digit growth, with management emphasizing the company’s operational strengths and financial discipline. With a current stock price of $80.66 (as of October 31, 2025) and trading within its 52-week range of $72.06 to $92.86, Graco continues to demonstrate resilience amid mixed market conditions.
Full presentation:
This article was generated with the support of AI and reviewed by an editor. For more information see our T&C.