US stock futures inch lower after Wall St marks fresh records on tech gains

Hanmi Financial Corporation (NASDAQ:HAFC) released its second quarter 2025 earnings presentation on July 22, revealing a decline in profitability despite improvements in asset quality and continued growth in loans and deposits. The Korean-American bank reported net income of $15.1 million, or $0.50 per diluted share, down from $17.7 million, or $0.58 per share, in the first quarter. The stock closed at $25.92, up 0.77% on the day of the announcement.
Quarterly Performance Highlights
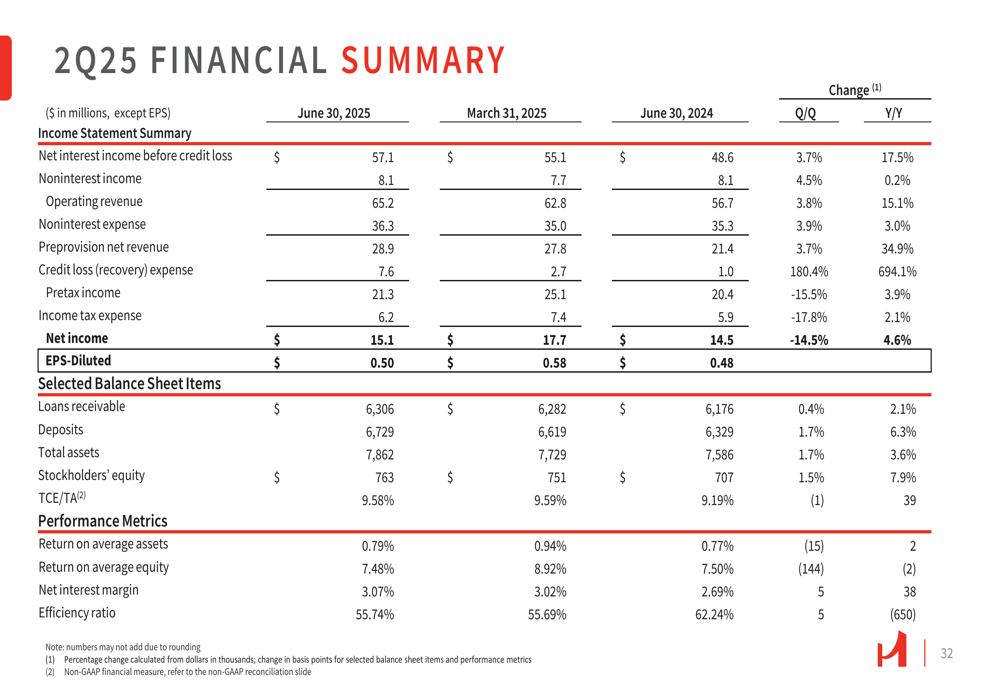
Hanmi’s second quarter results showed mixed performance across key metrics. Net income decreased by 14.7% from the previous quarter, while preprovision net revenues grew 3.7% to approximately $28.9 million. The bank’s efficiency ratio was 55.74%, with return on average equity (ROAE) at 7.48% and return on average assets (ROAA) at 0.79%, both down from 8.92% and 0.94% respectively in Q1.
Net interest margin improved slightly to 3.07%, up from 3.02% in the first quarter. Net interest income for Q2 was $57.1 million, while noninterest income increased 5% to $8.1 million. Noninterest expenses rose 4% to $36.3 million compared to the previous quarter.
As shown in the following comprehensive summary of Q2 performance metrics:
Loan and Deposit Portfolio Analysis
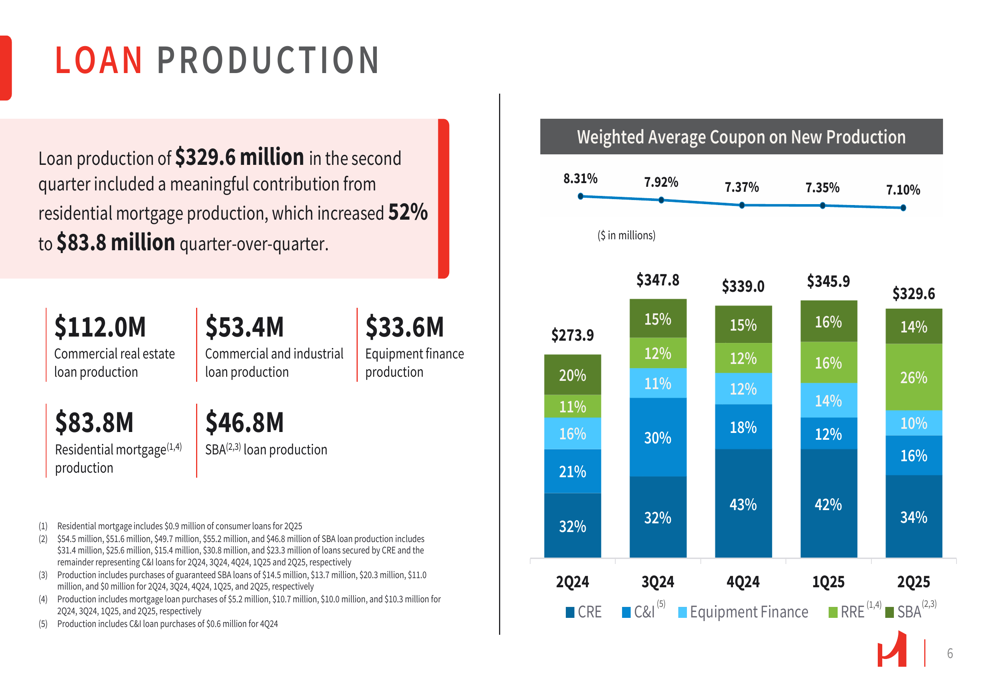
Hanmi reported modest growth in both loans and deposits during the second quarter. Loans receivable increased 0.4% to $6.31 billion, while deposits grew 1.7% to $6.73 billion. The loan production totaled $329.6 million, with a notable 52% increase in residential mortgage production to $83.8 million quarter-over-quarter.
The loan portfolio remains well-diversified, with commercial real estate (CRE) comprising 62% of total loans, residential real estate at 16%, commercial and industrial (C&I) loans at 15%, and equipment finance at 7%. The weighted average coupon rates on new production ranged from 7.10% for CRE loans to 7.37% for C&I loans, showing a general decline from the rates seen in Q2 2024.
The following chart illustrates the loan production breakdown and weighted average coupon trends:
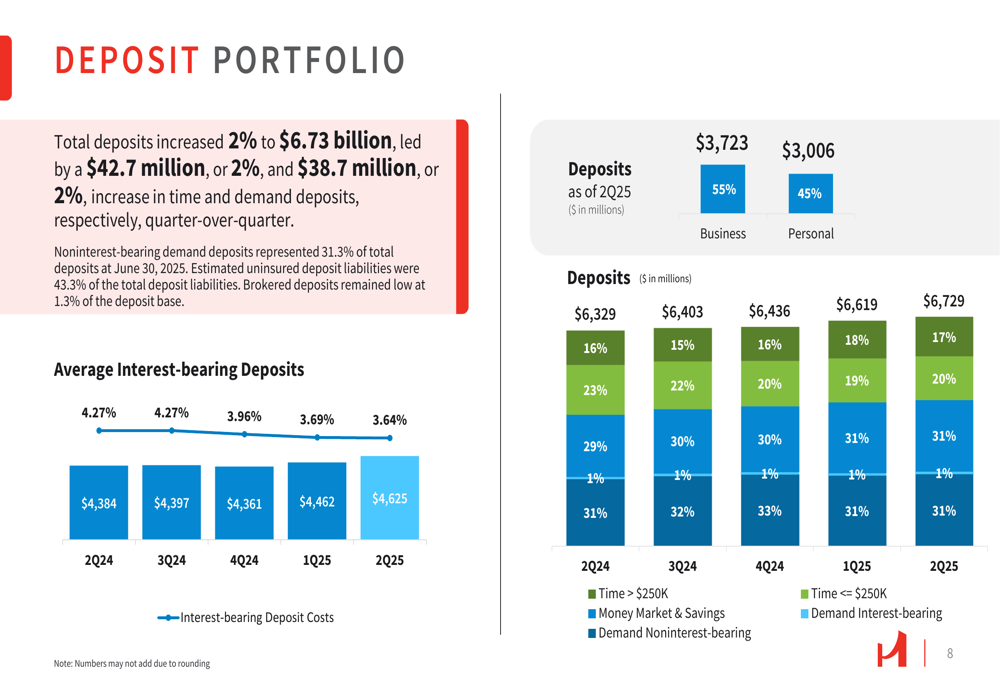
On the deposit side, Hanmi maintained a healthy mix with noninterest-bearing demand deposits representing 31.3% of total deposits. The deposit base is split between business (55%) and personal (45%) accounts, providing stability to the funding structure.
The deposit portfolio composition is detailed in this chart:
Asset Quality Improvements
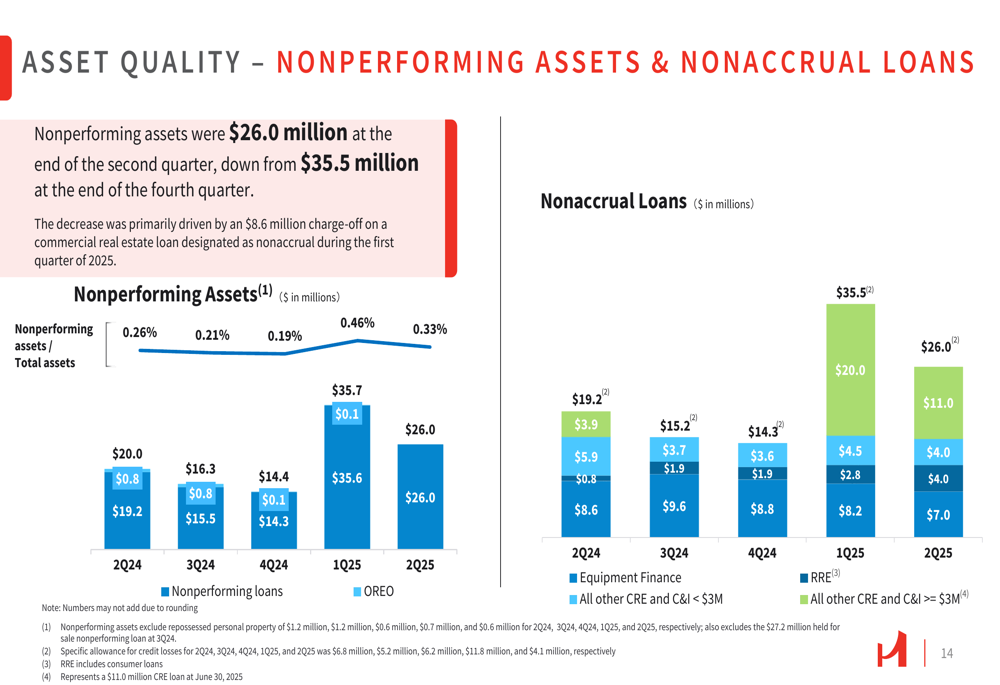
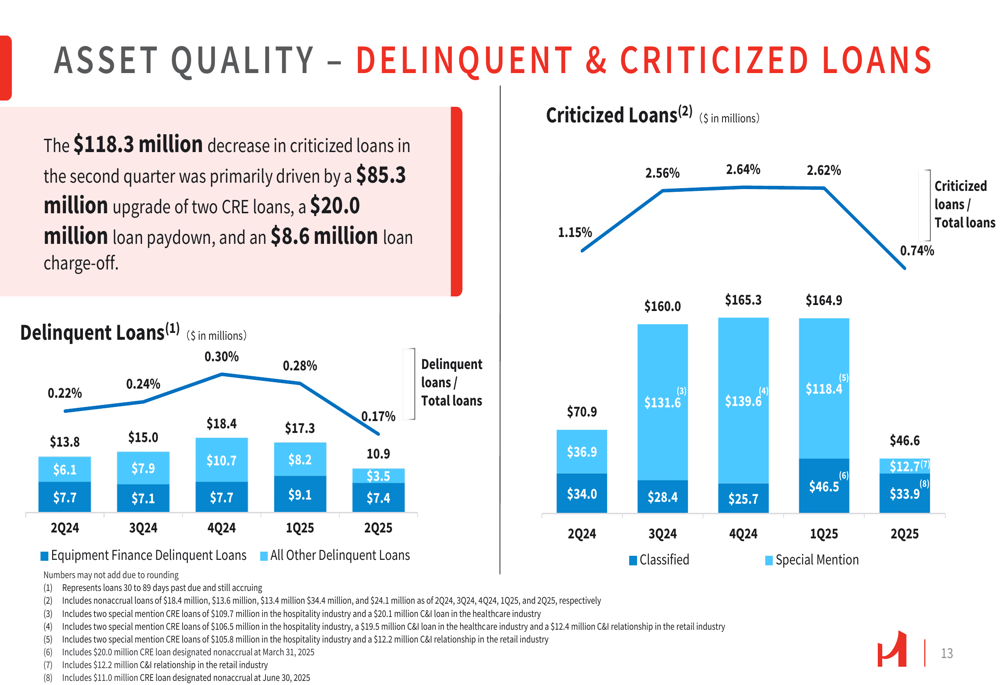
A significant bright spot in Hanmi’s Q2 results was the substantial improvement in asset quality metrics. Nonaccrual loans decreased 26.8% to 0.41% of total loans, while criticized loans saw a $118.3 million reduction, primarily driven by an $85.3 million upgrade of two CRE loans, a $20.0 million loan paydown, and an $8.6 million loan charge-off.
Nonperforming assets declined to $26.0 million at the end of Q2, down from $35.5 million at the end of Q4 2024. Net charge-offs for the quarter were $11.4 million, which included the aforementioned $8.6 million loan charge-off.
The following chart demonstrates the significant improvement in nonperforming assets and nonaccrual loans:
The allowance for credit losses stood at $66.8 million as of June 30, 2025, representing 1.06% of total loans, compared to $70.6 million and 1.12% at the end of the previous quarter. This reduction reflects the improved asset quality profile.
The delinquent and criticized loan trends are illustrated in this chart:
Capital Position and Liquidity
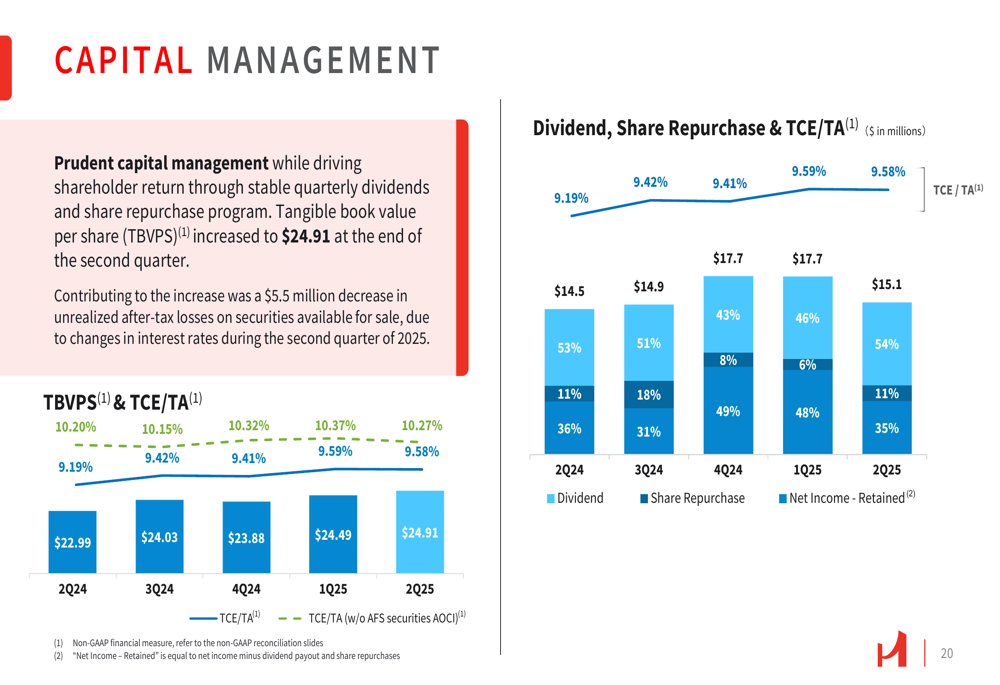
Hanmi maintained strong capital and liquidity positions in the second quarter. The tangible common equity to tangible assets ratio was 9.58%, while the common equity tier 1 capital ratio stood at 12.12%, both well above regulatory requirements. Tangible book value per share increased to $24.91.
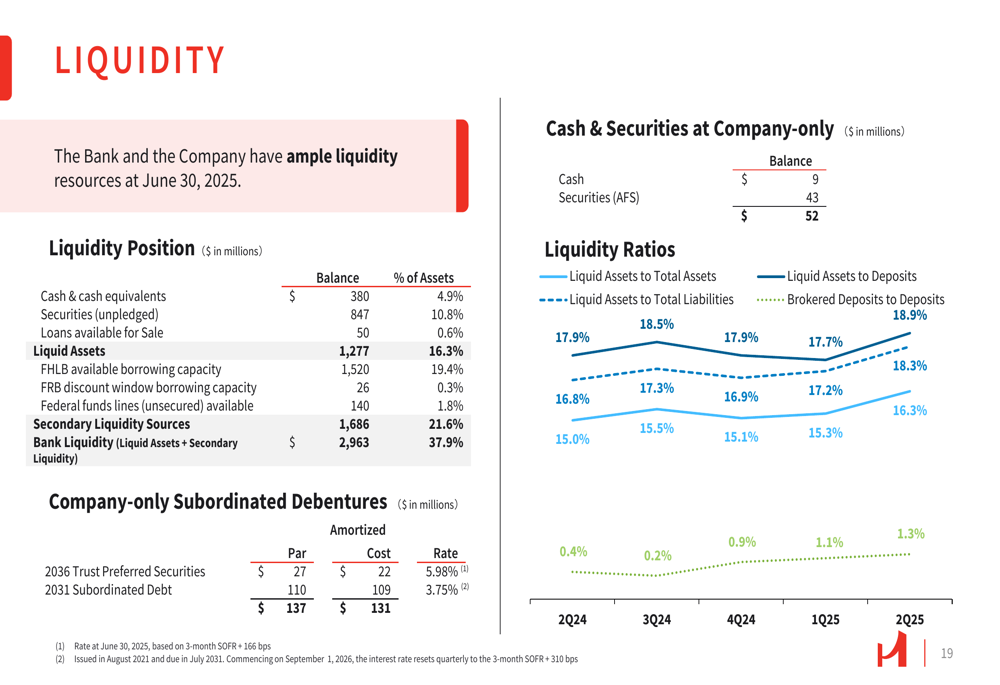
The bank’s liquidity position remains robust, with available liquidity of $3.27 billion, representing 49% of total deposits. The liquid assets to total assets ratio was 25.6%, while the liquid assets to total liabilities ratio was 28.4%.
The following chart details the company’s liquidity position:
Hanmi continued its capital management strategy, focusing on shareholder returns through stable quarterly dividends and its share repurchase program. The tangible book value per share has shown consistent growth over recent quarters.
As illustrated in this capital management overview:
Strategic Focus and Outlook
While Hanmi did not provide specific forward guidance in the presentation, the company’s focus on portfolio diversification and asset quality improvement appears to be yielding results. The significant reduction in criticized and nonaccrual loans suggests a proactive approach to managing credit risk.
The bank’s loan portfolio remains well-diversified across different sectors and geographies, with particular attention to potentially sensitive segments such as office, hospitality, and retail. The office loan portfolio stood at $556.5 million, the hospitality segment at $822.0 million (13% of total loans), and the retail segment at $1.12 billion (18% of total loans).
Hanmi’s second quarter results reflect a financial institution navigating a challenging environment with a focus on balance sheet strength and asset quality, despite the quarter-over-quarter decline in profitability. The improved asset quality metrics and continued growth in loans and deposits provide some positive indicators for future performance, even as earnings faced pressure in the current quarter.
Full presentation:
This article was generated with the support of AI and reviewed by an editor. For more information see our T&C.