5 big analyst AI moves: Apple lifted to Buy, AI chip bets reassessed

Introduction & Market Context
Hasbro Inc. (NASDAQ:HAS) released its third-quarter 2025 earnings on October 23, reporting an 8% revenue increase to $1.39 billion, exceeding analyst expectations of $1.35 billion. The company posted adjusted earnings per share of $1.68, surpassing the forecasted $1.63 by 3.07%. Despite these positive results, Hasbro’s stock fell 6.04% in premarket trading, closing at $70.62, well below its 52-week high of $82.19.
The toymaker’s performance was characterized by stark contrasts between segments, with Wizards of the Coast & Digital Gaming showing exceptional growth while Consumer Products continued to face challenges. This divergence highlights Hasbro’s ongoing transformation toward higher-margin businesses amid shifting retail dynamics and tariff pressures.
Quarterly Performance Highlights
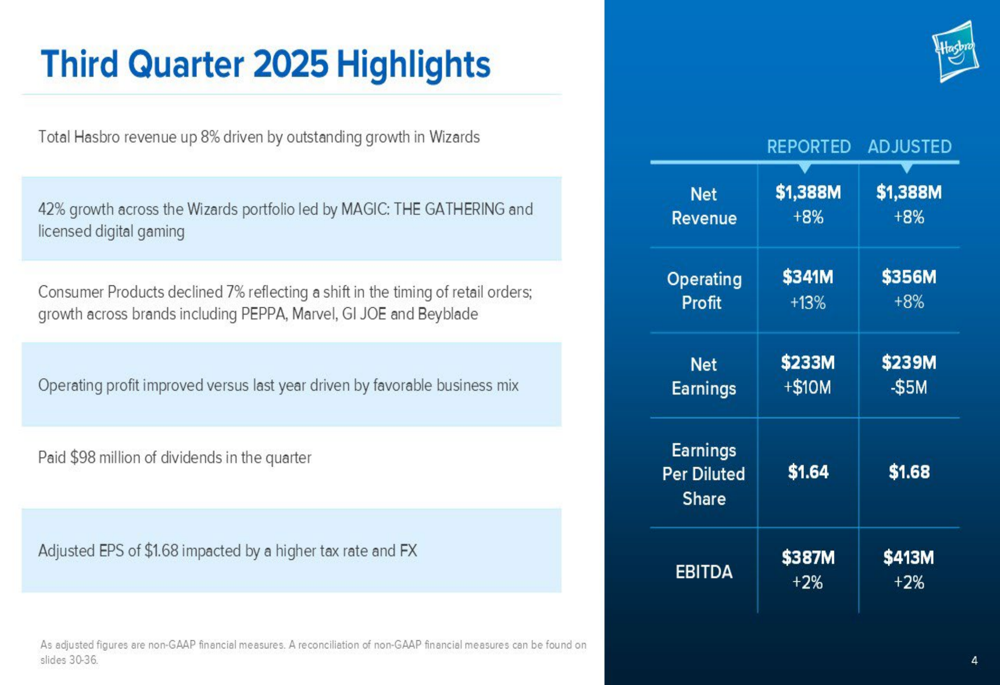
Hasbro’s third quarter showed solid overall growth, with total revenue increasing by 8% year-over-year to $1.39 billion. Adjusted operating profit also rose by 8% to $356 million, maintaining an adjusted operating margin of 25.6%. However, adjusted net earnings declined slightly to $239 million (down $5 million year-over-year), with adjusted EPS of $1.68 compared to $1.74 in the prior year, primarily due to higher tax rates and foreign exchange impacts.
As shown in the following quarterly highlights slide, the company’s performance was driven by 42% growth in the Wizards portfolio, while Consumer Products declined by 7%:
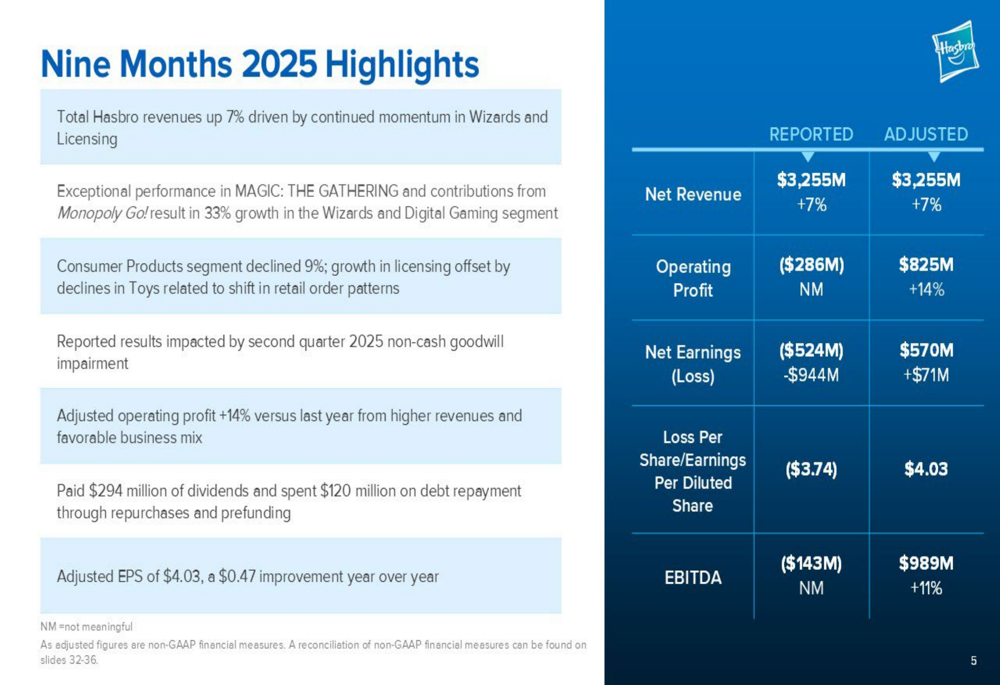
For the first nine months of 2025, Hasbro’s revenue increased by 7% to $3.26 billion, with adjusted operating profit rising 14% to $825 million. Adjusted earnings per share for the nine-month period reached $4.03, up $0.47 from the same period in 2024.
The following slide details the company’s year-to-date performance through Q3 2025:
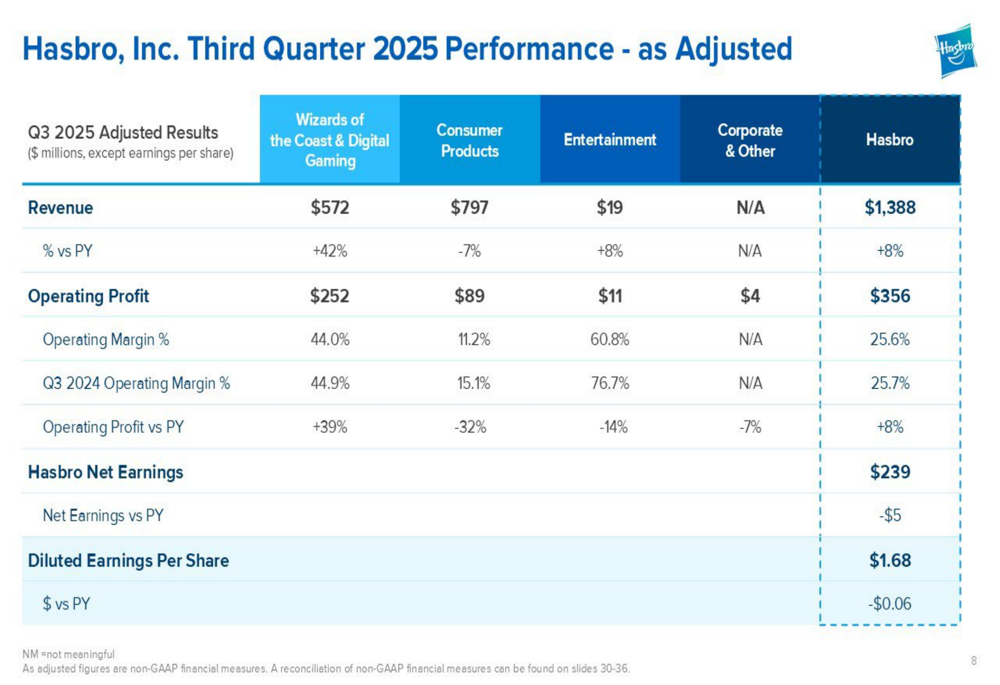
Breaking down the performance by segment reveals the stark contrast between Hasbro’s business units. The Wizards of the Coast & Digital Gaming segment led with $572 million in revenue (+42%), while Consumer Products generated $797 million (-7%) and Entertainment contributed $19 million (+8%).
The segment breakdown in the following slide illustrates how the adjusted operating margins vary significantly across business units, with Wizards achieving a remarkable 44.0% operating margin compared to just 11.2% for Consumer Products:
Wizards of the Coast Success
The standout performer for Hasbro continues to be the Wizards of the Coast & Digital Gaming segment, which saw a 42% increase in revenue during Q3 2025. This exceptional growth was primarily driven by the continued success of Magic: The Gathering, which first crossed $1 billion in annual revenue in 2022 and has maintained a 10-year compound annual growth rate of 13%.
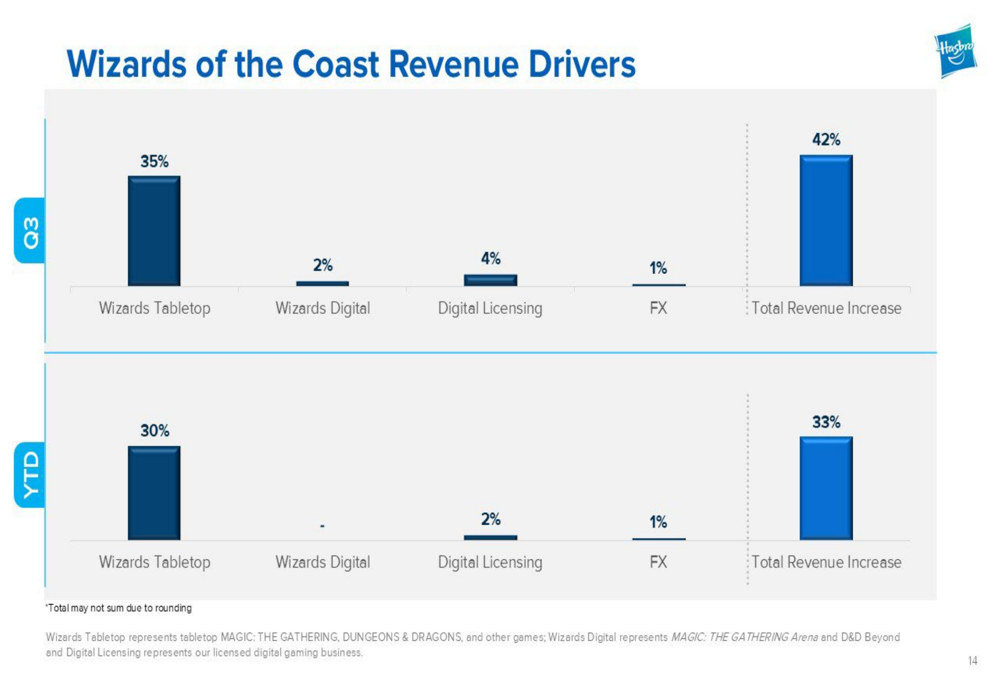
The following slide breaks down the revenue drivers for the Wizards segment, showing the substantial contribution from tabletop games:
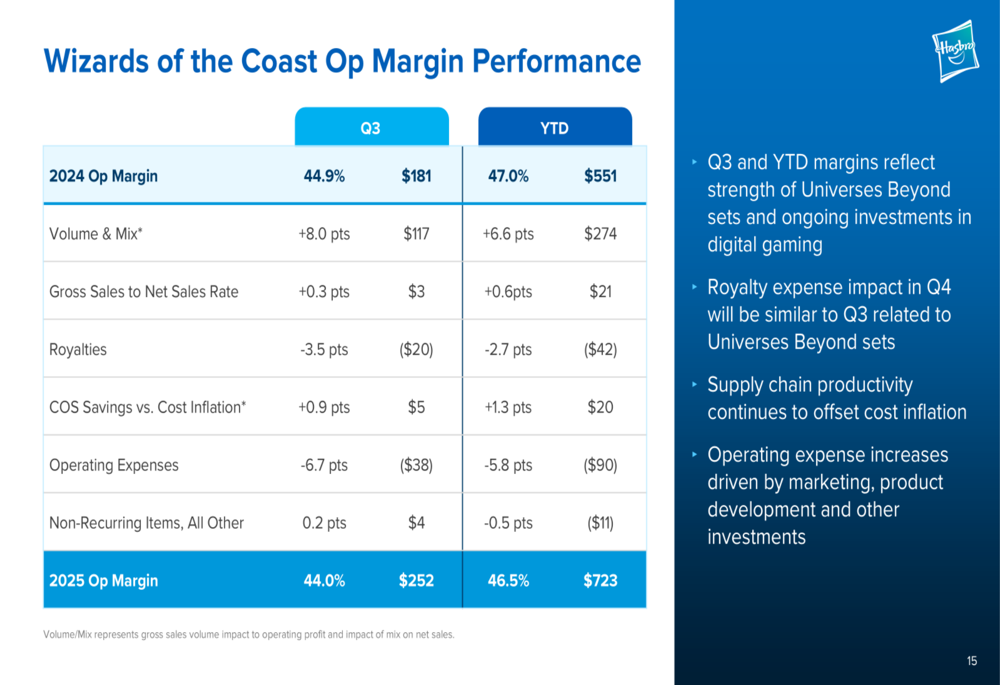
Despite the strong revenue growth, the Wizards segment’s operating margin decreased slightly from 44.9% in Q3 2024 to 44.0% in Q3 2025. This marginal decline was primarily due to increased operating expenses related to marketing, product development, and other investments, as well as higher royalty expenses associated with Universes Beyond sets.
The following slide details the factors affecting Wizards’ operating margin performance:
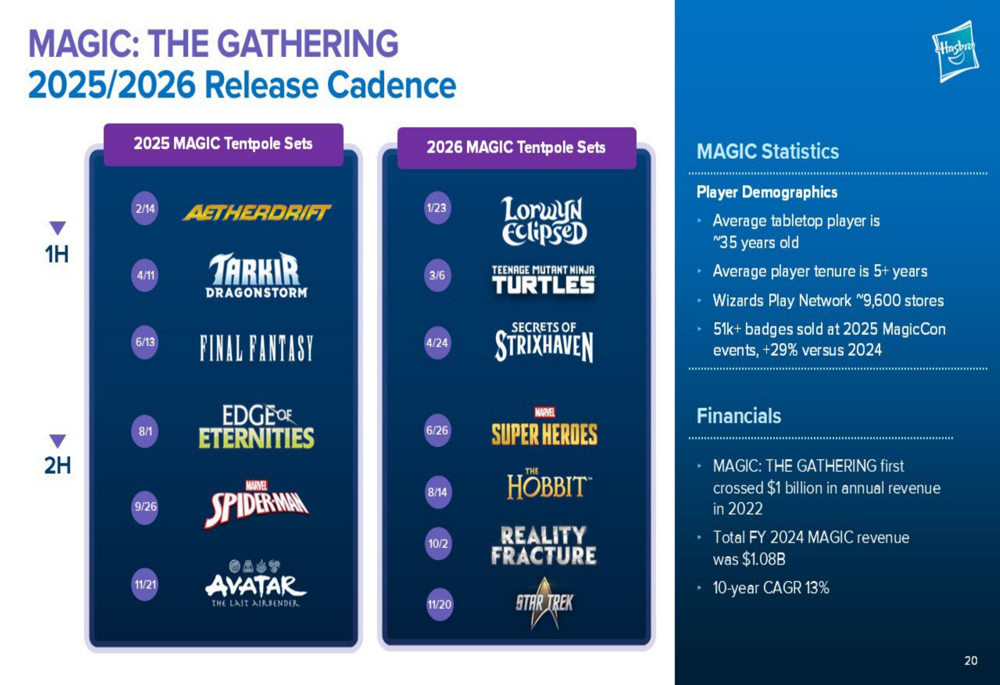
Hasbro also provided insight into Magic: The Gathering’s player demographics and future release schedule. The average tabletop player is 35 years old with more than five years of experience with the game. The company has an ambitious release schedule planned for 2025 and 2026, featuring collaborations with major entertainment properties including Final Fantasy, Marvel, Avatar: The Last Airbender, Star Trek, and The Hobbit.
As illustrated in this release calendar and statistics slide, Magic: The Gathering continues to be a cornerstone of Hasbro’s growth strategy:
Consumer Products Challenges
In contrast to Wizards’ strong performance, Hasbro’s Consumer Products segment faced significant headwinds, with revenue declining by 7% in Q3 2025. The company attributed this decrease primarily to shifting retail order patterns, with some orders moving from Q3 to Q4 in anticipation of the holiday season. However, brands like Peppa Pig, Marvel, GI Joe, and Beyblade did experience growth during the quarter.
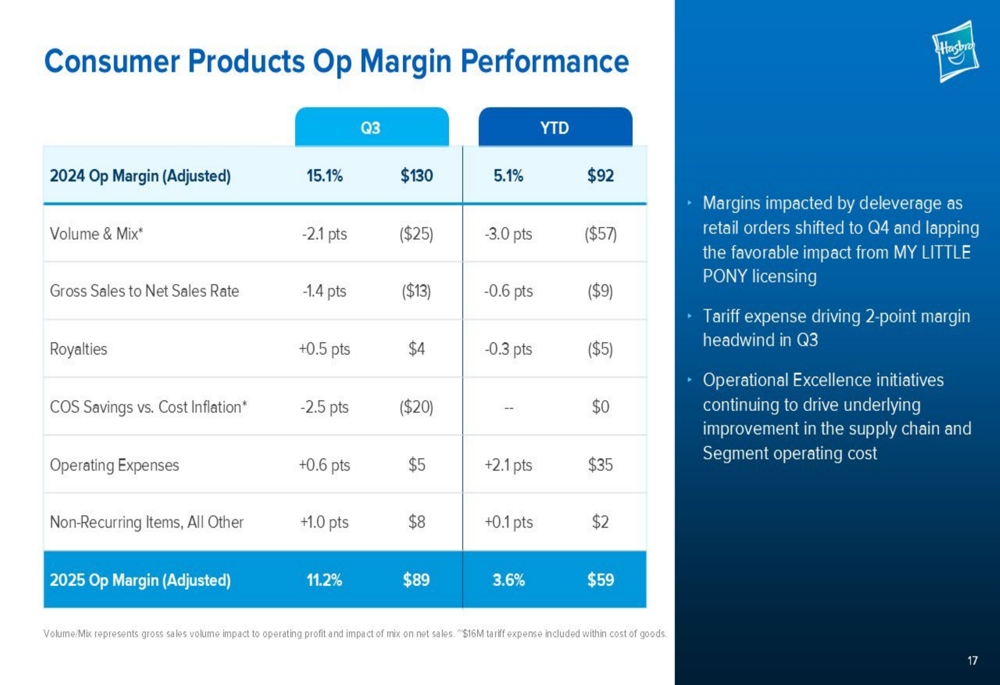
The segment’s adjusted operating margin contracted from 15.1% in Q3 2024 to 11.2% in Q3 2025, with tariff expenses creating a 2-percentage point margin headwind. The company noted that its Operational Excellence initiatives are helping to offset some of these pressures through supply chain improvements and cost reductions.
The following slide breaks down the factors affecting the Consumer Products segment’s operating margin:
Inventory management remains a focus area for Hasbro, with owned inventory up 6% year-over-year to $397 million, though still down 53% compared to Q3 2022 levels. The company attributed the increase to the timing of retailer shelf resets and higher inventory costs related to foreign exchange and tariffs.
Strategic Initiatives & Forward-Looking Statements
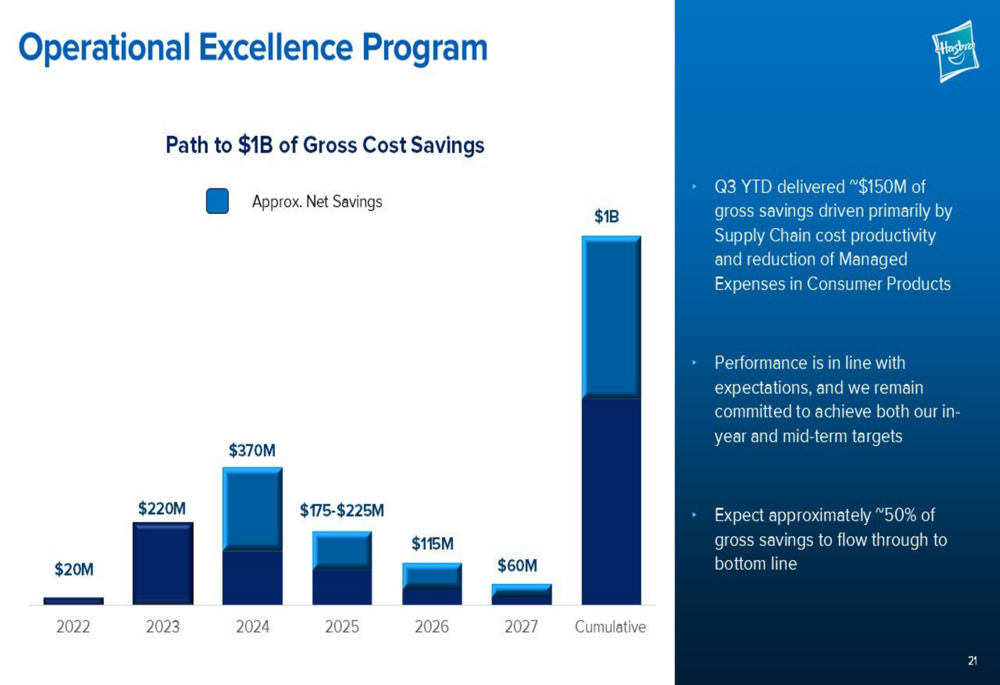
Hasbro continues to execute its Operational Excellence Program, which aims to deliver $1 billion in gross cost savings by 2027. Through Q3 2025, the company has delivered approximately $150 million in gross savings year-to-date, primarily through supply chain cost productivity and reduction of managed expenses in Consumer Products.
The following slide outlines the path to achieving the $1 billion savings target:
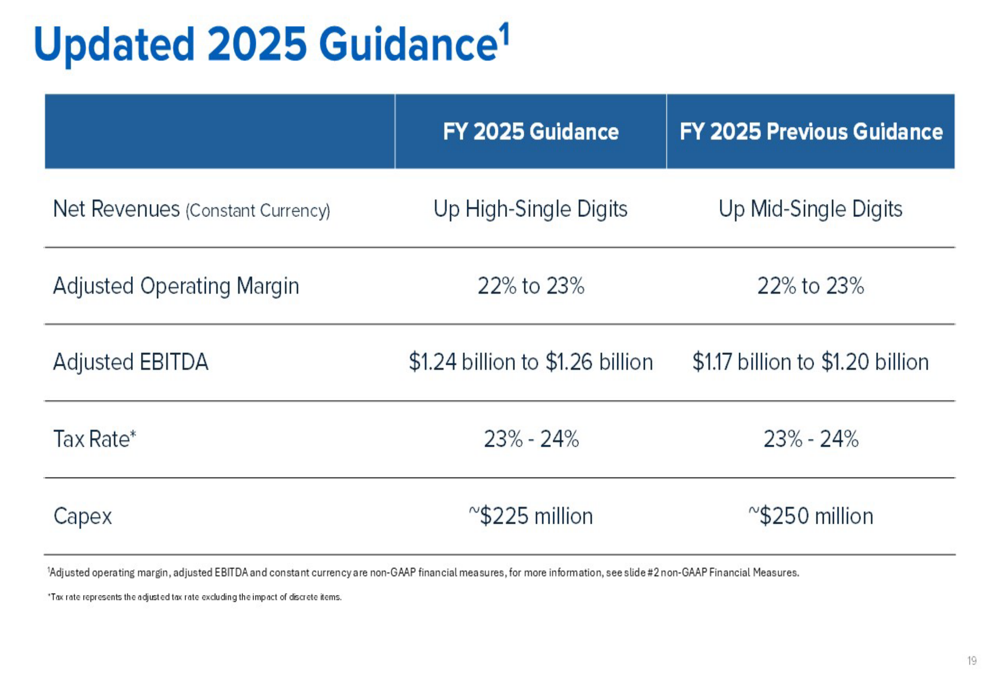
Based on strong performance in the Wizards segment, Hasbro raised its full-year 2025 revenue guidance from mid-single digit growth to high-single digit growth. The company also increased its adjusted EBITDA guidance to $1.24-$1.26 billion, up from the previous range of $1.17-$1.20 billion, while maintaining its adjusted operating margin guidance of 22-23%.
As shown in the updated guidance slide below, Hasbro is also reducing its expected capital expenditures for the year:
For the medium term (2025-2027), Hasbro is targeting mid-single digit revenue growth, 50-100 basis points of annual operating margin expansion, and a reduction in its leverage ratio to 2.5x gross debt to adjusted EBITDA by 2026.
Cash Flow & Capital Allocation
Hasbro’s operating cash flow for the first nine months of 2025 was $490 million, down from $588 million in the same period of 2024. The company attributed this decline to increased use of working capital. During this period, Hasbro returned $294 million to shareholders through dividends and spent $120 million on debt reduction as it works toward its target leverage ratio.
"We’re executing our tariff remediation playbook decisively," stated CFO Gina Goetter during the earnings call, highlighting the company’s proactive approach to mitigating tariff impacts.
Despite the overall positive financial results and raised guidance, investors appeared concerned about the continued challenges in the Consumer Products segment and the potential long-term impact of tariffs on margins. The contrast between the high-growth, high-margin Wizards business and the declining Consumer Products segment underscores Hasbro’s ongoing transformation as it focuses on its most profitable franchises while navigating a challenging retail environment.
Full presentation:
This article was generated with the support of AI and reviewed by an editor. For more information see our T&C.