Texas Roadhouse earnings missed by $0.05, revenue topped estimates

Introduction & Market Context
Hyatt Hotels Corporation (NYSE:H) reported a net loss in its second quarter of 2025 but demonstrated strong operational growth across key metrics, according to the company’s investor presentation released on August 7, 2025. The hotel chain’s stock responded positively, rising 5.11% in premarket trading to $143, reflecting investor confidence in the company’s long-term strategy despite the quarterly loss.
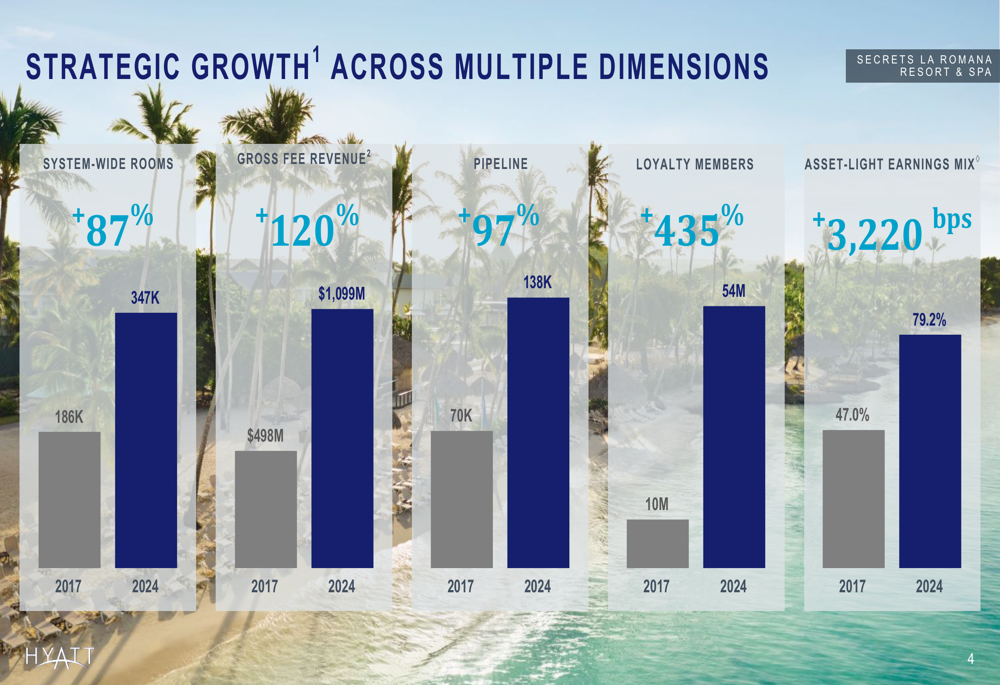
The company continues its strategic transformation toward an asset-light business model, which now represents 79% of its earnings mix. This represents significant progress from 47% in 2017, positioning Hyatt as an industry leader in this category.
Quarterly Performance Highlights
Hyatt reported a net loss of $3 million for Q2 2025, translating to a diluted EPS of $(0.03). Despite the bottom-line loss, the company delivered $303 million in adjusted EBITDA and $301 million in gross fees.
Operational metrics showed considerable strength, with system-wide RevPAR growing 1.6% year-over-year. This marks a deceleration from the 5.7% RevPAR growth reported in Q1 2025, suggesting some moderation in travel demand.
The standout metric was net rooms growth, which reached 11.8% (6.5% excluding acquisitions). This robust expansion underscores Hyatt’s continued focus on portfolio growth even amid challenging market conditions.
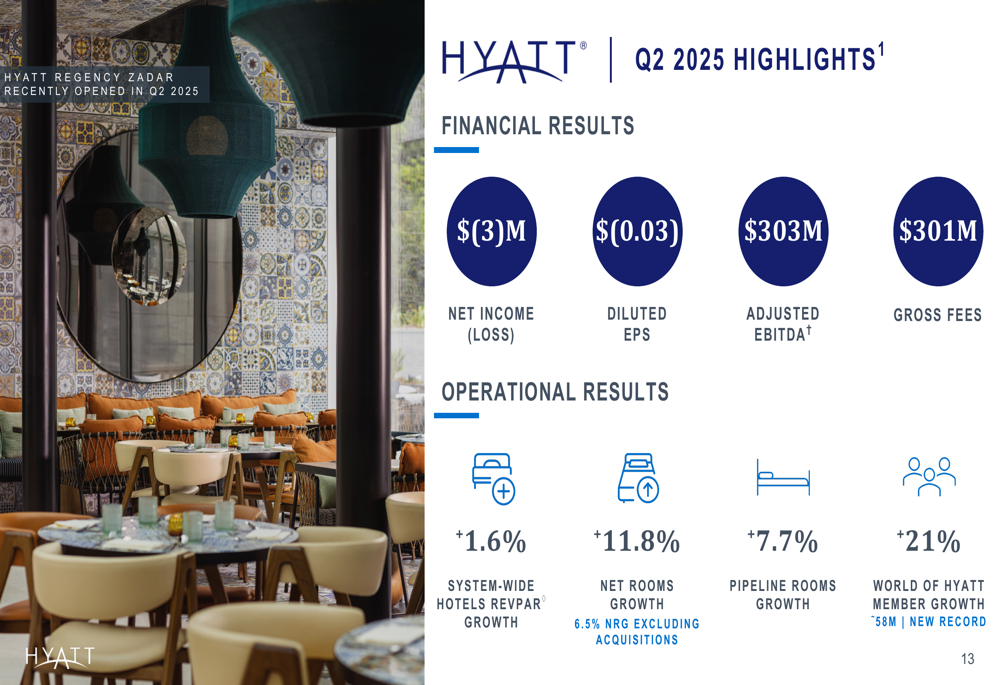
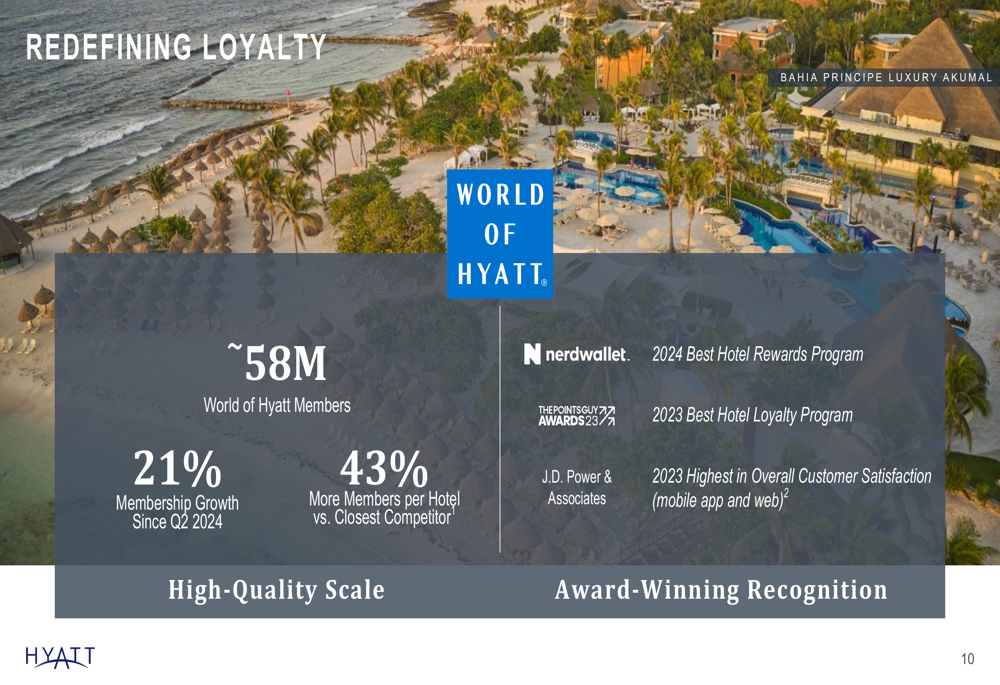
The company’s loyalty program, World of Hyatt, achieved a significant milestone, growing 21% year-over-year to reach approximately 58 million members. This represents a new record for the program and demonstrates Hyatt’s success in building customer loyalty and engagement.
Strategic Initiatives
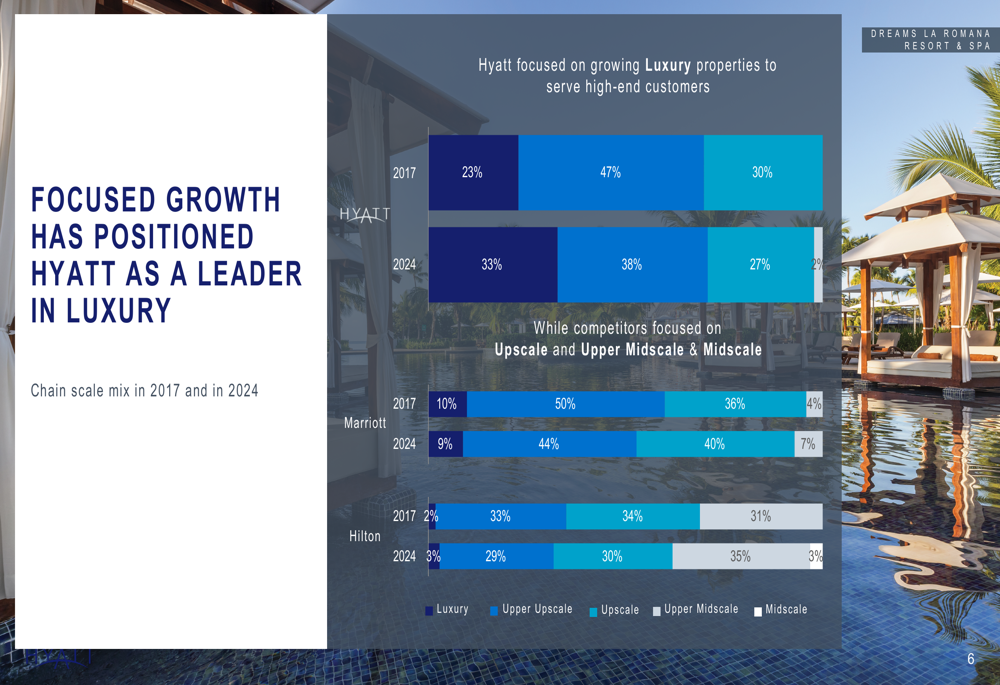
Hyatt’s presentation emphasized its strategic focus on luxury hospitality, with 33% of its portfolio now in the luxury segment, up from 23% in 2017. This positions the company differently from competitors like Marriott and Hilton, which have greater exposure to upscale and upper midscale properties.
The company has achieved remarkable growth across multiple dimensions since 2017, including an 87% increase in system-wide rooms, 120% growth in gross fee revenue, and a 97% expansion in its development pipeline. Most notably, loyalty program membership has surged by 435% during this period.
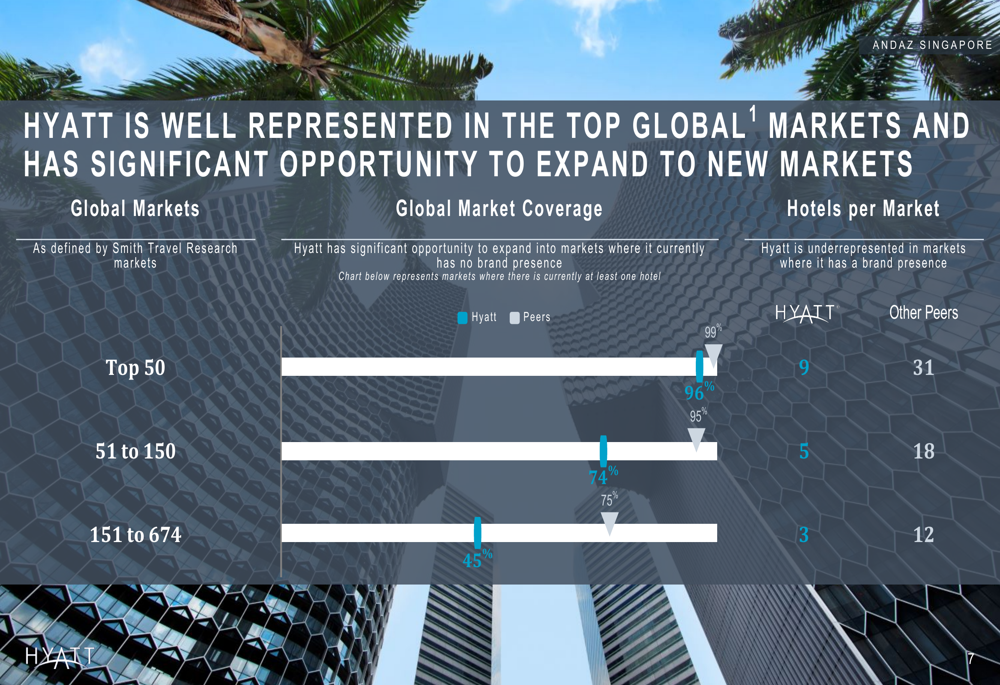
Hyatt’s global footprint continues to expand, with presence in 99% of the top 50 global markets. However, the presentation highlighted significant growth opportunities in smaller markets (ranked 151-674) where Hyatt has only 45% coverage compared to competitors’ 74-75%.
Detailed Financial Analysis
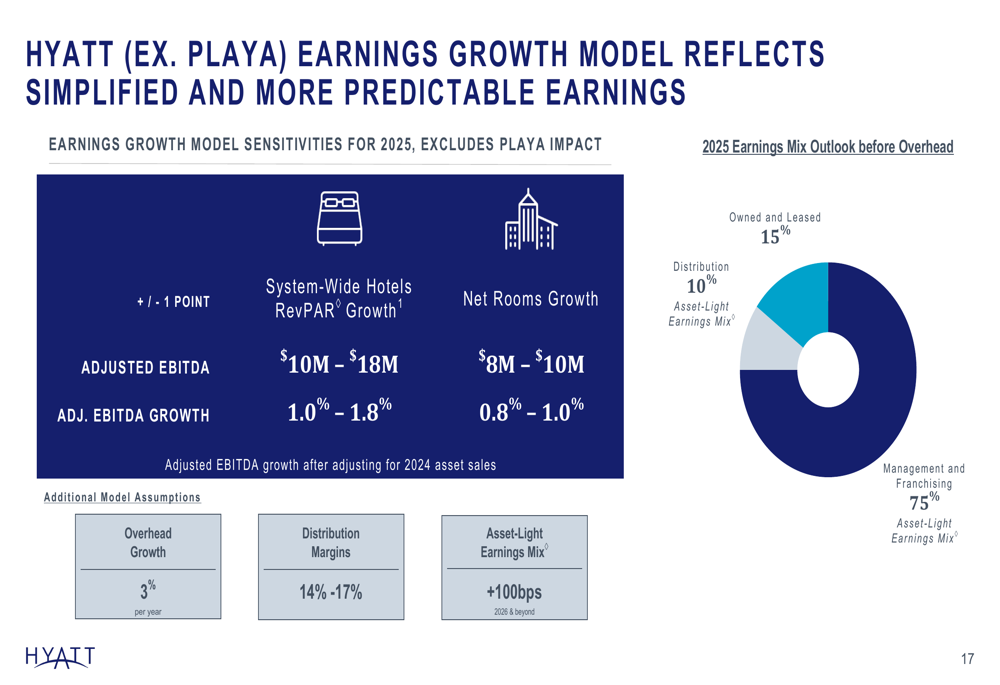
The company’s earnings growth model illustrates its transition to a more predictable revenue stream, with management and franchising representing 75% of earnings mix before overhead. The model indicates that each percentage point of RevPAR growth translates to $10-18 million in adjusted EBITDA, while each percentage point of net rooms growth generates $8-10 million.
In 2024, Hyatt completed significant asset sales totaling $1.9 billion in gross proceeds. These transactions reduced the company’s owned and leased segment adjusted EBITDA by approximately $156 million on a 2023 basis, further advancing the asset-light strategy.
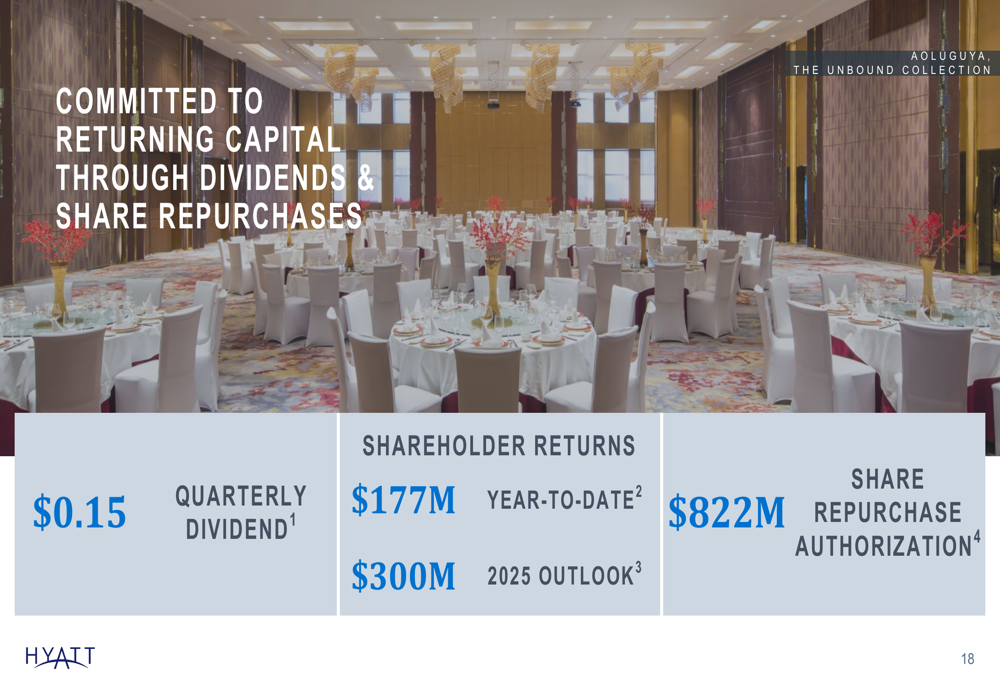
Hyatt remains committed to returning capital to shareholders, maintaining a quarterly dividend of $0.15 per share. Year-to-date, the company has returned $177 million to shareholders and projects total returns of $300 million for full-year 2025. The company still has $822 million remaining in its share repurchase authorization.
The company maintains investment-grade credit ratings from all three major agencies (BBB- from S&P and Fitch, Baa3 from Moody’s), with stable outlooks across the board. Total (EPA:TTEF) debt stands at $6.0 billion, including a $1.7 billion delayed draw term loan.
Forward-Looking Statements
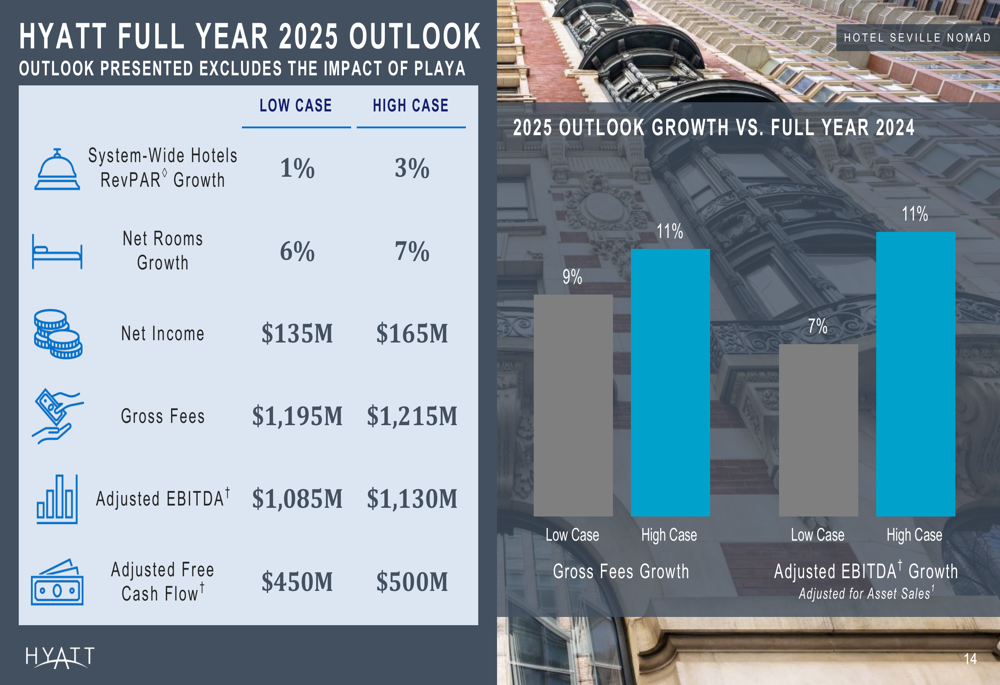
For full-year 2025, Hyatt provided guidance ranges that exclude the impact of its Playa acquisition:
- System-wide RevPAR growth of 1-3%
- Net rooms growth of 6-7%
- Net income of $135-165 million
- Gross fees of $1,195-1,215 million
- Adjusted EBITDA of $1,085-1,130 million
- Adjusted free cash flow of $450-500 million
Looking beyond 2025, Hyatt projects its asset-light earnings mix to reach 90% or greater on a pro-forma basis by 2027. The company’s long-term strategy continues to focus on enhancing its network effect through its award-winning loyalty program and premium brand portfolio, particularly in the luxury and upper upscale segments.
The presentation reinforces Hyatt’s commitment to its purpose statement: "We care for people so they can be their best," which underpins its approach to hospitality and business strategy.
Despite the quarterly net loss, the market’s positive reaction suggests investors remain confident in Hyatt’s long-term strategy and growth trajectory. With strong rooms growth, pipeline expansion, and continued progress toward an asset-light model, the company appears well-positioned to navigate the evolving hospitality landscape.
Full presentation:
This article was generated with the support of AI and reviewed by an editor. For more information see our T&C.